AWS Partner Network (APN) Blog
Simplifying Tenant Cost Allocation in a SaaS Solution on AWS with CloudZero
By Kevin Mueller, Principal Technologist – CloudZero
By Ujwal Bukka, Sr. Partner Solutions Architect – AWS SaaS Factory
By Bill Tarr, Sr. Partner Solutions Architect – AWS SaaS Factory
 |
| CloudZero |
 |
Successfully operating any workload in the cloud requires careful attention to cost optimization, and a need to continually evaluate and refine spending of Amazon Web Services (AWS) resources.
In a multi-tenant software-as-a-service (SaaS) solution, this often means maintaining an in-depth understanding of the cost footprint of each tenant. Understanding the operating costs of your tenants allows you to improve your operating model iteratively, evaluate pricing and renewals, optimize resource allocation, and gain operational efficiencies.
The Cost Optimization Pillar of the SaaS Lens for the AWS Well-Architected Framework emphasizes the need for expenditure awareness by measuring tenant consumption and correlating it to tenant costs. This can prove challenging in SaaS solutions, where resources are shared across tenants.
Calculating the cost per tenant for these shared resources can take significant development effort. Offloading undifferentiated heavy lifting, like tenant cost allocation, can enable SaaS providers to focus on their core competencies. As the SaaS Lens notes, “The shortest path here is often to engage with an AWS Partner to deal with the nuances of ingesting and summarizing AWS cost.”
In this guide, we’ll explore how to leverage CloudZero to gain visibility into tenant consumption. We’ll also cover how you can gain insights into tenant cost using CloudZero’s Enhanced Unit Cost Analytics.
CloudZero is an AWS Partner and cloud cost intelligence platform that puts spend into the context of your business. By aligning engineering and finance around metrics that matter, CloudZero enables better decision-making, improved unit economics, and efficient spending.
Solution Overview
The focal point of this solution is code to instrument a SaaS application to generate tenant-aware metrics, aggregate our tenant usage, and publish it to CloudZero.
We’ve used the Serverless SaaS Reference Architecture created by the AWS SaaS Factory program to demonstrate the solution, but you don’t have to use it. You could instrument your own application with the code in this repository, or simply create and instrument an AWS Lambda function that logs the appropriate format to Amazon CloudWatch for the aggregator to send to CloudZero if you prefer.
To demonstrate CloudZero’s cost allocation capabilities, we’ll install the SaaS architecture in our AWS account, following the steps described in Setting up the environment.
This solution allows us to create tenants with both dedicated resources, and those who share most or all of their resources. The different tenant tiers allow us to demonstrate both default CloudZero cost allocation, and sending data to the CloudZero Telemetry API.
Once your application is set up, the next step is to link your AWS account to CloudZero by creating an account at app.cloudzero.com, and then following its account connection instructions.
These instructions kick off an AWS CloudFormation script that creates a cross-account role easily integrating your AWS account, and the CloudZero SaaS account. If you haven’t done so already, you’ll need to configure and enable cost allocation tags inside your AWS account and validate the format of your AWS Cost and Usage Report.
At this point, the solutions should resemble Figure 1 below, with your AWS account linked to CloudZero, giving it access to your Cost and Usage Report, and your code instrumented to send tenant usage data to CloudZero’s Telemetry API.

Figure 1 – Solution overview.
In order to get meaningful data for CloudZero to be able to allocate costs, we’ll need to apply load to our solution that will create actual usage cost in our AWS account.
Following the instructions in the SaaS architecture’s documentation, we onboard four “Premium” tier tenants, who have their own dedicated resources, and four “Standard” tier tenants who primarily utilize shared resources.
We use a load testing tool called Artillery.io, utilizing a configuration script similar to Figure 2. This invokes tenant API endpoints—with a JSON Web Token (JWT) that we can obtain from the SaaS architecture user interface (UI)— generating usage and AWS cost for CloudZero to measure.

Figure 2 – Artillery configuration for calling product API endpoint.
After we obtain the Amazon API Gateway ID for the SaaS architecture from the Amazon DynamoDB table “ServerlessSaaS-TenantDetails”, we then run Artillery with the following command:
artillery run artillery.yml --target https://API-ID.execute-api.us-west-2.amazonaws.com
Now that we’ve accumulated some tenant consumption, let’s examine the costs of our tenants through the lens that CloudZero provides.
Grouping AWS Costs with CostFormation
Take a closer look at the SaaS architecture in Figure 3. Notice we have tenant application, which can be pooled or siloed, as well as services which are shared across our tenants.

Figure 3 – SaaS architecture.
CloudZero leverages a domain-specific language called CostFormation to define dimensions that group costs, allocating the costs even if the underlying AWS resources are untagged or un-taggable.
Take a look at Figure 4 below and see how CloudZero has visualized our costs. Notice the costs have been allocated to the same categories as our SaaS architecture, with shared services and siloed and pooled application services.
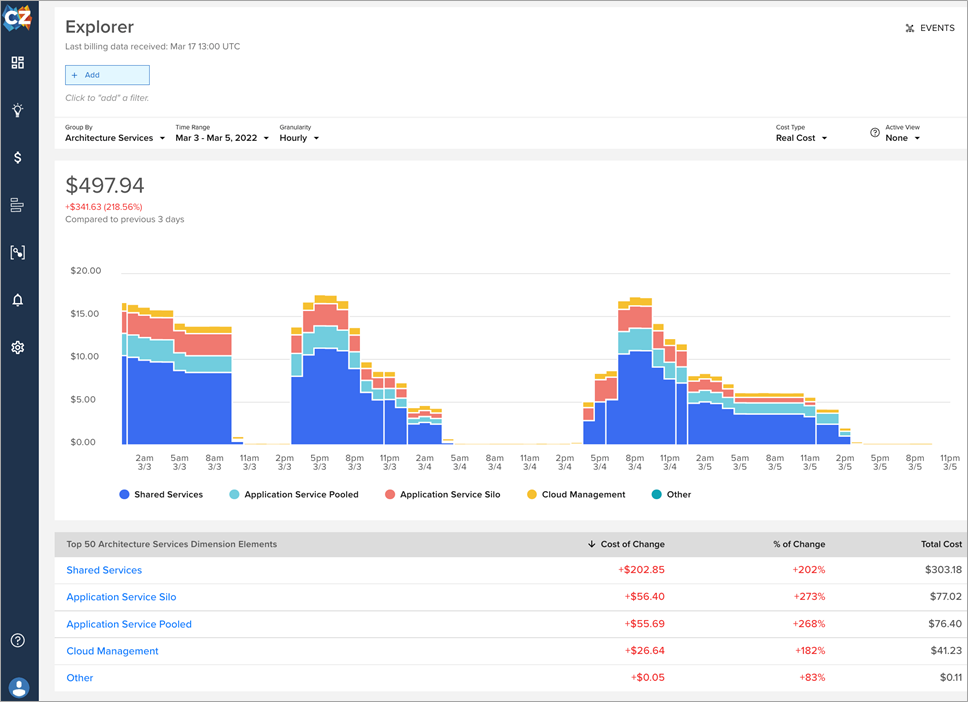
Figure 4 – CloudZero Explorer with broad cost grouping.
In Figure 5 below is the CloudZero CostFormation used to create the dimensions that allow us to see our application costs broken out in the image above.

Figure 5 – CostFormation configuration.
CostFormation allows you to execute conditional logic against AWS metadata and is not limited to tags. Changes to the definitions take effect in minutes, allowing changes to be observed near real-time unlike tags taking days to see changes.
Allocating Costs for Dedicated Tenant Resources
Now that we’ve set up our dimensions in CostFormation, we can use the CloudZero Explorer to drill into the allocation the costs for our silo tenants. We add a filter so we only show the “Application Services Silo” and group by “Customers” so we can see the cost of each premium silo customer.

Figure 6 – CloudZero Explorer grouping silo tenant costs.
Observe that Figure 6 shows the $77.02 of “Application Service Silo” we saw in Figure 4 divided across the tenant identifiers for our four silo tenants. With CostExplorer configuration, we were able to allocate the dedicated resources of our siloed tenant costs in the CloudZero Explorer.
Cost Insights for Shared Resources
Let’s examine how to capture tenant consumption for pooled resources in the SaaS architecture to derive cost per tenant. We’ll use a more granular approach to measure our shared tenant consumption by capturing detailed data about how tenants consume resources using CloudZero’s Enhanced Unit Cost Analytics to take in tenant consumption metrics and allocate shared cost.
Depending upon your SaaS application, you can capture various metrics which can provide insights into tenant consumption. Our SaaS architecture already captures some basic metrics; we could update it to capture different metrics, but our goal is to get tenant consumption information with minimum code changes to our SaaS application.
The approach we describe here is for pooled resources, where we’ll scrape through the metrics and logs captured by the reference solution, which must contain a tenant identifier.
To do this, we will capture two metrics: one is the number of AWS Lambda invocations per tenant, and the other is the number of read capacity units (RCU) and write capacity units (WCU) consumed from Amazon DynamoDB tables by each tenant.
We will use Amazon CloudWatch Logs Insights queries to capture this metrics information by scraping through the Amazon CloudWatch Logs for the various micro services of the SaaS architecture.
Capturing AWS Lambda Invocations
Our pooled tenants share product and order application services deployed in the reference solution, and their create, read, update, and delete operations are represented using Lambda functions. Whenever the Lambda functions of this product or order services are invoked, they log various messages to Amazon CloudWatch Logs.
You can use the below CloudWatch Logs Insights query to look for specific messages which will be logged by Lambda function and approximate it as a Lambda invocation.

Figure 7 – CloudWatch Logs Insights query for Lambda executions.
The query above will count “Request completed” messages logged by Lambda functions in the CloudWatch Logs groups.
Capturing Amazon DynamoDB Usage
For Amazon DynamoDB capacity units, we aggregate the capacity units for each pooled product and order application services in the SaaS architecture. For pooled product service, we will use CreateProductFunction and UpdateProductFunction to calculate WCU, and will use GetProductsFunction to calculate RCU.
These Lambda functions—when creating, updating, and retrieving the items from a DynamoDB table—will capture and log a metric with name “ProductCreated” and a number of items created. They’ll also capture and log a metric with name “ProductUpdated,” and a number of items updated, as well as a metric with name “ProductRetrieved” and a number of items retrieved respectively to Amazon CloudWatch Logs.
You can then use the following CloudWatch Logs Insights query to calculate total capacity units (RCU+WCU).

Figure 8 – CloudWatch Logs Insights query for DynamoDB product service.
The query above will look for a “ProductCreated” or “ProductUpdated” or “ProductRetrieved” metric message in the logs and retrieve its corresponding value on the number of items created or updated or retrieved, and then sum all of those items counts to calculate the total capacity units.
Let’s try to understand the approach we used to calculate DynamoDB capacity units. One write capacity unit represents one write for an item up to 1 KB in size, and one read capacity unit represents one strongly consistent read request or two eventually consistent read requests for an item up to 4 KB in size. Please refer to RCU and WCU link for more details.
In the SaaS architecture, the DynamoDB tables items data of product and order services is less than 1KB and read operations are eventually consistent.
When application services read one item from a DynamoDB table, only 0.5 RCU will be consumed when they write an item, as they are less than 1KB they consume 1 WCU unit.
In the above query for the items retrieved count, we are multiplying with 0.5 to get accurate RCUs, and when you create or update an item we consider the create or update count as the number of WCUs.
You can also update the product and order application services to capture and log RCU and WCU values when they read or write items, and then use the query to get the sum of capacity units too. Here, we are trying to capture metrics using a minimally invasive approach and with zero changes to the SaaS application in our SaaS architecture.
You can use below query for order service:
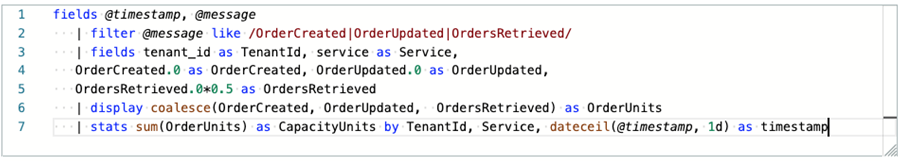
Figure 9 – CloudWatch Logs Insights query for DynamoDB order service.
Aggregator Code
The aggregator code which runs the CloudWatch Logs Insights queries shown in Figure 8 and Figure 9 sends the metric data to CloudZero. We’ve put the code in a single Python script named “aggregator-code-cloudzero.py” in this GitHub repository.
The aggregate_lambda_invocations_by_tenant method takes care of aggregating Lambda invocations, and the aggregate_dynamodb_capacity_units_by_tenant method takes care of aggregating DynamoDB capacity units.
Since we’re running the SaaS architecture to capture metrics, you observe this aggregator code is specific to our solution. You can use this concept of capturing metrics from log groups using CloudWatch Logs Insights queries, and use this sample code to customize your solution.
Aggregate Lambda Invocations
As explained earlier, we will calculate Lambda invocations of the pooled functions such as CreateOrderFunction, CreateProductionFunction, GetOrdersFunction, and GetProductionsFunction.
The code evaluates the log group name based on the function name and adds it to a list of log group names, executing the query using the query_cloudwatch_logs method. Our code then pulls all Lambda function invocations from their log groups for the past configured NUMBER_OF_HOURS environment variable value. We aggregate the invocations by tenant and by service and use the post_telemetry_records method to post the metrics data to CloudZero.
Below is the sample aggregate Lambda invocations payload which will be sent to CloudZero by the aggregate_lambda_invocations_by_tenant method.

Figure 10 – Example telemetry stream Lambda records.
Aggregate Capacity Units
The aggregate_dynamodb_capacity_units_by_tenant in the repo takes care of calculating total capacity units (RCUs+WCUs) consumed by pooled Lambda functions. We’ll use metrics generated by CreateProductFunction, UpdateProductFunction, CreateOrderFunction, and UpdateOrderFunction to calculate RCUs, and GetProductsFunction and GetOrdersFunction to calculate WCUs.
The code creates a log group name for each product and order service containing the name of each service’s functions. We execute a separate query for each service using the query_cloudwatch_logs method, which pulls and summarize the total capacity units consumed by each service from for the past configured NUMBER_OF_HOURS environment variable value by tenant, then use the post_telemetry_records method to post the metrics data to CloudZero.
Below is the sample aggregate capacity unit’s payload which will be sent to CloudZero by the aggregate_dynamodb_capacity_units_by_tenant method.
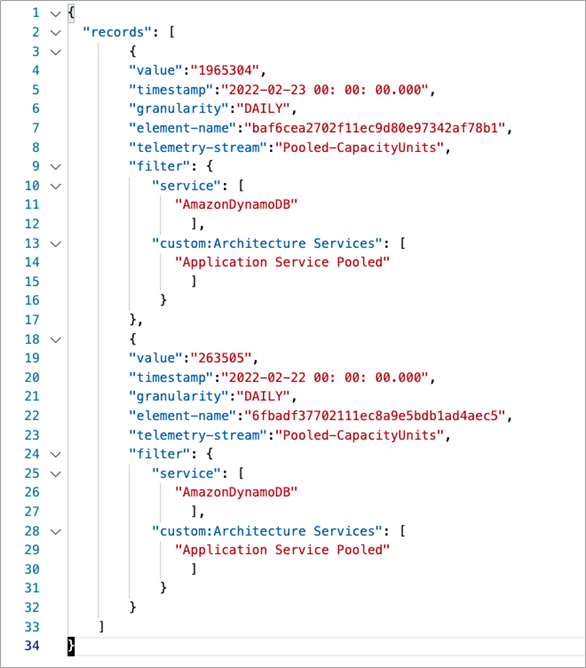
Figure 12 – Example telemetry stream DynamoDB records.
CloudZero Telemetry Integration
Once you gather the metrics data using the above CloudWatch Logs Insights queries, you need to post this data into CloudZero using its post telemetry records API. Please refer to the Post telemetry records documentation for more details.
You can refer to the post_telemetry_records method in the repo for sample implementation.
To capture tenant consumption of pooled resources, we are presenting a minimally invasive approach where we zeroed in on a couple metrics and then captured the metrics data by querying CloudWatch Logs using CloudWatch Logs Insights without making any changes to the SaaS application in the SaaS architecture.
Depending upon your needs, you can update your SaaS application to capture richer metrics and then use the approach of using CloudWatch Logs Insights queries to pull and aggregate that data, sending that data to CloudZero.
To allocate our spend, we first allocated the silo tenant spend using the CloudZero Dimension feature, and used telemetry data to allocate the multi-tenant spend to customers. This leaves shared services and cloud manage spend. CloudZero uses AllocateByRules to allocate this spend either proportionally or evenly across all the customers.

Figure 12 – CloudZero Explorer grouping pooled tenant costs.
In Figure 12, you can now see that the $76.40 of pooled tenant costs have been allocated across our four “Standard” tier tenants. With just these two telemetry streams, we created a representation of tenant cost and usage with minimal effort.
As you advance in your use of CloudZero, you can ingest more telemetry streams to create more granular views of cost and usage data. This approach of starting small enables you to get information about shared cost quickly and over time to get very granular.
Conclusion
In this post, we examined how CloudZero’s Enhanced Unit Cost Analytics can enable tenant cost attribution, relieving SaaS providers from the undifferentiated heavy lifting of building their own custom solution.
We’ve shown how to track costs for dedicated tenant resources with no changes to our existing code with CostFormation, and with just the addition of a log aggregator to allocate the costs of shared resources to the appropriate tenant.
While we focused on the Serverless SaaS Reference Architecture, the same solution can be applied to a variety of architectures like Amazon Elastic Kubernetes Service (Amazon EKS) and could even be used to combine tenant costs across platforms.
.

.
CloudZero – AWS Partner Spotlight
CloudZero is an AWS Partner and cloud cost intelligence platform that puts spend into the context of your business. By aligning engineering and finance around metrics that matter, CloudZero enables better decision-making, improved unit economics, and efficient spending.