AWS Big Data Blog
Real-time bushfire alerting with Complex Event Processing in Apache Flink on Amazon EMR and IoT sensor network
August 30, 2023: Amazon Kinesis Data Analytics has been renamed to Amazon Managed Service for Apache Flink. Read the announcement in the AWS News Blog and learn more.
Bushfires are frequent events in the warmer months of the year when the climate is hot and dry. Countries like Australia and the United States are severely impacted due to the bushfires causing devastating effects to human lives and property. Over the years the prediction of bushfires has been a subject of study in various research projects. Many of these projects use complex machine learning algorithms. These algorithms learn to predict the bushfires from the real-time spread for the fire over a particular geographical region.
In this blog post, we use event processing paradigm provided by Apache Flink’s Complex Event Processing (CEP) to detect potential bushfire patterns from incoming temperature events from IoT sensors in real time, and then send alerts via email. A real-time heat-map visualization of the area under surveillance is also integrated for monitoring purposes.
This post uses the following AWS services:
- Amazon EC2 instance as the IoT simulator
- AWS IoT Core as the IoT message gateway
- Amazon Kinesis Data Streams as the durable message queue
- Amazon EMR with Apache Flink as the streaming data processing engine
- Amazon SNS for alerting
- Amazon OpenSearch Service Sas the alert storage and visualization platform
- AWS CloudFormation for stack creation and deployment from start to finish
Overview of the real-time bushfire prediction alert system
The development and deployment of a large-scale wireless sensor network for bushfire detection and alerting is a complex task. The scenario for this post assumes that the sensors are long-lived battery powered and deployed over a multi-hop wireless mesh network using technologies like LoRaWAN. It also assumes that the placement of the IoT sensors is placed strategically within an area under surveillance, and not under the direct exposure of sunlight. This placement avoids excessive heating, and constantly recording and emitting the temperature readings where they are installed. The sensors can also communicate with each other to send and receive individual temperature readings to perceive the status of their surroundings. Key parameters recorded by the devices include temperature in degree Celsius, time stamp, node id, and infectedBy, as illustrated in Figure 1.

Figure 1. List of sensor events containing measured temperature by the IoT sensor devices over different time points
Once a potential bushfire starts to spread, the IoT sensors placed within its path can detect the subsequent temperature increase. It can then share the news with their neighboring sensors. This phenomenon is similar to spreading an epidemic over a network following a directional path. It is usually referred to as a Susceptible-Infected (SI) epidemic model in network science.
As shown in Figure 2, the parameter ‘infectedBy’ sent by a given node indicates that it has been infected by a neighboring IoT device (that is, the bushfire has been spread through this path) with the ‘node id’ listed as the parameter value. Here, we assume that once a node is infected within the network by one of its neighbors, it isn’t infected again by another node. Therefore, the value of the ‘infectedBy’ parameter remains the same.

Figure 2. High-level overview of an IoT sensor network monitoring temperature of the surrounding geographical area
For the purposes of this scenario, an 11-node IoT sensor network is shown in Figure 2 that exhibits how the bushfire spreads over time. The placement of IoT sensors can be visualized as an undirected graph network where each node is an IoT sensor device. A link between two neighboring nodes denotes the wireless connectivity within a multi-hop wireless ad hoc network. Figure 2 shows the following details:
- At time t1, the nodes are all emitting the temperature data. However, none of them have reported any temperature greater than the bushfire alert threshold, which is set as 50°
- At time t2, node-1 reports a temperature of 50° Celsius, which was over the pre-set threshold. In reality, it could have been a small-scale bushfire that recently triggered in the area under node-1’s surveillance.
- As time moves forward to t3, we see that the fire rapidly spreads to the area monitored by node-2 in the network. Hence, we can now say that node-2 is infected by node-1. This is reflected in the ‘infectedBy’ parameter emitted by the node-2 at which has the value 1 denoting how the fire is spreading over time.
- Next, at time t4, the fire spreads further to node-3, and followed by node-4 and node-5 by time .
This analogy helps us visualize the overall spread of the bushfire over a network of IoT devices. In this blog post, we use the CEP feature from Apache Flink to detect an event pattern where the measured temperature is higher than 50° Celsius and has an infection degree of 4 within 5 wirelessly connected IoT devices. Once this pattern is detected by real-time event stream processing in Amazon EMR, an SNS alert email is sent to the subscribed email address. The email highlights the path through which the fire has spread so far.
Architecture overview
In this section, we build a real-time event processing pipeline from start to finish. This streamlines the temperature measurements emitted by the IoT devices over the infrastructure layer to build predictive alert and visualization systems for potential bushfire monitoring. The high-level architectural diagram in Figure 3 shows the components required to build this system.

Figure 3. High-level block diagram of the real-time bushfire alert and visualization systems
The diagram shows that the IoT sensor events (that is, measured temperature) feed into an IoT Gateway. The gateway has internet connectivity to forward the records to a stream processing system. The gateway is the landing zone for all the IoT events, which ingests the records into a durable streaming storage. The IoT gateway should scale automatically to support over a billion devices without requiring us to manage any infrastructure.
Next, we store the events in the durable storage, as the temperature events are coming from non-reliable sources, like the IoT sensor devices. As a result, the events cannot be replayed in case any of the records are lost. The streaming storage should also support ingress and egress of large number of events. The events are then consumed by a stream processing engine that matches the incoming events to a pattern and later sends out alerts to the subscribers, if necessary. The raw events are also ingested into a visualization system. This system displays the real-time heat map of the temperatures in the area under surveillance by the IoT nodes.
Building a real-time bushfire alert and visualization system in AWS

Figure 4. Architecture of the real-time IoT stream processing pipeline using AWS services
In this section, we depict a component-level architecture for an event processing system using several of the AWS services, as shown in Figure 4. The IoT sensor data is sent to the AWS IoT services, which receives the incoming temperature records. It then acts as a gateway to the streaming pipeline. The AWS IoT Services is equipped with a rules engine. This can be used to configure an action for the incoming events so that they can be forwarded to another AWS service as a destination.
In this case, Amazon Kinesis Data Streams service is chosen as the destination to act as reliable underlying stream storage system with 1 day as retention period. Figure 5 below shows one such rule and action configuration used in this blog article. The events are then consumed by the Apache Flink processing engine running on an Amazon EMR cluster. Apache Flink consumes the records from the Amazon Kinesis Data Streams shards and matches the records against a pre-defined pattern to detect the possibility of a potential bushfire.

Figure 5. AWS IoT rule and action for the incoming temperature events
Use Apache Flink as the stream processing engine
In this blog, we have chosen Apache Flink as the stream processing engine as it provides high throughput with low latency processing of real-time events. More importantly, it supports stream processing and windowing with Event Time semantics for Amazon Kinesis Data Streams. This is an important feature where events arrive out of order and may also be delayed due to unreliable wireless network communication. Another great feature available in Apache Flink is the Complex Event Processing (CEP) library. It allows you to detect patterns within the stream of incoming events over a period of time. Let’s explore these features in more detail and how they can be used in this particular use case.
Characteristics of IoT events, Event-time processing and Watermarks
Most IoT use cases deal with a large number of sensor devices continuously generating high volume of events over time. The events generally have a time stamp in the record, which indicates when it was generated. However, for consumers, the events can arrive out of order or with delays during processing. In a stream processing application, the consumer should be able to deal with out of order and delayed events.
Apache Flink does this by using event time windowing. The window slides, not according to the processing time window, but by the event time. This helps to make alerting decisions based on the event time where it is more relevant. When the processing window is based on event time, we must know when to advance the event time. That tells us when we can close the window and trigger the next processing task. This is done through ‘Watermarks’ in Flink. There are various mechanisms to generate watermarks. We have used the TimeLagWatermarkGenerator, which generates watermarks that are lagging behind the processing time by a certain unit of time. This assumes that some of the records arrive in the Flink consumer after a certain delay. It is also important to mention that we chose Flink as the processing engine. It provides the Flink CEP feature to match the event based on the pattern we provide. This feature is currently not available in Structured Spark Streaming and Amazon Kinesis Data Analytics.
Complex Event Processing Apache Flink
Once the records are fetched from the Amazon Kinesis Data stream into the Apache Flink application running on Amazon EMR cluster, they must be matched against a pattern. The pattern filters records that first reached the threshold temperature of 50° Celsius and are next followed by another event (from another IoT sensor), which has also reached the same threshold temperature and has been infected by the first IoT sensor node corresponding to the first event on the pattern.
For example, among the incoming events, we get an event from the IoT sensor from node-1 where the temperature is greater than 50° Celsius, which is the first event in the CEP pattern. Next, we look for an event, which follows this first event. For example, an event from node-2 that has a temperature that reached the 50° threshold mark, and has its ‘infectedBy’ field set to 1 indicating node-1. If this condition repeats iteratively for the other three nodes like node-3, node-4, and node-5, then a complete pattern of four network degree path (N1 -> N2 -> N3 -> N -> N5) of potential bushfire initiated from node-1 is said to be detected.
In our implementation, we have chosen to send out an alert when the fire spreads to five connected nodes. But in reality, the number of nodes the fire spreads to before we send out an alert must be carefully chosen. A logical diagram of this particular pattern is shown in Figure 6. Finally, in response to this potential bushfire, an alert email is published to SNS and it delivers the email to the service’s subscribers. A sample SNS alert email is shown below in Figure 7.

Figure 6. The logical pattern diagram for predicting the bushfire

Figure 7. A sample Amazon SNS email alert to notify a potential bushfire and its traversing path
Real-time visualisation of the potential bushfire spread over time
All the incoming IoT event records (unfiltered and raw events got from the Amazon Kinesis Data Stream) are pushed into an Amazon OpenSearch Service cluster for durable storage and visualization on the Kibana web UI. (For more information about Kibana, see What Is Kibana.) A real-time heat-map visualization and dashboard is created to continuously monitor the progress of the bushfire as shown in Figure 8. As you can see from Figure 8, the bushfire is spreading from node-1 to node-2 to node-3, and then to node-4 and node-5. This visualization can be further enhanced by recording the geographical location of the IoT sensor nodes. Then, plotting the heat-map over the geographical area under surveillance.
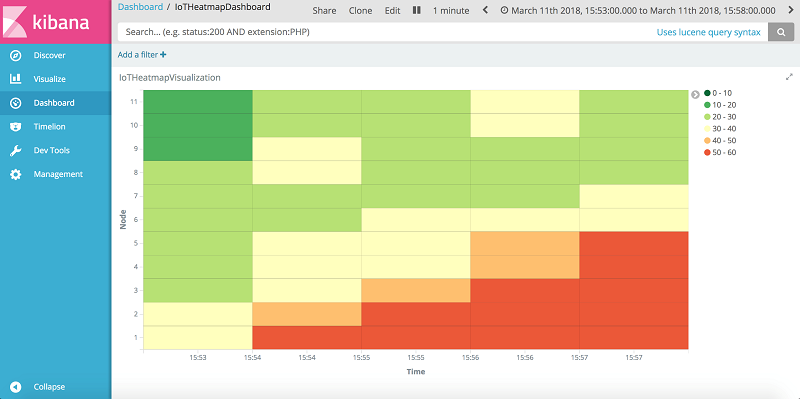
Figure 8. A sample bushfire heat-map visualisation from Amazon OpenSearch Services
Setup and source code
The URL below explains in detail, the steps to set up all the necessary AWS components and run the IoT simulator and Apache Flink CEP. Here, we provide an AWS CloudFormation template. It creates the architecture from start to finish, shown in Figure 4, by setting up the IoT simulator in an EC2 instance with all other respective components, and then automatically runs the stack. Once the stack creation is completed, users can visit the Kibana web UI to observe the real-time bushfire dashboard. They can also receive an SNS alert email for potential bushfires when they confirm their email subscription for it.
To launch the AWS CloudFormation stack, click on the following Launch Stack button to open the AWS CloudFormation console.

Specify the Amazon S3 URL for the template, and then proceed to the next step where you specify the details explained in the next section. After you provide all the parameters, you can proceed and then create the stack. The parameters that you use are as follows:
1. SNS subscription email: This should be a valid email address for the fire alert notification to be sent. Once the CloudFormation stack creation initiates, you get an email on your provided email account for confirming the subscription. Choose the Confirm subscription button to receive the SNS notification.
Note: You may safely delete the SNS subscription from the Amazon SNS console upon completion of the end-to-end observation.
2. Public subnet ID for EMR cluster: Choose a public subnet from the drop-down menu. This is the subnet where the EMR cluster is created. The EMR cluster requires access to the internet to access the Kinesis stream and the Elasticsearch domain. Therefore, a public subnet with the option auto-assign public IPv4 address enabled within a VPC where the enableDnsHostnames and enableDnsSupport options are set to true.
3. S3 path location for EMR cluster logs: The S3 bucket where EMR puts the cluster logs.

Figure 9. Amazon CloudFormation console to create the AWS resource stack.
4. Public subnet ID for EC2 instance: The subnet where the EC2 instance is created to run the IoT simulator. Once the CloudFormation stack comes up, the IoT simulator automatically runs to ingest the IoT events to the AWS IoT gateway. The choice of this subnet follows the same guidelines set out for the subnet chosen for the EMR cluster shown in Figure 9.
5. Security group ID for EC2 instance: This is the security group attached to the EC2 instance running the IoT simulator. You can optionally add a new rule in this security group for SSH port 22. This allows access to the IoT simulator running in this EC2 instance from your workstation, and use the same public IP address for accessing Kibana web UI described later in this post.
6. Key pair ID for EC2 instance: The key pair to be associated with the EC2 instance and the EMR cluster. It allows you to log in to the instances for further exploration.

Figure 10. Amazon CloudFormation console to create the AWS resource stack.
7. Domain name for Amazon OpenSearch Service domain: The Elasticsearch domain name to be created by the CloudFormation template.
8. Public IP address to access Kibana from local machine: The IP address of the local machine from where you want to access Kibana dashboard for visualization. For simplicity, you can provide the public IP address of the workstation from where you are running the CloudFormation stack, this IP address opens up for access on the Amazon OpenSearch Service domain for displaying the real-time Kibana dashboard. You also must access the Kibana URL from this IP address only. If your IP address changes, then modify the policy of Amazon OpenSearch Service cluster with new IP address. For more information, see IP-based Policies in the Amazon OpenSearch Service Developer Guide.
Once the stack creation is completed, the output section of the CloudFormation stack lists the web URLs to access the necessary resources in this architecture. Use the Kibana web URL and create an index pattern under the Management section with the name “weather-sensor-data,” and then choose the dashboard to see the visualization of the real-time spread of the bushfire covered by the IoT network.

Figure 11. Amazon OpenSearch Service domain Kibana Web UI to create the index pattern.
The source codes and an elaborate README are provided in GitHub for the interested users who want to explore the implementation of this architecture in further detail.
https://github.com/aws-samples/realtime-bushfire-alert-with-apache-flink-cep
Troubleshooting Common Issues
1. Kibana Web UI is not accessible
If you see the Message “User: anonymous is not authorized to perform: es:ESHttpGet” while trying to access the Kibana web UI, then this means that the public IP address that was specified during the CloudFormation stack creation time either is not correct or might have been changed. You can confirm the public IP address again from http://checkip.amazonaws.com. Then go to the AWS Management Console for Amazon OpenSearch Service and modify the security access policy, as shown in the following example, to change the IP address only.

Figure 12. Modifying public IP address in the Amazon OpenSearch Service domain access policy.
2. No records ingested into Amazon OpenSearch Service
This issue can occur if records fail to be ingested from the EMR cluster. To troubleshoot this, go to the AWS Management Console for IAM and search for the IAM role named “EMR_EC2_Default_Role” and make sure it has the default AWS managed policy “AmazonElasticMapReduceforEC2Role” attached to it.

Figure 13. Verifying the default AWS Managed policy attached to “EMR_EC2_Default_Role” in IAM.
3. No SNS alert E-mail notification
If you do not receive an SNS email alert about the potential bushfire after several minutes of observing the complete visualization, then check whether you had confirmed the SNS subscription at the beginning while the CloudFormation stack was creating by checking your inbox. Additionally, make sure that you have provided a correct email address and re-create the stack again from the scratch.
Summary
In this blog post, we discussed how to build a real-time IoT stream processing, visualization, and alerting pipeline using various AWS services. We took advantage of the Complex Event Processing feature provided by Apache Flink to detect patterns within a network from the incoming events. The GitHub repository contains the resources that are required to run through the example provided in this post. Includes further information that helps you to get started quickly. We encourage you to explore the IoT simulator code and test with different network configuration to ingest more records with different patterns and visualize the bushfire spread path pattern on the Kibana dashboard.
Additional Reading
If you found this post useful, be sure to check out Build a Real-time Stream Processing Pipeline with Apache Flink on AWS, Derive Insights from IoT in Minutes using AWS IoT, Amazon Kinesis Firehose, Amazon Athena, and Amazon QuickSight, and Integrating IoT Events into Your Analytic Platform.
About the Authors
 Santoshkumar Kulkarni is a Big Data Engineer with AWS. He works closely with AWS customers to provide them architectural and engineering assistance and guidance. He is passionate about distributed technologies and streaming systems. In his free time, he enjoys spending time with his family on the beautiful beaches of Sydney.
 Joarder Kamal, PhD is a Big Data Engineer with AWS. He likes building and automating systems that combines distributed communications, real-time data, and collective intelligence. During his spare time, he loves reading travel diaries, doing pencil sketches, and touring across Australia with his wife.