AWS Database Blog
Managing IoT and Time Series Data with Amazon ElastiCache for Redis
Michael Labib, Specialist Solutions Architect, In-Memory NoSQL
You can use a number of AWS services to address the challenges associated with ingesting and analyzing time series data. In this blog post, I focus on IoT sensor data, but the principles and techniques described here can be applied to other data sources.
What Is Time Series Data?
A time series is simply a series of observations captured over a period of time. These observations can be stock quotes, application logs, clickstream data, Twitter feeds, device sensor data, or any other time-stamped data source.
When collected over a period of time, the data points tell a story about the behaviors, patterns, and trends occurring in the observed systems; this data can be used to improve an experience or process. The more data points captured, the richer the information gathered from that data. Accelerating the data analysis and ingestion process allows you to react more quickly to the information.
For example, let’s say you are gathering information from social networks in order to data mine what people are discussing. The sooner you’re able to process that streaming data, the sooner you’ll be able to target potential customers with ads or campaigns and improve your product’s position in the market. The same is true with log data. The sooner you’re able to determine the health of your applications, the sooner you can proactively fix faults in your systems and prevent disruption to your customers.
Storing those data points over time allows you to observe historical trends so you can predict and plan for future events.
In this post, we’ll design an IoT solution that captures sensor information and persists it in Amazon ElastiCache for Redis.
Use Case Requirements
Our use case is to gather sensor information from a consumer thermostat in order to understand the environments in which our customers will use them. We also want to identify, through information gathered by the sensors, any potential issues related to extreme temperature conditions.
We’ll first build a proof of concept to process and analyze the sensor information. Then, we’ll change our architecture to store historical information for additional reporting.
These are the requirements for our solution:
- Velocity: Our solution needs to be able to support hundreds of thousands of requests per second. We’ll be capturing device sensor data that includes information like temperature, humidity, device IP addresses, and other metadata.
- Volume: Although we are primarily concerned with the most active information, in the future we’ll want to store historical data. For this reason, our solution should be extensible.
- Variety: We want a flexible data model so our solution can adapt to changing requirements.
- Order: For accurate reporting and trend analysis, the solution must be able to maintain the order of the data that is ingested.
- Cost and agility: We want to go to market quickly while being cost-conscious. We don’t want to worry about patching, racking and stacking, and so on.
- High availability and scaling: The solution must be highly available and able to scale to support additional devices and load. We also want to be able to apply real-time processing of data for analytics.
- Security: We need to be able maintain end-to-end security to protect the data we are capturing.
Architecture
Let’s use AWS services to build an architecture:

These services offer layered security, ease of use, scalability, high availability, and zero administration.
- Data ingestion: AWS IoT automatically scales to support billions of devices and trillions of messages. It also allows you to easily process and route messages to other AWS services.
- Data processing: AWS Lambda automatically scales your application by running your function in response to a trigger. Just write code and upload to AWS Lambda. It’s completely serverless. When integrated with AWS IoT, it can also act as a continuous event data processor.
- Data storage: Amazon ElastiCache for Redis is a lightning-fast, in-memory data store that supports extremely high requests rates and data ingestion. It provides flexible scaling and advanced data structures that can speed development and reduce computational complexity. There is also no cost for requests to the service or for amounts of throughput. You pay only for the instances you provision, which makes it ideal to query against.
Data Model
This is the data model we’ll be using to capture active sensor data.

A Redis Sorted Set is used to capture and maintain the order of the events (in this case, sensor readings). The key for this data structure is SensorData. This set will maintain the order by using the timestamp value, which acts as the score. The date of the event is converted to a LONG value, which is sorted in reverse order to display the events starting from the newest. We are also storing the deviceId as the value for this set.
Alternatively, we could use a unique ID such as an event ID or request ID to capture the data for a historical view. (This true for the hash key, too.)
A Redis Hash is used to capture the temperature sensor data. An individual Hash is created for each deviceId, which is also the key for the Hash. The deviceId value is stored in the SensorData sorted set. When used together, the sorted set and deviceId provide the time the event occurred and the data associated with the device.
Redis Strings allow you to increment the interpreted integer of a string value for a given key. Our consumer thermostats will be used in various climates, so we’ll increment each individual counter when the temperature reading falls within a given range. These counters will provide analytics in the case we are interested in totals.
Now let’s build our solution!
Step 1: Create a Redis cluster and Redis client on EC2
For simplicity, we have created an AWS CloudFormation template for you to use.
Download the sensor-demo-redis.json template. Open the AWS CloudFormation console and run the template.
The sensor-demo-redis.json template will create a Redis cluster and an EC2 instance. The redis-cli and the Node.js application (temp-sensor.js) have already been deployed to the instance. The temp-sensor.js application will emulate a device sensor, which will be consumed by AWS IoT. The redis-cli will be used to query the Redis cluster. For your convenience, Node.js is also installed on the EC2 instance to run the sensor emulator application.
Step 2: Configure AWS IoT

Now we are ready to create a thing and connect our IoT device (which is an emulator application) to the AWS IoT device gateway. The device gateway allows secure, low latency, bi-directional communication between connected devices and AWS. AWS IoT also includes a rules engine, which we will use to enable continuous processing of data sent by our device. We will configure the AWS IoT rules engine to trigger an AWS Lambda function in a later step.
1. Sign in to the AWS Management Console and open the AWS IoT console at https://aws.amazon.com/iot.
![]()
2. Create a thing to represent your device. In Name, type SensorHub, and then choose Create.

3. Choose your thing (SensorHub), and then choose Connect a device.

4. For the device type, choose NodeJS, and then choose Generate certificate and policy.

5. Download the keys and certificate, and then choose Confirm & start connecting.

6. Copy the connection information. You will need it for the next step.
Step 3: Run the Node.js emulation code
The sensor emulator code is already deployed to your EC2 instance and located in /home/ec2-user. The code is available here for your review.
The application includes the following structure:
- node_modules are the required temp_sensor.js Node.js dependencies.
- utils/iot-properties.file is the file where you will place the parameters required by AWS IoT. The utils directory is also where you will place the certificates provided by AWS IoT.
- temp-sensor.js is the Node.js application that will emulate sensor data.
Let’s take a look at the code.
First, we will retrieve the properties stored in the iot-properties.file that we’ll be using to securely authenticate and connect to AWS IoT.
var properties = PropertiesReader ('./utils/iot-properties.file');

const device = awsIot.device ({
"host": properties.get('host'),
"port": properties.get('port'),
"clientId": properties.get('clientId'),
"thingName": properties.get('thingName'),
"caPath": properties.get('caPath'),
"certPath": properties.get('certPath'),
"keyPath": properties.get('keyPath'),
"region": properties.get('region')
});
Note: Be sure the property names in the code match exactly those in the iot-properties.file and place your AWS IoT keys in the utils directory.
In the following section of the code, we generate random data and publish it to the AWS IoT topic named ‘temp_readings’.
device.on('connect', function() {

console.log('\n===========Emulating Sensor Data=================\n');

setInterval(function () {

for (i=10; i>=0; i--) {
//Generate Random Sensor Data
var temperature = Math.floor((Math.random() * 110) + 1);
var deviceId = Math.floor((Math.random() * 5000) + 1);
var IP = Faker.Internet.ip();
var humidity = Math.floor((Math.random() * 100) + 1);

console.log('deviceId= ' + deviceId + ' temperature= ' + temperature + ' humidity=' + humidity + ' IP=' + IP );
device.publish('temp_readings', JSON.stringify (

{ "deviceId" : deviceId,
"temperature" : temperature,
"deviceIP" : IP,
"humidity" : humidity
}
));
}

}, 4000);

});
1. Connect to your EC2 instance by using SSH. Use the user name ec2-user and the SSH key that was created and downloaded earlier.
To find the hostname of the EC2 instance, look on the Outputs tab of the CloudFormation stack or go to the EC2 dashboard.
2. Place the AWS IoT certificate and private key you downloaded earlier in the./utils directory, and then update the ./utils/iot-properties.file with your connection information and the names of the key and certificate.
3. Run the Node.js application with node temp-sensor.js.
4. Go to the AWS IoT console.
5. Choose MQTT Client and create a test client to test whether temperature readings are being captured. Choose Connect.

6. Subscribe to the temp_readings topic, which is where the emulation code is publishing temperature readings. Choose Subscribe.
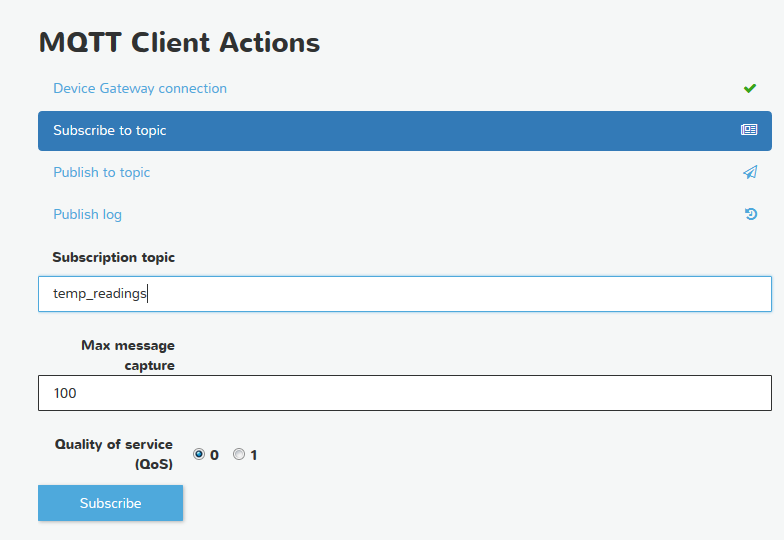
7. If everything was set up correctly, sensor data should start being published.
Task 4: Deploy a Lambda function and AWS IoT rule
This task will create the AWS Lambda function that will be used by the AWS IoT rules engine to persist the temperature readings into Amazon ElastiCache for Redis. The AWS IoT rule will trigger the execution of the Lambda function. The code will also create the Redis data model.
1. Download and unzip the PersistSensorData.zip package.
The application includes the following structure:
- node_modules contains the required PersistSensorData.js Node.js dependencies.
- PersistSensorData.js is the node application that will process the sensor events and persist the data into Amazon ElastiCache for Redis.
Let’s take a look at the code.
First, we will log the details of the event, making a connection to the Redis cluster using the node_redis client. We’ll use the Redis multi command for transaction support.
var redis = require("redis");

exports.handler = function(event, context) {

console.log("Request received:\n", JSON.stringify(event));
console.log("Context received:\n", JSON.stringify(context));

console.log(" deviceId:" + event.deviceId +
" temperature:" + event.temperature +
" deviceIP:" + event.deviceIP +
" humidity:" + event.humidity );

client = redis.createClient("redis://your-redis-endpoint:6379");
multi = client.multi();
2. Update the Redis connection endpoint in the Lambda function with the Redis cluster endpoint inside the PersistSensorData.js function.
To find the Redis cluster endpoint, open the Amazon ElastiCache console. In the Nodes column, click the 1 node link.

Your Redis cluster endpoint is the endpoint value.

Now update the Redis endpoint in the Lambda function with this endpoint. Leave the port value in there.
For example, this: redis.createClient("redis://your-redis-endpoint:6379");
becomes this:
redis.createClient("redis:// sen-re-a4mbqq65e605.rhpopm.0001.usw2.cache.amazonaws.com:6379");
In the following section of the code, we increment the Redis counters to group similar temperature readings. Those groupings will appear on a web dashboard.
if (event.temperature > 85 ) {

multi.incr("climate:hot");
climate = "hot";
multi.publish("Warnings",
" deviceID:" + event.deviceId +
" temperature:" + event.temperature + "" +
" awsRequestId:" + context.awsRequestId + " timestamp:" + date );

} else if (event.temperature > 75 ) {

multi.incr("climate:warm");
climate = "warm";

} else if (event.temperature > 65 ) {

multi.incr("climate:cool");
climate = "cool";

} else {

multi.incr("climate:cold");
climate = "cold";
}
We also update our sorted set SensorData with the deviceId value and sort it by the date (stored as a LONG), which acts as our score.
multi.zadd("SensorData", date, event.deviceId);
We then store the sensor data in a Redis Hash for each deviceId. In addition to the data we captured from the sensor emulator code, we’ve added properties like awsRequestId, timestamp, and climate. Finally, we execute the commands within the transaction.
multi.hmset(event.deviceId, "temperature", event.temperature,
"deviceIP", event.deviceIP,
"humidity", event.humidity,
"climate", climate,
"timestamp", date,
"awsRequestId", context.awsRequestId);

multi.exec(function (err, replies) {

if (err) {

console.log('error updating event: ' + err);
context.fail('error updating event: ' + err);

} else {

console.log('updated event ' + replies);
context.succeed(replies);
client.quit();

}
});
}
3. After you have updated the Redis connection endpoint in the Lambda function, zip the function and node_modules directory. Name the zipped artifact PersistSensorData.zip.
4. Open the AWS Lambda console.
![]()
5. When prompted to select a blueprint, choose Skip.
6. When prompted to configure triggers, choose Next. We will complete the configuration of the trigger in the AWS IoT console.
7. Name your function PersistSensorData and choose Upload.

8. For Handler, type PersistSensorData.handler. For Role, choose Create a custom role.

9. For IAM Role, choose a basic role that includes VPC execution, and then choose Allow.
Note: If you already have a role, you might need to open the IAM console and add the AWSLambdaVPCAccessExecutionRole managed policy to it.

10. Specify the VPC, subnets, and security groups this function should use. For VPC, we can use the default VPC and any of the subnets in it. For Security Group, choose the group created by the CloudFormation stack. It will start with SensorDemo-EC2InstanceSecurityGroup unless you gave your stack a different name. Choose Next.

11. Review the information on the page, and then choose Create Function.

Close this tab. Now that the Lambda function has been created, we can finish the configuration of our AWS IoT rule.
12. Open the AWS IoT console, and confirm the correct region is selected.
![]()
13. Choose Create a resource.
![]()
14. Choose Create a rule.

15. For Name, type PersistToRedis.
16. For Attribute, type * (asterisk).
17. For Topic filter, type temp_readings.
18. Leave Condition blank.
19. For Choose an action, choose Lambda.

20. Choose Add action.

21. Choose Create.
![]()
Task 4: Analyze sensor data by using redis-cli
1. Connect to your EC2 instance using SSH. Use the user name ec2-user and the the SSH key you created or downloaded earlier.
To find the hostname of the EC2 instance, look on the Outputs tab of the CloudFormation stack or navigate to the EC2 console. You should see the instance running in the console.
2. Navigate to the following directory and use the redis-cli to connect to Redis.
/usr/local/bin
3. Connect to your Redis cluster (for example,
redis-cli -h sen-re-a4mbqq65e605.rhpopm.0001.usw2.cache.amazonaws.com -p 6379).
4. The following are some commands you can use to analyze the sensor data.
Note: Make sure the node application, temp_sensor.js, is running. You might want to have two SSH sessions open.
What are the last n events?
zrevrangebyscore SensorData +inf -inf WITHSCORES LIMIT 0 5
Which events occurred during this time range?
zrangebyscore SensorData (1410000000000 14400000000000
Which devices match a particular pattern?
zscan SensorData 0 MATCH 2* COUNT 100
What is the temperature for a specific device?
hget 2942 temperature (This assumes there is a deviceId with a value of 2942.)
What are the totals for each climate type?
get climate:warm

 get climate:cool

 get climate:cold

 get climate:hot
Show me all of the data for a specific device.
hgetall 2942
For a complete list of Redis commands, see http://redis.io/commands.
Task 5: Deploy the sensor dashboard application

Now we’ll deploy a web dashboard that will display the ingested sensor data so we can interact with it. The dashboard information includes what’s contained in the Sorted Set, Hash, and Counters. It also includes notifications from the Redis PUB/SUB channel.
The purpose of this dashboard is to illustrate how easily data can be retrieved from Redis. The .war application is available for download. The front end of the application has AJAX code that continuously queries the data in Redis through our Java service. The Java Redis client we’re using is Jedis.
We’ll use Amazon Elastic Beanstalk to deploy the dashboard.
Sorted set (SensorData)
We are using a set collection we named events and hydrating it with data from our SensorData data structure. For our web dashboard, we simply converted the data into a JSON object that is used in the dashboard UI. We’re using the ZREVRANGEBYSCORE command to return the reverse order of the values based on our timestamp (the score). This will give us our most recent events first. We are also retrieving the top 24 values each time we execute this command to display in the UI.
Gson gson = new Gson();
JsonObject sensors = new JsonObject();

Set events = jedis.zrevrangeByScoreWithScores("SensorData", Double.MAX_VALUE, Double.MIN_VALUE, 0, 24);

for (Tuple event : events)
sensors.add(event.getElement(), gson.toJsonTree(event.getScore()));
Hash (deviceId)
Each time we click a deviceId on our web dashboard, we query the Redis Hash for details of that deviceId. We simply create a Java map and hydrate it with results from the HGETALL Redis command, which returns all of the properties in a Redis Hash for a particular key (our deviceId). We also convert that Java map to a JSON object so it can be easily consumed by the UI.
Gson gson = new Gson();
Map<String, String> eventData = jedis.hgetAll(deviceId);
String json = gson.toJson(eventData);
Counters
For the chart on the dashboard that will show the temperature readings (the counts of the different climates), we simply make a GET request on each Redis key we want included. The counts are in a JSON object so they can be easily consumed by the UI.
Gson gson = new Gson();

JsonObject counters = new JsonObject();
counters.add("chartCold",gson.toJsonTree(jedis.get("climate:cold")));
counters.add("chartWarm",gson.toJsonTree(jedis.get("climate:warm")));
counters.add("chartHot",gson.toJsonTree(jedis.get("climate:hot")));
Pub/Sub
The PersistSensorData Lambda function processes the temperature readings and publishes a notification to the channel “Warnings.” The web dashboard is subscribed to this channel.
jedis.subscribe(new JedisPubSub() {

public void onMessage(String channel, String message) {

writer.println(message + "");
writer.flush();
asyncContext.complete();
}

public void onSubscribe(String channel, int subscribedChannels) {
}

}, "Warnings");
Let’s deploy this code!
1. Open the AWS Elastic Beanstalk console.
![]()
2. Choose Create New Application.
![]()
3. Provide a name and description for the application, and then choose Next.

4. Choose Create web server.

5. For Predefined configuration, choose Tomcat. Because this is just a demo, for Environment type, choose Single instance. Choose Next.

6. Upload the sample dashboard application, and then choose Next.

7. For Environment name, type a name for your application, and then choose Next.

8. Select the Create this environment inside a VPC box, and then choose Next.

9. On Configuration Details, , choose an instance type, and then select the EC2 key pair you created. You can also provide your email address to get notifications about changes to your environment. Choose Next.

10. Add tags to your environment, and then choose Next.

11. Add your VPC configuration information, including the subnets and security group, and then choose Next. The subnets and security group should match the values you used when you configured the Lambda function.
Note: Be sure to select the same subnet in which your ElastiCache cluster was created.

12. Choose the appropriate permissions for Elastic Beanstalk, and then choose Next.

13. Review the configuration, and then launch the environment.
14. After the application has been launched, choose Configuration.

15. Next, edit the software configuration.

16. Scroll to the bottom of the page, add the following environment properties, and then choose Apply.
For Property Name, type REDIS_CONNECTION_STRING.
For Property Value, add your Redis endpoint.

Your Elastic Beanstalk environment will be updated.
17. Navigate to your Elastic Beanstalk environment. You should see sensor data being populated to the dashboard.

If you don’t, be sure to run your Node.js application and verify:
- The Elastic Beanstalk application security group has access to write to the ElastiCache for Redis cluster.
- The Lambda trigger is configured. Open the AWS Lambda console and choose the Triggers tab.

Conclusion
Amazon ElastiCache for Redis is an excellent storage solution for time series data. It supports extremely high request rates, advanced data structures, high availability, and persistence. And because it’s fully managed, it requires zero administration.
AWS IoT and AWS Lambda are also fully managed services that scale automatically to ingest and process device data.
To help you get started, a free tier for ElastiCache for Redis is available for your use. Use it to kick off your projects and please let us know about your results!