AWS DevOps & Developer Productivity Blog
A new Spark plugin for CPU and memory profiling
Introduction
Have you ever wondered if there are low-hanging optimization opportunities to improve the performance of a Spark app? Profiling can help you gain visibility regarding the runtime characteristics of the Spark app to identify its bottlenecks and inefficiencies. We’re excited to announce the release of a new Spark plugin that enables profiling for JVM based Spark apps via Amazon CodeGuru. The plugin is open sourced on GitHub and published to Maven.
Walkthrough
This post shows how you can onboard this plugin with two steps in under 10 minutes.
- Step 1: Create a profiling group in Amazon CodeGuru Profiler and grant permission to your Amazon EMR on EC2 role, so that profiler agents can emit metrics to CodeGuru. Detailed instructions can be found here.
- Step 2: Reference codeguru-profiler-for-spark when submitting your Spark job, along with PROFILING_CONTEXT and ENABLE_AMAZON_PROFILER defined.
Prerequisites
Your app is built against Spark 3 and run on Amazon EMR release 6.x or newer. It doesn’t matter if you’re using Amazon EMR on Amazon Elastic Compute Cloud (Amazon EC2) or on Amazon Elastic Kubernetes Service (Amazon EKS).
Illustrative Example
For the purposes of illustration, consider the following example where profiling results are collected by the plugin and emitted to the “CodeGuru-Spark-Demo” profiling group.
spark-submit \
--master yarn \
--deploy-mode cluster \
--class <main-class-in-your-spark-app> \
--packages software.amazon.profiler:codeguru-profiler-for-spark:1.0 \
--conf spark.plugins=software.amazon.profiler.AmazonProfilerPlugin \
--conf spark.executorEnv.PROFILING_CONTEXT="{\\\"profilingGroupName\\\":\\\"CodeGuru-Spark-Demo\\\"}" \
--conf spark.executorEnv.ENABLE_AMAZON_PROFILER=true \
--conf spark.dynamicAllocation.enabled=false \
<your-spark-app-jar>
An alternative way to specify PROFILING_CONTEXT and ENABLE_AMAZON_PROFILER is under the yarn-env.export classification for instance groups in the Amazon EMR web console. Note that PROFILING_CONTEXT, if configured in the web console, must escape all of the commas on top of what’s for the above spark-submit command.
[
  {
    "classification": "yarn-env",
    "properties": {},
    "configurations": [
      {
        "classification": "export",
        "properties": {
          "ENABLE_AMAZON_PROFILER": "true",
          "PROFILING_CONTEXT": "{\\\"profilingGroupName\\\":\\\"CodeGuru-Spark-Demo\\\"\\,\\\"driverEnabled\\\":\\\"true\\\"}"
        },
        "configurations": []
      }
    ]
  }
]
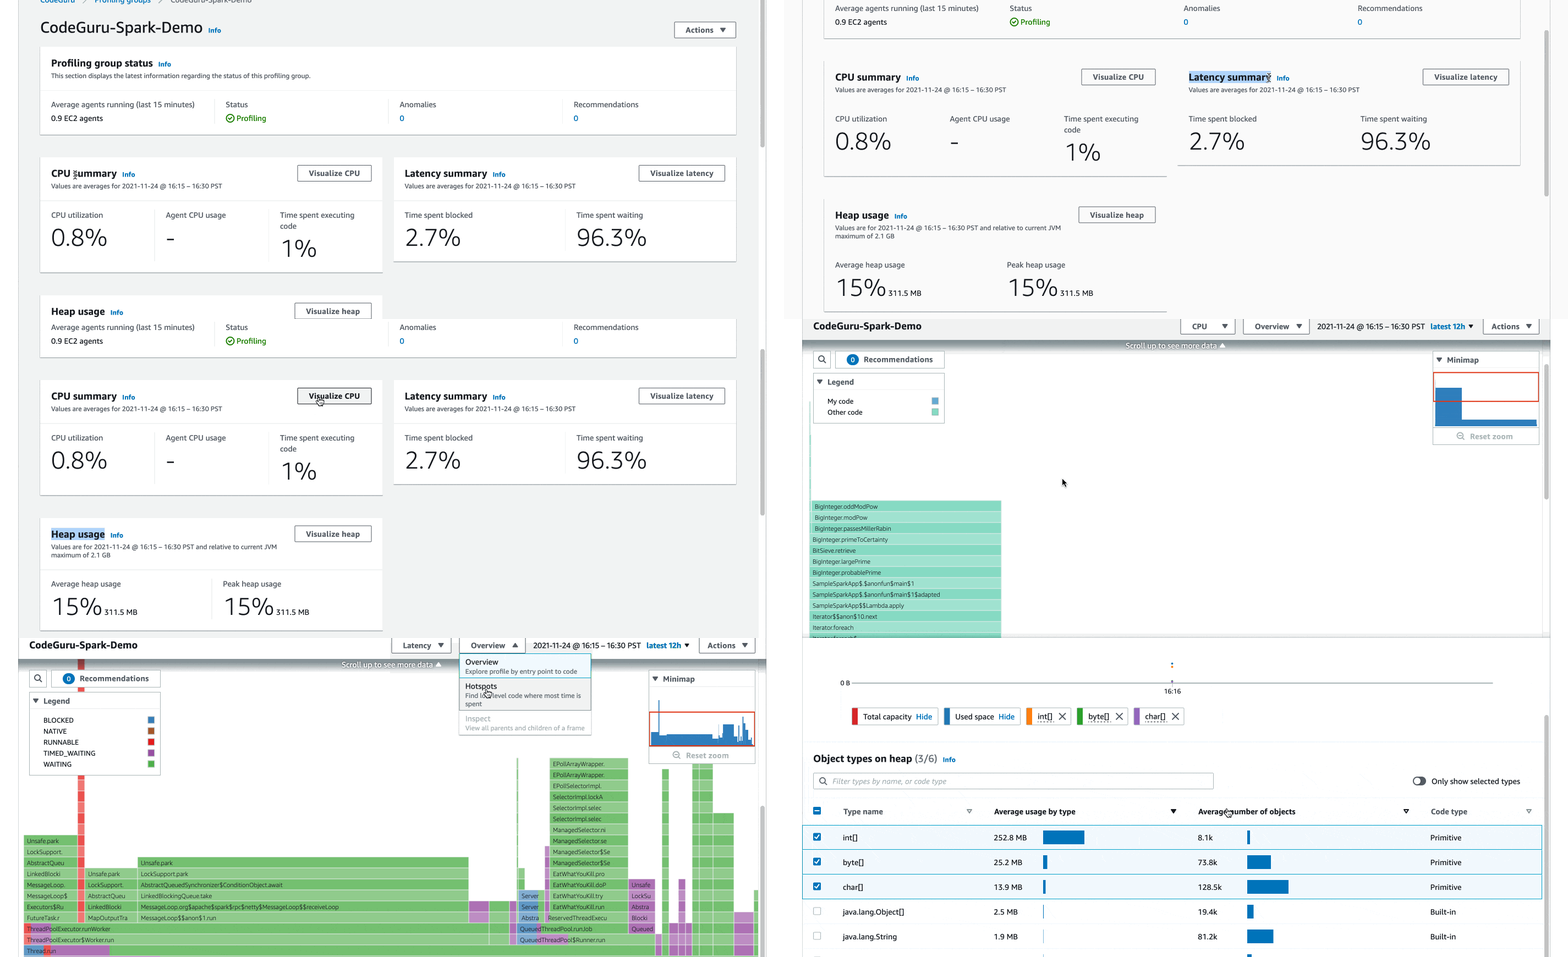
Once the job above is launched on Amazon EMR, profiling results should show up in your CodeGuru web console in about 10 minutes, similar to the following screenshot. Internally, it has helped us identify issues, such as thread contentions (revealed by the BLOCKED state in the latency flame graph), and unnecessarily create AWS Java clients (revealed by the CPU Hotspots view).

Troubleshooting
To help with troubleshooting, use a sample Spark app provided in the plugin to check if everything is set up correctly. Note that the profilingGroupName value specified in PROFILING_CONTEXT should match what’s created in CodeGuru.
spark-submit \
--master yarn \
--deploy-mode cluster \
--class software.amazon.profiler.SampleSparkApp \
--packages software.amazon.profiler:codeguru-profiler-for-spark:1.0 \
--conf spark.plugins=software.amazon.profiler.AmazonProfilerPlugin \
--conf spark.executorEnv.PROFILING_CONTEXT="{\\\"profilingGroupName\\\":\\\"CodeGuru-Spark-Demo\\\"}" \
--conf spark.executorEnv.ENABLE_AMAZON_PROFILER=true \
--conf spark.yarn.appMasterEnv.PROFILING_CONTEXT="{\\\"profilingGroupName\\\":\\\"CodeGuru-Spark-Demo\\\",\\\"driverEnabled\\\":\\\"true\\\"}" \
--conf spark.yarn.appMasterEnv.ENABLE_AMAZON_PROFILER=true \
--conf spark.dynamicAllocation.enabled=false \
/usr/lib/hadoop-yarn/hadoop-yarn-server-tests.jar
Running the command above from the master node of your EMR cluster should produce logs similar to the following:
21/11/21 21:27:21 INFO Profiler: Starting the profiler : ProfilerParameters{profilingGroupName='CodeGuru-Spark-Demo', threadSupport=BasicThreadSupport (default), excludedThreads=[Signal Dispatcher, Attach Listener], shouldProfile=true, integrationMode='', memoryUsageLimit=104857600, heapSummaryEnabled=true, stackDepthLimit=1000, samplingInterval=PT1S, reportingInterval=PT5M, addProfilerOverheadAsSamples=true, minimumTimeForReporting=PT1M, dontReportIfSampledLessThanTimes=1}
21/11/21 21:27:21 INFO ProfilingCommandExecutor: Profiling scheduled, sampling rate is PT1S
...
21/11/21 21:27:23 INFO ProfilingCommand: New agent configuration received : AgentConfiguration(AgentParameters={MaxStackDepth=1000, MinimumTimeForReportingInMilliseconds=60000, SamplingIntervalInMilliseconds=1000, MemoryUsageLimitPercent=10, ReportingIntervalInMilliseconds=300000}, PeriodInSeconds=300, ShouldProfile=true)
21/11/21 21:32:23 INFO ProfilingCommand: Attempting to report profile data: start=2021-11-21T21:27:23.227Z end=2021-11-21T21:32:22.765Z force=false memoryRefresh=false numberOfTimesSampled=300
21/11/21 21:32:23 INFO javaClass: [HeapSummary] Processed 20 events.
21/11/21 21:32:24 INFO ProfilingCommand: Successfully reported profile
Note that the CodeGuru Profiler agent uses a reporting interval of five minutes. Therefore, any executor process shorter than five minutes won’t be reflected by the profiling result. If the right profiling group is not specified, or it’s associated with a wrong EC2 role in CodeGuru, then the log will show a message similar to “CodeGuruProfilerSDKClient: Exception while calling agent orchestration” along with a stack trace including a 403 status code. To rule out any network issues (e.g., your EMR job running in a VPC without an outbound gateway or a misconfigured outbound security group), then you can remote into an EMR host and ping the CodeGuru endpoint in your Region (e.g., ping codeguru-profiler.us-east-1.amazonaws.com).
Cleaning up
To avoid incurring future charges, you can delete the profiling group configured in CodeGuru and/or set the ENABLE_AMAZON_PROFILER environment variable to false.
Conclusion
In this post, we describe how to onboard this plugin with two steps. Consider to give it a try for your Spark app? You can find the Maven artifacts here. If you have feature requests, bug reports, feedback of any kind, or would like to contribute, please head over to the GitHub repository.
Author: