IBM & Red Hat on AWS
Security auditing in ROSA using AWS observability services
As customers increasingly onboard and manage container-based workloads within Red Hat OpenShift Service on AWS (ROSA) clusters, it has become critical to rapidly improve application and infrastructure security posture across teams and services.
ROSA allows platform owners to create turnkey application platforms in minutes. Developers then use it to deploy a range of workloads, including custom-built applications, AI/ML solutions such as Red Hat OpenShift AI, Virtual Machines with OpenShift Virtualization, and other open-source and ISV workloads. An effective way to audit these various workloads and their associated system and user activities, is to leverage native AWS observability services combined with ROSA monitoring capabilities.
In this post, we will introduce key auditing concepts and demonstrate complementary approaches you can take to monitor your ROSA environments. The four scenarios described below and in figure 1 will help you detect unauthorized access, track system changes and monitor the main security aspects of ROSA:
- Scenario 1 – Use AWS CloudTrail to audit Site Reliability Engineer (SRE) and application access to AWS resources.
- Scenario 2 – Send ROSA audit logs to Amazon CloudWatch and detect suspicious activities with Log Insights.
- Scenario 3 – Create CloudWatch alarms to monitor SRE access to ROSA.
- Scenario 4 – Visualize and quickly audit multiple ROSA clusters with dashboards in Amazon Managed Grafana.
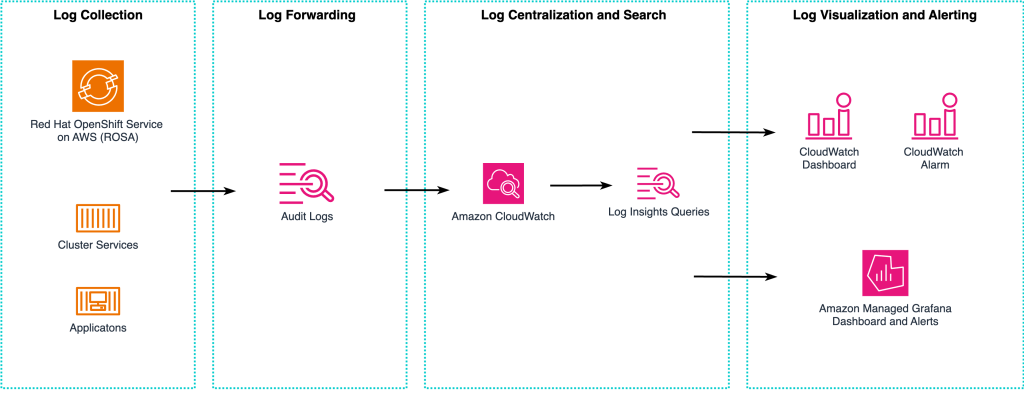
Figure 1. Using AWS observability services with ROSA
In the four scenarios mentioned above, you will learn how to use your ROSA audit logs to build audit dashboards and alerts using Amazon CloudWatch, AWS CloudTrail and Amazon Managed Grafana. We will cover some of the main querying capabilities these services offer to filter and identify security-related anomalies.
How Auditing in ROSA works
With auditing incorporated into your monitoring practices, you can simplify how to detect and mitigate anomalous behaviors and threat patterns. Examples of common best practices and goals for auditing are to:
- Ensure compliance, and provide legal evidence.
- Rapidly troubleshoot and find a root cause.
- Have a clearly established incident response plan (IRP) that supports business continuity objectives.
- Gain insights on actors accessing and managing ROSA resources and successfully trace back and attribute security issues.
- Provide historical views of threats and correlation with changes made to a set of clusters or applications.
- Standardize to simplify analysis.
Shared Responsibility Model: ROSA reduces the scope of incident and operations management activities through a shared responsibility model. Customers are only responsible for maintaining their applications, data, and cluster configurations.
SIEM and Support SLAs: As part of the service, and without customer action required, audit logs are securely centralized in a Security Information and Event Management (SIEM) system. This allows the Red Hat SRE team to act on alerts in the event of security issues under ROSA’s 24×7 support model described in the Red Hat Premium Support SLAs. ROSA customers, upon request, can also access one year of audit data stored in the SIEM system, including for ROSA clusters that have already been deleted.
Audit logs: ROSA provides a security-relevant chronological set of records documenting the sequence of activities that have affected the system by individual users, administrators, or other components of the system. This means customers can view, and filter audit logs with ease.
Audit Scenarios
Prerequisites and AWS Costs
To get started with all four scenarios, you need to confirm first that you satisfy the following prerequisites. You will need:
- A ROSA cluster. Refer to this AWS documentation to create one.
- Access to an AWS account, with permissions to create and delete the resources described in the following steps.
- A Red Hat account to access your ROSA cluster through the Red Hat Hybrid Cloud Console.
- The following deployment tools: the AWS command-line interface (aws) , and OpenShift command-line interface (oc).
To understand the cost of the AWS services used in this post, we recommend that you look at the pricing page of ROSA and the AWS Pricing Calculator.
Scenario 1 – Use AWS CloudTrail and the ROSA cluster history to audit SRE and application access to AWS resources
AWS CloudTrail captures API calls for AWS resources managed by ROSA as events. This includes calls from users and service roles accessing the cluster AWS resources.
Additionally, the ROSA cluster history captures calls from the OpenShift console and from OpenShift API operations. Examples of cluster history categories are Cluster Access, Cluster Ownership, and Customer Support, to name a few.
When core services of ROSA are affected by an incident, the alerts being sent to ROSA are accessible through the Red Hat Hybrid Cloud Console in the cluster history view as shown in figure 2. You can follow the next three steps to access it:
- Log in to the Red Hat Hybrid Console to access the list of ROSA clusters.
- Select your cluster to access its detailed view.
- Select the Cluster history tab.
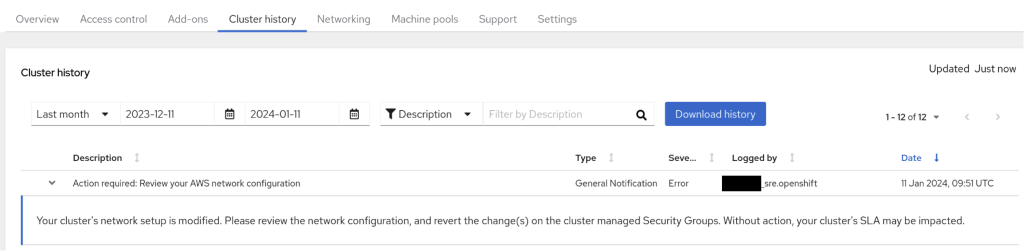
Figure 2. Cluster history event in the ROSA Hybrid Cloud console
In support scenarios where the Red Hat SRE team performs troubleshooting actions using the ROSA IAM Support Role, SRE actions are logged in CloudTrail. The corresponding events can be filtered using a RH-SRE-<username> format as the search criteria, as displayed in the following CloudTrail console screenshot.
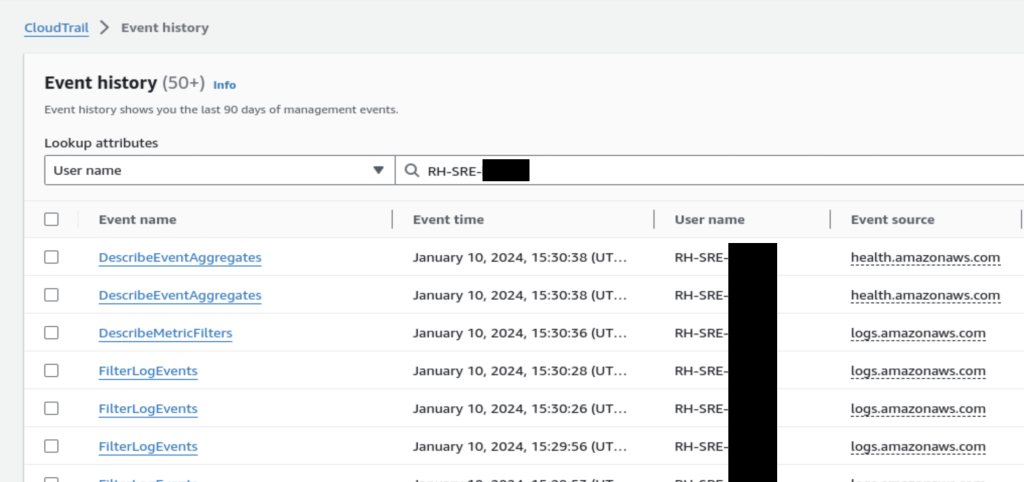
Figure 3. AWS CloudTrail event history showing ROSA SRE actions.
To receive notifications from the ROSA cluster history, you can configure emails in the Red Hat Hybrid Cloud Console under the detailed view of each cluster in the Support tab.
Similarly, for notifications from CloudTrail events, you can create a trail associated to a CloudWatch log group.
- In the CloudWatch console, find the log group created by CloudTrail and select it.
- Under actions, select Create metric filter.
- A metric filter pattern can then be applied to alert only on specific actions. This is an example of an SRE access action filter rule where RH-SRE is the prefix for all Red Hat SRE user names:
{ $.userIdentity.userName = %RH-SRE% }
- Finally, create a CloudWatch alarm based on the metric filter.
Scenario 2 – Send ROSA audit logs to Amazon CloudWatch and detect suspicious activities with Log Insights
- Log collection: Audit logs in ROSA come from log collectors, configured through the Red Hat OpenShift Logging operator.
- Log forwarding: The operator allows users to configure log forwarders capable of sending audit logs to a range of supported destinations, including Amazon CloudWatch.
- Log centralization and search: Audit log events are in JSON format and follow the kube-apiserver Audit Configuration API standard. The log structure simplifies searching and analyzing log data with CloudWatch Logs Insights.
Step 1 – Create an IAM role allowing ROSA to send logs to CloudWatch
ROSA integrates with AWS Security Token Service (STS), allowing the ROSA logging operator to forward audit logs to CloudWatch. The operator installed in the openshift-logging project uses the logcollector service account. An AWS IAM role needs to be attached to the operator’s project and service account to grant permissions to create logs into CloudWatch.
Note: The following instructions are for capturing the audit logs of both the control plane and the worker nodes of a ROSA Classic cluster. The instructions also work for capturing the audit logs of the worker nodes of a ROSA cluster with Hosted Control Planes (HCP). Please note that to capture the audit logs of the control plane for a ROSA HCP cluster, you need to follow the instructions provided in this Red Hat article.
First, create an IAM trust policy:
export OIDC_ENDPOINT=$(oc get authentication.config.openshift.io cluster -o jsonpath='{.spec.serviceAccountIssuer}' | sed -e "s/^https:\/\///")
export AWS_ACCOUNT_ID=$(aws sts get-caller-identity --query Account --output text)
export AWS_REGION=$(aws configure get region)
cat <<EOF > ./trust-policy.json
{
   "Version": "2012-10-17",
   "Statement": [{
     "Effect": "Allow",
     "Principal": {
       "Federated": "arn:aws:iam::${AWS_ACCOUNT_ID}:oidc-provider/${OIDC_ENDPOINT}"
     },
     "Action": "sts:AssumeRoleWithWebIdentity",
     "Condition": {
       "StringEquals": {
         "${OIDC_ENDPOINT}:sub": "system:serviceaccount:openshift-logging:logcollector"
       }
     }
   }]
}
EOF

ROLE_ARN=$(aws iam create-role --role-name "RosaCloudWatchDemo" \
   --assume-role-policy-document file://./trust-policy.json \
   --query Role.Arn --output text)
echo ${ROLE_ARN}
LOGGROUP_PREFIX=rosa-demo-cluster
Next, declare the IAM permissions required to read and write audit logs in to a CloudWatch log group:
cat << EOF > policy.json
{
"Version": "2012-10-17",
"Statement": [
   {
         "Effect": "Allow",
         "Action": [
            "logs:CreateLogGroup",
            "logs:CreateLogStream",
            "logs:DescribeLogGroups",
            "logs:DescribeLogStreams",
            "logs:PutLogEvents",
            "logs:PutRetentionPolicy"
         ],
         "Resource": "arn:aws:logs:${AWS_REGION}:${AWS_ACCOUNT_ID}:log-group:${LOGGROUP_PREFIX}.audit:*"
   }
]
}
EOF

POLICY_ARN=$(aws iam create-policy --policy-name "RosaCloudWatch" \
--policy-document file://./policy.json --query Policy.Arn --output text)
Finally, attach the newly created IAM Policy to the IAM Role created earlier:
aws iam attach-role-policy --role-name "RosaCloudWatchDemo" \
--policy-arn ${POLICY_ARN}
Step 2 – Installing the Cluster Logging Operator (CLO)
The operator can be installed through the OperatorHub UI in the ROSA cluster web console or by deploying the following OpenShift OperatorGroup resource with the following oc command-line:
cat << EOF | oc create -f -
apiVersion: operators.coreos.com/v1
kind: OperatorGroup
metadata:
  name: cluster-logging
  namespace: openshift-logging
spec:
  targetNamespaces: [ ]
---
apiVersion: operators.coreos.com/v1alpha1
kind: Subscription
metadata:
  labels:
   operators.coreos.com/cluster-logging.openshift-logging: ""
  name: cluster-logging
  namespace: openshift-logging
spec:
  channel: stable
  installPlanApproval: Automatic
  name: cluster-logging
  source: redhat-operators
  sourceNamespace: openshift-marketplace
EOF
Once the operator is ready, create an OpenShift secret that references the IAM role previously created:
cat << EOF | oc apply -f -
apiVersion: v1
kind: Secret
metadata:
  name: cloudwatch-credentials
  namespace: openshift-logging
stringData:
  role_arn: $ROLE_ARN
EOF
Step 3 – Forward the logs into CloudWatch
At this stage, select which types of logs (application, infrastructure, and audit logs) you wish to forward to CloudWatch. In the following example, only the audit logs will be forwarded:
cat << EOF | oc apply -f -
apiVersion: "logging.openshift.io/v1"
kind: ClusterLogForwarder
metadata:
  name: instance
  namespace: openshift-logging
spec:
  outputs:
    - name: cw
      type: cloudwatch
      cloudwatch:
        groupBy: namespaceName
        groupPrefix: ${LOGGROUP_PREFIX}
        region: ${AWS_REGION}
      secret:
        name: cloudwatch-credentials
  pipelines:
     - name: to-cloudwatch
       inputRefs:
         - audit
       outputRefs:
         - cw
EOF
For the logs to be forwarded, create a Logging instance and specify the log collector type, Vector in this case:
cat << EOF | oc apply -f -
apiVersion: logging.openshift.io/v1
kind: ClusterLogging
metadata:
  name: instance
  namespace: openshift-logging
spec:
  collection:
    type: vector
  forwarder:
    vector: {}
  managementState: Managed
EOF
This will create multiple instances of the log collectors, running as Pods under the openshift-logging namespace. Use the following oc command to list them and verify that their status is Running:
oc get pod -n openshift-loggingYou should see an output similar to this:
NAME                                        READY   STATUS    RESTARTS        AGE

 cluster-logging-operator-6fd6dbc575-vdhn4   1/1     Running   0               41m

 collector-gxxdh                             2/2     Running   1 (17m ago)     18m

 collector-hggsk                             2/2     Running   2 (14m ago)     18m


         <output truncated …>
A new Log group will then be created automatically and named after the groupPrefix defined in the ClusterLogForwarder resource. Figure 4 shows an example of log group named rosa-demo-cluster.audit, named as per the ClusterLogForwarder resource previously created earlier.
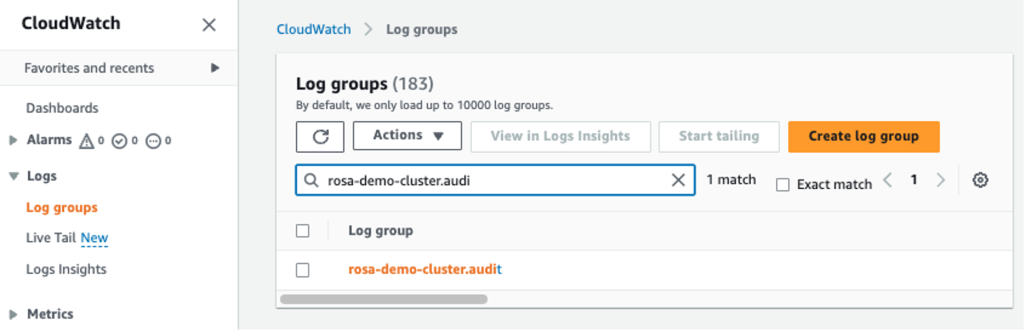
Figure 4. ROSA audit logs stored in an Amazon CloudWatch log group.
Step 4 – Creating an Audit Dashboard
Using CloudWatch Logs Insights, you can now create an audit dashboard with the following steps:
- Go to the CloudWatch console, then select Logs and Log Insights in the left-menu.
- Find and select the ROSA audit log group rosa-demo-cluster.audit.
- Use the following sample query to count the total number of failed access attempts in your cluster. Use the Log Insights filter to change the date range depending on the period you are interested in. Then use the following Log Insights query in and select Run query:
fields responseStatus
| filter responseStatus.code = '403'
| stats count (*)
| limit 1
- Choose Run query. You should see a histogram similar to the diagram shown below in figure 5:
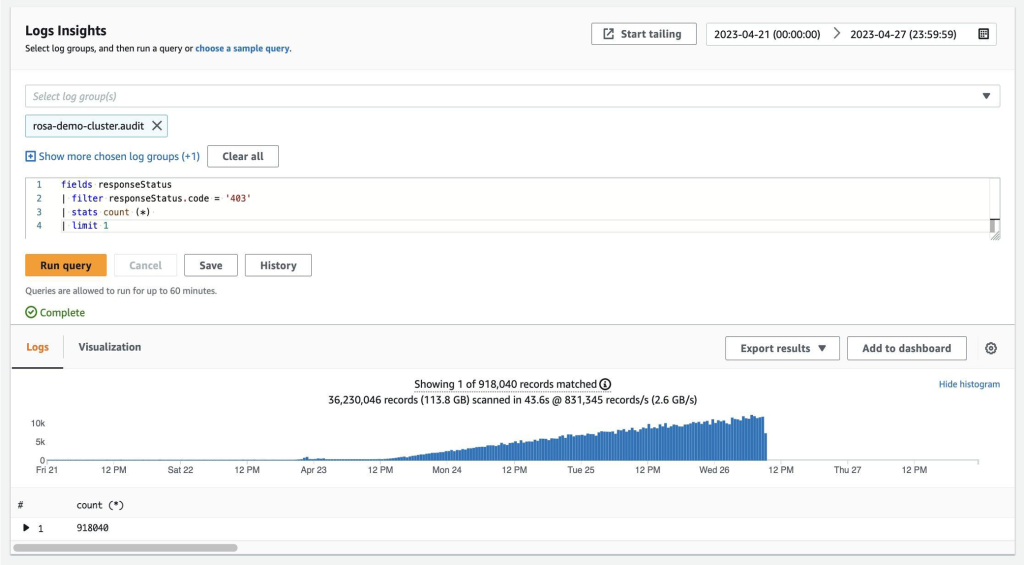
Figure 5. Amazon CloudWatch Log Insights – search query and results.
More examples of CloudWatch Log Insights queries can be seen in the following table:
| Example scenario | CloudWatch Log Insights query |
| Identify actions injecting and running commands in a pod | fields objectRef
| filter objectRef.subresource = 'exec' |
| Identify forbidden actions | fields `annotations.authorization.k8s.io/reason`
| filter `annotations.authorization.k8s.io/decision` = 'forbid' |
| List top 10 user agents and usernames | fields userAgent, user.username
| filter ispresent (userAgent) and user.username not like /system/
| stats count (*) as UserAgent by userAgent, user.username
| sort UserAgent desc
| limit 10 |
| Count of the top 10 source IPs | fields sourceIPs.0
| filter ispresent (sourceIPs.0) and sourceIPs.0 not like /::1/
| stats count (*) as SRC_IP_Count by sourceIPs.0
| sort SRC_IP desc
| limit 10" |
Table 1. Examples of CloudWatch Insights queries.
Step 5 – Select Add to dashboard and create a new dashboard.
In this last step, you select Add to dashboard in CloudWatch to name and customize your audit dashboard as shown in figure 6:
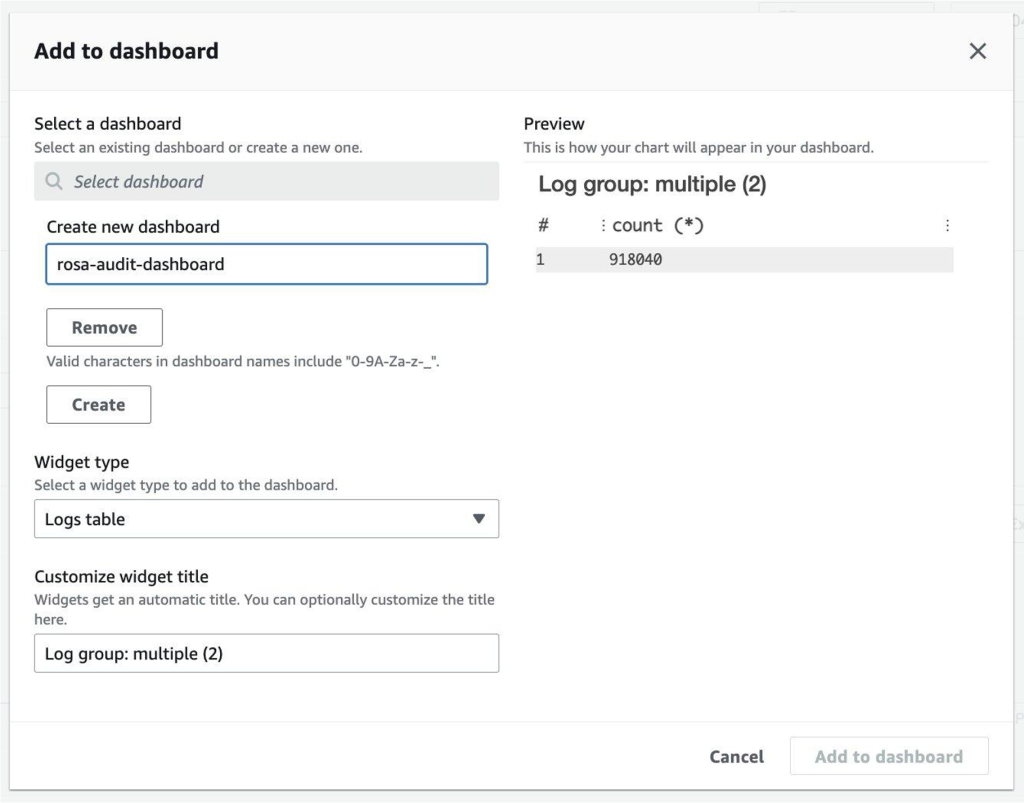
Figure 6. Creating a new CloudWatch dashboard from Log Insights.
Scenario 3 – Create CloudWatch alarms to monitor SRE access to ROSA
Amazon CloudWatch alarms can be defined to notify you based on terms and patterns found in log data. This scenario filters OpenShift events based on a specific service account (openshift-backplane-srep) which is used during SRE activities on the cluster.
Here is an example event that shows that an SRE is listing the nodes of the cluster:
{
    "@timestamp": "2024-01-11T09:13:28.944520529Z",
    "annotations": {
        "authorization.k8s.io/decision": "allow",
        "authorization.k8s.io/reason": "RBAC: allowed by ClusterRoleBinding \"backplane-readers-cluster-system:serviceaccounts:openshift-backplane-srep\" of ClusterRole \"backplane-readers-cluster\" to Group \"system:serviceaccounts:openshift-backplane-srep\""
    },
    ...
    "log_type": "audit",
    "objectRef": {
        "apiVersion": "v1",
        "resource": "nodes"
    },
    ...
    "user": {
        "groups": [
            "system:serviceaccounts",
            "system:serviceaccounts:openshift-backplane-srep",
            "system:authenticated"
        ],
        ...
        "username": "system:serviceaccount:openshift-backplane-srep:abcd1234"
    },
    "userAgent": "oc/4.11.0 (linux/amd64) kubernetes/7075089",
    "verb": "list"
}
To create an alarm on SRE actions like the one above, do the following:
- Create a log metric filter with the following attributes :
- Filter pattern: { $.user.username = %openshift-backplane-srep% }
- Metric Value : 1
- Unit: Count
- Under Log Group, choose the Metric filters tab, select the newly created Metric filter
- Proceed to create the alarm by providing the expected conditions threshold (example: > 0 to be notified on all SRE action) and select Create alarm.
- Send your alarm’s notifications to your destination of choice such as Amazon Simple Notification Service (SNS) or AWS Lambda. Alternatively, alarms can be visualized in the CloudWatch console.
Scenario 4 – Visualize and audit multiple ROSA clusters with dashboards in Amazon Managed Grafana
Amazon Managed Grafana comes with a wide range of verified monitoring data sources such as databases, IoT, tracing. Figure 7 also shows additional available AWS purpose-built data sources. For this scenario, you will configure the CloudWatch data source since the cluster log group already contains the ROSA cluster audit logs.
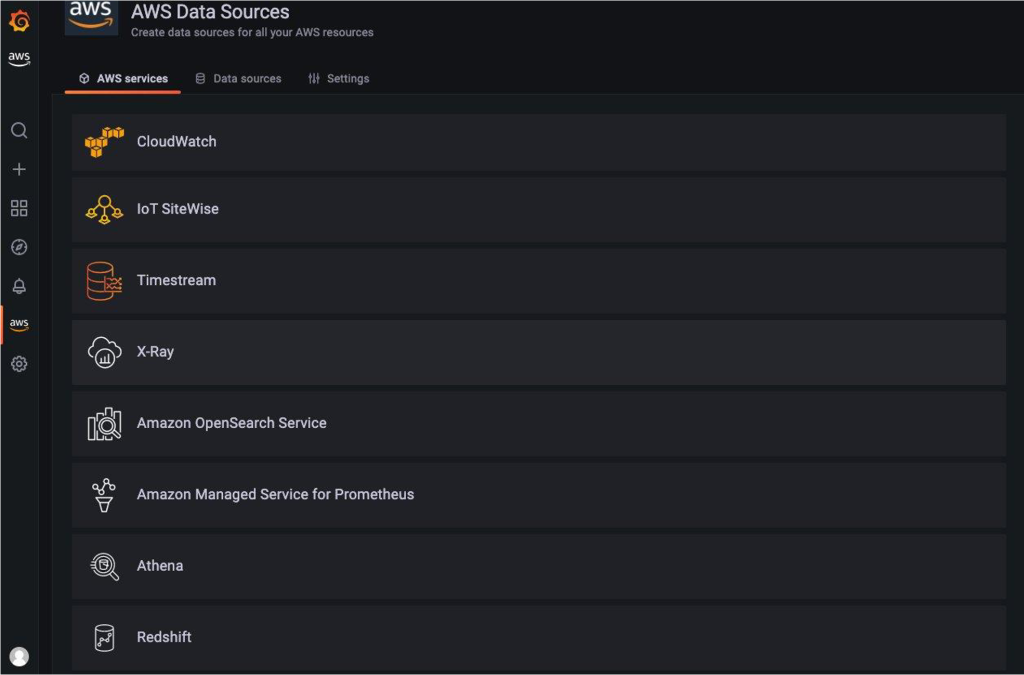
Figure 7. AWS data sources available on Amazon Managed Grafana.
- Start by creating a Grafana workspace and logging in to it as an administrator.
- Create a CloudWatch data source by selecting AWS and Data sources in the left menu as shown in Figure 8:
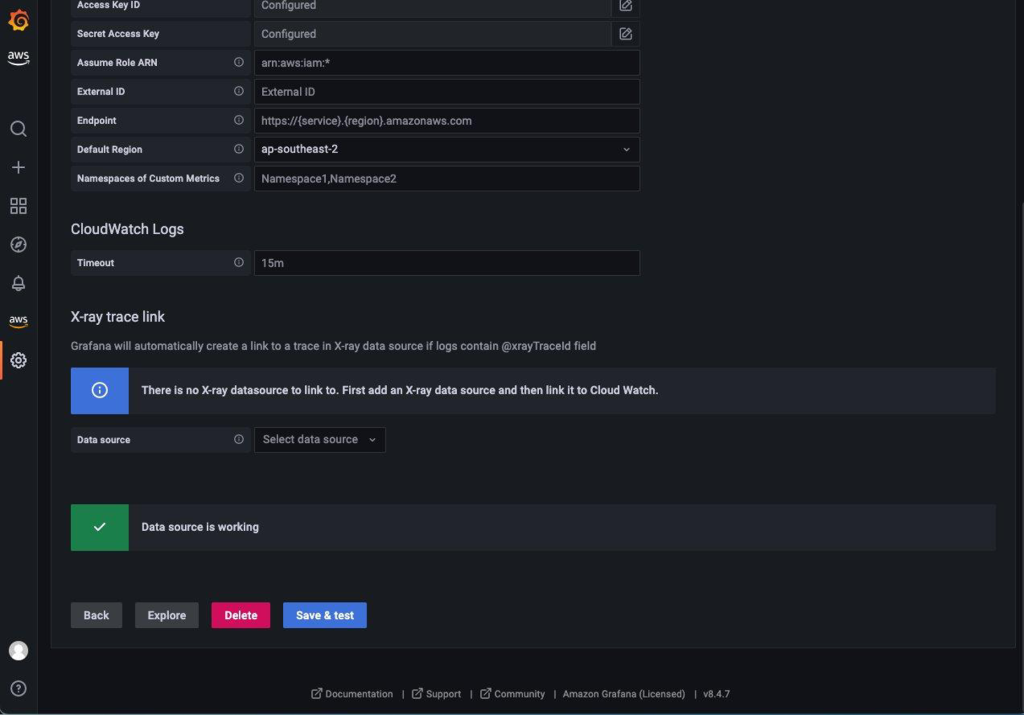
Figure 8. Configuring the Grafana CloudWatch data source.
- Finally, download and import the example audit dashboard using the Upload JSON file action shown in Figure 9 below. The steps to import are described more in details in this the Amazon Managed Grafana documentation.
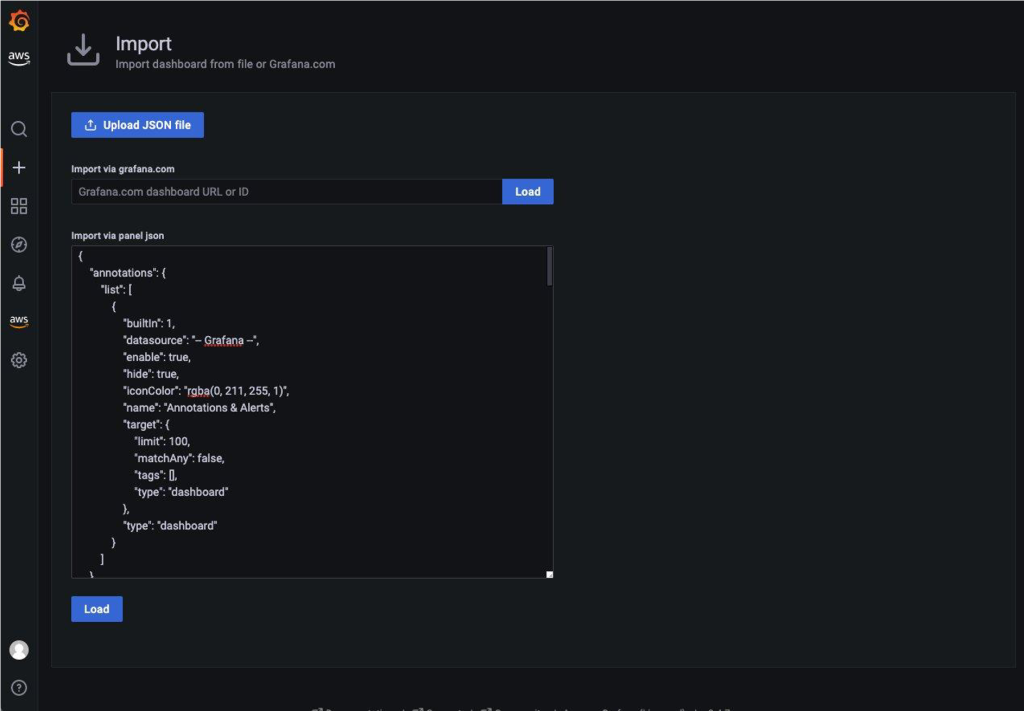
Figure 9. Importing a Grafana dashboard from a JSON file.
After importing the dashboard, you can visualize the audit data for each of your ROSA clusters. Figure 10 shows widgets that use visualizations and tabular data based on the Log Insight queries mentioned previously.
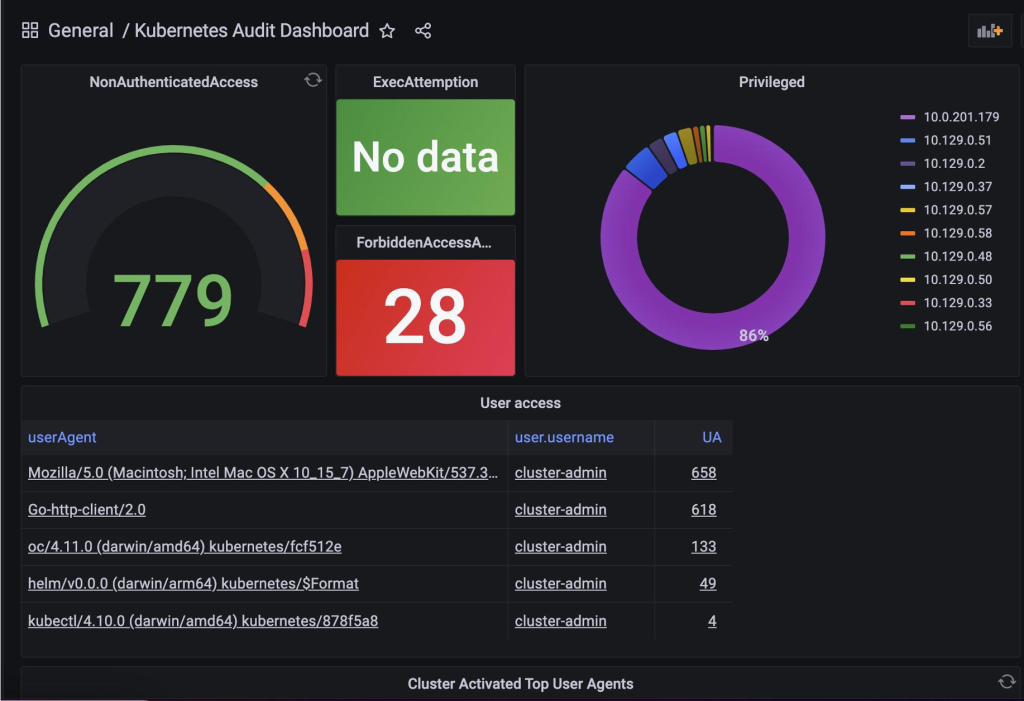
Figure 10. Visualizing ROSA audit logs in the Amazon Managed Grafana dashboard.
The dashboard provides filters as shown in Figure 11, allowing you to use different AWS regions and CloudWatch log groups, which is useful when managing multiple clusters.

Figure 11. Filtering the audit dashboard per region and log group.
Cleanup
If you decide that you no longer want to keep the resources created in this post or want to avoid incurring costs, you can delete the CloudWatch log group, IAM role and policy, and the Managed Grafana dashboard.
Similarly, if the ROSA cluster you have used is a test cluster used for this solution only, you can delete it by following this Red Hat documentation.
Summary
In this blog post, you learned how to configure the Cluster Logging Operator (CLO) in ROSA and how to visualize audit logs using Amazon CloudWatch alarms, CloudWatch Log Insights, and Amazon Managed Grafana.
Don’t wait until a security incident to introduce audit monitoring. Using AWS observability services combined with the monitoring stack of ROSA helps you to rapidly meet security requirements by implementing detection and granular views, based on the actors and their associated actions in ROSA clusters.
Lean on AWS and Red Hat teams. AWS Account Teams, Container, and Security experts work with Red Hat to provide hands-on resources and real-world insights. They offer best practices, proven patterns, and expert advice. Whether you’re new to container security or need advanced help, reach out to us.
Visit the Red Hat OpenShift offers on the AWS Marketplace:
Want to get started on how-to content on AWS?
- Red Hat Solutions on AWS
- Red Hat OpenShift Service on AWS (ROSA) YouTube playlist
- Fine-grained IAM roles for Red Hat OpenShift Service on AWS (ROSA) workloads with STS
- OpenShift Logging and Kubernetes Auditing – The mighty Duo
- Enhanced Threat Detection with AWS Security Hub and Red Hat Advanced Cluster Security for Kubernetes
- AWS monitoring and observability services
Sample code, software libraries, command line tools, proofs of concept, templates, or other related technology are provided as AWS Content or Third-Party Content under the AWS Customer Agreement, or the relevant written agreement between you and AWS (whichever applies). You should not use this AWS Content or Third-Party Content in your production accounts, or on production or other critical data. You are responsible for testing, securing, and optimizing the AWS Content or Third-Party Content, such as sample code, as appropriate for production grade use based on your specific quality control practices and standards. Deploying AWS Content or Third-Party Content may incur AWS charges for creating or using AWS chargeable resources, such as running Amazon EC2 instances or using Amazon S3 storage.