Artificial Intelligence
Achieve in-vehicle comfort using personalized machine learning and Amazon SageMaker
This blog post is co-written by Rudra Hota and Esaias Pech from Continental AG.
Many drivers have had the experience of trying to adjust temperature settings in their vehicle while attempting to keep their eyes on the road. Whether the previous driver preferred a warmer cabin temperature, or you’re now wearing warmer clothing, or the sun just emerged from the clouds, multiple conditions can make a driver uncomfortable and force their attention to the vehicle temperature dial. Wouldn’t it be convenient if your vehicle’s heating, ventilation, and air conditioning (HVAC) system could learn your individual preferences, and automatically make these adjustments for you?
Continental AG, a German multinational automotive technology conglomerate and Tier 1 supplier of automotive parts and technology, recently embarked on an initiative to develop in-vehicle human machine interface (HMI) capabilities enabled by machine learning (ML) technologies that will deliver personalization features for its OEM (original equipment manufacturer) automotive customers.
To help bring that vision to life, Continental Automotive Systems partnered with the Amazon Machine Learning Solutions Lab to develop personalization algorithms that learn from user behavior and automatically adjust the temperature for the driver to experience optimal in-vehicle thermal comfort. This is a challenging task to accomplish because people have different thermal preferences, and these preferences can also vary significantly depending on external environmental factors and multiple thermal loads affecting the temperature of the vehicle. The multi-contextual personalization system developed during the ML Solutions Lab engagement uses Amazon SageMaker, and is a first step on a broader journey by Continental AG toward transforming the automotive driving experience using ML to create and deliver an innovative suite of on-board personalization features for drivers.
Exploring the data
To prototype this solution, Continental Automotive Systems collected several hours of real-world data using a test vehicle equipped with multiple sensors that measured, among other things, the outside temperature, cabin temperature and humidity, and sunlight. Subjects were asked to adjust the temperature as they drove the test vehicle and record their level of comfort on a 7-point scale, where 0 indicates thermal comfort and -3/+3 indicate very cold/hot, respectively. The following figure shows an example session with nine sensor measurements, the temperature setting (hvac_set), and comfort status (comfort). 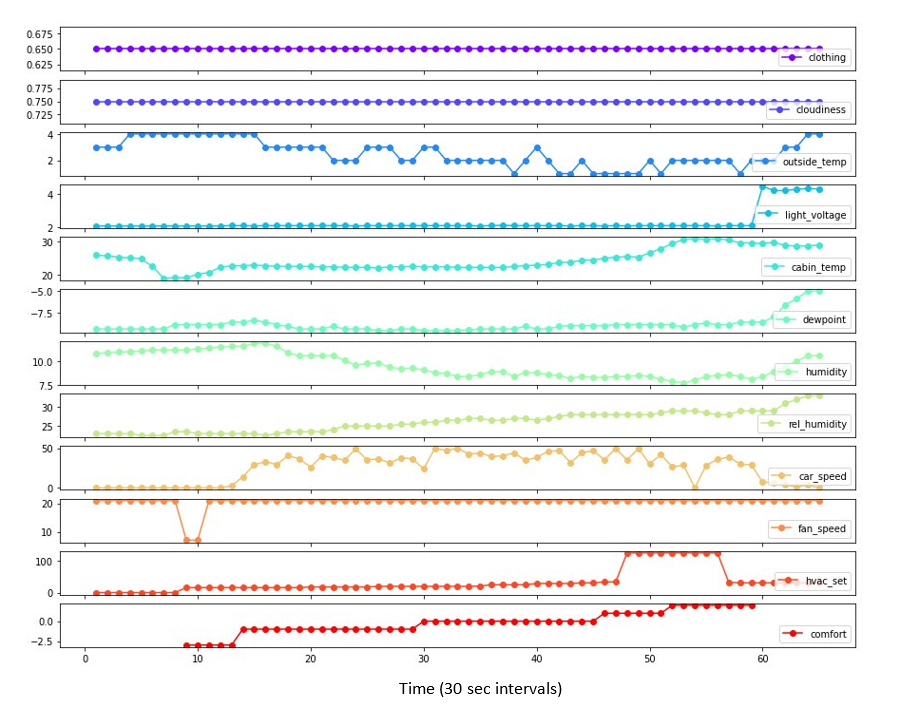
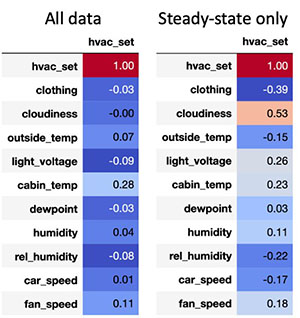
Because subjects were asked to explore the temperature range, they didn’t remain at a steady-state for long. Consequently, if we look at the correlation matrix across all timepoints from all sessions, there isn’t a clear relationship between the sensor readings and the set temperature (hvac_set). To learn a cleaner relationship, we detected and extracted the steady-state periods, defined as the periods of thermal comfort during which the sensor readings are stable within some threshold. We then used these steady-state periods to regenerate the correlation plot. By doing so, the amount of clothing worn (clothing) and cloudiness (cloudiness) or degree of darkness (light_voltage) reveal themselves as well-correlated variables. (Note that light_voltage is actually a measure of the voltage required to control ambient light and headlights, so higher values mean it’s darker outside.) Intuitively, as clothing increases, the temperature is set lower in order to achieve comfort, and as cloudiness and light_voltage increase, the temperature is set higher.
The following table shows the correlation between set temperature (hvac_set) and sensor readings, for all data (left) and steady-states only (right).
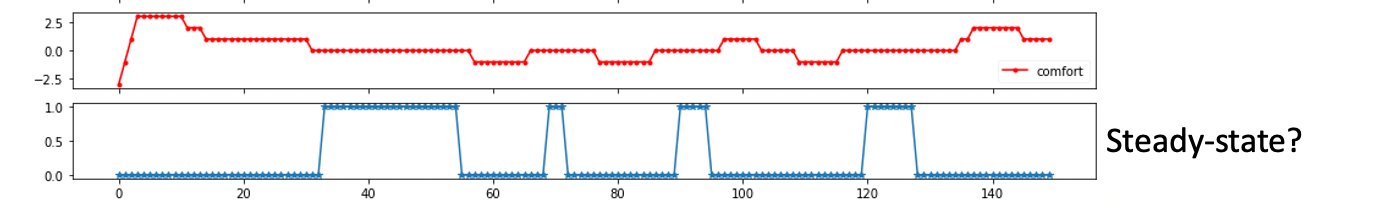
In the following figure, steady-states are detected (bottom; value=1.0) during periods of thermal comfort (top), and when sensor measurements are relatively stable.
Given this finding, we chose to focus on clothing and solar load (collapsing cloudiness and light_voltage into a single variable, and inverting the sign such that higher values mean more sunlight) as the primary input variables to the ML model. Given that only a small amount of real-world data was collected for this prototype, we decided to first develop this modeling approach using a simulated environment, where we could generate as much data as we want and more robustly evaluate the advantages and disadvantages of each approach.
For this data exploration, as well as the simulation and modeling described in later sections, we used SageMaker. With SageMaker, we could securely access the provided data stored on Amazon Simple Storage Service (Amazon S3) and quickly explore it within fully managed Jupyter notebooks via one-click notebook instances. Next, we used a pre-loaded data science environment within our notebooks (complete with ML frameworks like PyTorch and MXNet) to prototype and implement the model and simulator, which are described in the next sections.
Simulating in-vehicle temperature dynamics
Our aim with the simulator was to capture the key variables and dynamics governing thermal comfort. Our assumption was if our chosen model was sophisticated enough to learn the relevant relationships within this environment, it could also learn the true relationships in the real-world data (an assumption that is validated by the real-world experimentation at the end of the post).
The simulation scheme we devised is pictured in the following figure. Crucially, as will be the case in production, this is a closed loop system where the temperature-adjusting behavior affects the cabin temperature, which then indirectly affects the temperature-setting behavior. Both exogenous factors (orange) and endogenous factors (green) play a role, and exponential temporal dynamics determine how these impact the cabin air temperature, near-skin temperature, and ultimately the set temperature.

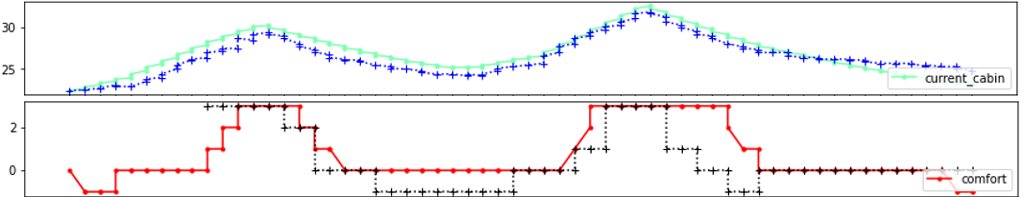
The interactions across these variables through time allow for a complex and dynamic system that we can use to generate sessions. Moreover, we found that our system could be tuned to mimic real-world sessions, which gives us confidence that we captured the relevant variables and dynamics. In the following figure, the simulator (solid) is able to mimic real-world (dashed) dynamics.
Building a contextual, personalized model
Before setting about building our personalization system, we first established some baselines of increasing complexity. The simplest baseline (“non-personalized baseline”) is to use the average temperature setting as the prediction. A slightly more sophisticated baseline uses the average temperature per person as the prediction for that person (“personalized baseline”). Finally, we have a trained baseline (“non-personalized model”) that learns from user behavior in an undifferentiated way. It learns about situations that are generally true (such as the more clothing a driver or passenger is wearing, the lower the temperature should be to achieve comfort), but doesn’t learn any of the personal preferences. This model can be used for new or guest users who don’t have any data.
In building the personalization system, we wanted to leverage the commonalities across users, as well as the differences among them. In that regard, we adopted a two-step approach. First, we trained a neural network using all data in an undifferentiated way. The inputs included both the exogenous variables as well as demographic information. Second, we fine-tuned the final layer of the neural network for each person, using just their data.
In addition to making sense intuitively, this approach (“personalized model”) outperformed all of the baselines, as measured by the mean-squared error (MSE) between the predicted and actual temperature setting in the steady-state periods. This approach was also more accurate than similar setups, like training from scratch per person without the initial pre-training or fine-tuning all parameters, rather than just the final layer. It was computationally more efficient than these approaches, because only the final layers need to be trained and stored per person, rather than having an entirely distinct model per person. For both stages, we detected and used just the steady-state periods for training, because these have a clearer relationship between the sensor readings and the temperature to set to achieve comfort. Steady-state detection was done using only sensor measurements, because the comfort variable won’t actually be available in production. We also experimented with temporal sequence modeling using the entire time series, but found that performance was consistently worse with this approach.
The following table shows the personalized model beats baselines on simulated data, in terms of MSE.
| Model | MSE
(lower is better) |
| Non-personalized baseline | 9.681 |
| Personalized baseline | 7.270 |
| Non-personalized model | 1.518 |
| Personalized model | 0.555 |
For the simulated data, we could also evaluate the model as if it were in production, by replacing the manual control of the temperature with the automatic control of the model (model-as-controller). With this setup, we can simulate sessions with each model as the controller and evaluate how often the user is in a comfortable state with this automatic control, where a comfort ratio of 1.0 indicates that the user is perfectly comfortable throughout the whole session. As with the MSE metric, the personalized model outperforms the non-personalized baseline (see the following table). Moreover, the personalized model outperforms manual control, because the automated system responds immediately to changing conditions, whereas the persona takes some time to react.
| Model | Comfort Ratio
(higher is better) |
| Manual control | .575 |
| Non-personalized model | .531 |
| Personalized model | .700 |
Having established our modeling approach on the simulated data, we returned to the real-world data to see if we could beat the baselines. As before, we pre-trained the model on all data and then fine-tuned the last layer of the model for the two participants with greater than seven steady-state periods (one participant was excluded because they seldom adjusted the temperature setting). Once again, the personalized model beat the baselines (see the following table), reinforcing the conclusion that the personalized model is best.
| Model | MSE
(lower is better) |
| Non-personalized baseline | 60.885 |
| Personalized baseline | 69.902 |
| Non-personalized model | 24.823 |
| Personalized model | 18.059 |
Conclusion
In this post, we demonstrated how to apply machine learning to achieve personalized in-vehicle thermal comfort. With the simulation environment that was developed, we were able to prototype and evaluate different modeling approaches, which were then successfully applied to real-world data.
Naturally, to scale this solution to production roll-out, more real-world data is needed, and we can use the simulation environment to generate estimates on the amount of data needed for collection. In addition, for the system to perform end to end, ancillary modules are needed to identify the driver (and other occupants) and load their personalized profiles, including detecting the type of clothing on the individuals. These modules will require their own data and ML pipelines and, like the thermal comfort system, can use a cloud-edge architecture, where model training workloads are run in the cloud, while inference and minor updates can be performed at the edge in a privacy-preserving way.
This setup—with smart, ML-powered personalization applications delivered within the vehicle through a hybrid cloud and edge communication architecture—is a powerful paradigm, which can be replicated to bring ever-increasing intelligence at scale to the automotive driving experience.
About the Authors
 Joshua Levy is a Senior Applied Scientist in the Amazon Machine Learning Solutions lab, where he helps customers design and build AI/ML solutions to solve key business problems.
 Yifu Hu is an Applied Scientist in the Amazon Machine Learning Solutions lab, where he helps design creative ML solutions to address customers’ business problems in various industries.
 Shane Rai is a Sr. ML Strategist at the Amazon Machine Learning Solutions Lab. He works with customers across a diverse spectrum of industries to solve their most pressing and innovative business needs using AWS’s breadth of cloud-based AI/ML services.
 Boris Aronchik is a Manager in the Amazon AI Machine Learning Solutions Lab, where he leads a team of ML scientists and engineers to help AWS customers realize business goals leveraging AI/ML solutions.
 Jennifer Zhu is an Applied Scientist from the Amazon AI Machine Learning Solutions Lab. She works with AWS’s customers to build AI/ML solutions for their high-priority business needs.
 Ivan Sosnovik is an Applied Scientist in the Amazon Machine Learning Solutions Lab. He develops ML solutions to help customers to achieve their business goals.
 Rudra N. Hota is an Artificial Intelligence Engineer at Holistic Engineering and Technologies at Continental Automotive Systems. With expertise in the field of Computer vision and machine learning, he is working with diverse teams to collaboratively define problem statements and explore fitting solutions.
 Esaias Pech is a Software Engineering Manager in the Continental Engineering Services group, where he gets the opportunity to work with Automotive OEMs on Displays, Driver Monitoring Cameras and Infotainment High Performance Computers to improve User Experience in the next generation of vehicles.