Artificial Intelligence
How Digitata provides intelligent pricing on mobile data and voice with Amazon Lookout for Metrics
This is a guest post by Nico Kruger (CTO of Digitata) and Chris King (Sr. ML Specialist SA at AWS). In their own words, “Digitata intelligently transforms pricing and subscriber engagement for mobile operators, empowering operators to make better and more informed decisions to meet and exceed business objectives.”
As William Gibson said, “The future is here. It’s just not evenly distributed yet.” This is incredibly true in many emerging markets for connectivity. Users often pay 100 times more for data, voice, and SMS services than their counterparts in Europe or the US. Digitata aims to better democratize access to telecommunications services through dynamic pricing solutions for mobile network operators (MNOs) and to help deliver optimal returns on their large capital investments in infrastructure.
Our pricing models are classically based on supply and demand. We use machine learning (ML) algorithms to optimize two main variables: utilization (of infrastructure), and revenue (fees for telco services). For example, at 3:00 AM when a tower is idle, it’s better to charge a low rate for data than waste this fixed capacity and have no consumers. Comparatively, for a very busy tower, it’s prudent to raise the prices at certain times to reduce congestion, thereby reducing the number of dropped calls or sluggish downloads for customers.
Our models attempt to optimize utilization and revenue according to three main features, or dimensions: location, time, and user segment. Taking the traffic example further, the traffic profile over time for a tower located in a rural or suburban area is very different from a tower in a central downtown district. In general, the suburban tower is busier early in the mornings and later at night than the tower based in the central business district, which is much busier during traditional working hours.
Our customers (the MNOs) trust us to be their automated, intelligent pricing partner. As such, it’s imperative that we keep on top of any anomalous behavior patterns when it comes to their revenue or network utilization. If our model charges too little for data bundles (or even makes it free), it could lead to massive network congestion issues as well as the obvious lost revenue impact. Conversely, if we charge too much for services, it could lead to unhappy customers and loss of revenue, through the principles of supply and demand.
It’s therefore imperative that we have a robust, real-time anomaly detection system in place to alert us whenever there is anomalous behavior on revenue and utilization. It also needs to be aware of the dimensions we operate under (location, user segment, and time).
History of anomaly detection at Digitata
We have been through four phases of anomaly detection at Digitata in the last 13 years:
- Manually monitoring our KPIs in reports on a routine basis.
- Defining routine checks using static thresholds that alert if the threshold is exceeded.
- Using custom anomaly detection models to track basic KPIs over time, such as total unique customers per tower, revenue per GB, and network congestion.
- Creating complex collections of anomaly detection models to track even more KPIs over time.
Manual monitoring continued to grow to consume more of our staff hours and was the most error-prone, which led to the desire to automate in Phase 2. The automated alarms with static alert thresholds ensured that routine checks were actually and accurately performed, but not with sufficient sophistication. This led to alert fatigue, and pushed us to custom modeling.
Custom modeling can work well for a simple problem, but the approach for one particular problem doesn’t translate perfectly to the next problem. This leads to a number of models that must be operating in the field to provide relevant insights. The operational complexity of orchestrating these begins to scale beyond the means of our in-house developers and tooling. The cost of expansion also prohibits other teams from running experiments and identifying other opportunities for us to leverage ML-backed anomaly detection.
Additionally, although you can now detect anomalies via ML, you still need to do frequent deep-dive analysis to find other combinations of dimensions that may point to underlying anomalies. For example, when a competitor is strongly targeting a certain location or segment of users, it may have an adverse impact on sales that may not necessarily be reflected, depending on how deep you have set up your anomaly detection models to actively track the different dimensions.
The problem that remains to be solved
Given our earlier problem statement, it means that we have, at least, the following dimensions under which products are being sold:
- Thousands of locations (towers).
- Hundreds of products and bundles (different data bundles such as social or messaging).
- Hundreds of customer segments. Segments are based on clusters of users according to hundreds of attributes that are system calculated from MNO data feeds.
- Hourly detection for each day of the week.
We can use traditional anomaly detection methods to have anomaly detection on a measure, such as revenue or purchase count. We don’t, however, have the necessary insights on a dimension-based level to answer questions such as:
- How is product A selling compared to product B?
- What does revenue look like at location A vs. location B?
- What do sales look like for customer segment A vs. customer segment B?
- When you start combining dimensions, what does revenue look like on product A, segment A, vs. product A, segment B; product B, segment A; and product B, segment B?
The number of dimensions quickly add up. It becomes impractical to create anomaly detection models for each dimension and each combination of dimensions. And that is only with the four dimensions mentioned! What if we want to quickly add two or three additional dimensions to our anomaly detection systems? It requires time and resource investment, even to use existing off-the-shelf tools to create additional anomaly models, notwithstanding the weeks to months of investment required to build it in-house.
That is when we looked for a purpose-built tool to do exactly this, such as the dimension-aware managed anomaly detection service, Amazon Lookout for Metrics.
Amazon Lookout for Metrics
Amazon Lookout for Metrics uses ML to automatically detect and diagnose anomalies (outliers from the norm) in business and operational time series data, such as a sudden dip in sales revenue or customer acquisition rates.
In a couple of clicks, you can connect Amazon Lookout for Metrics to popular data stores like Amazon Simple Storage Service (Amazon S3), Amazon Redshift, and Amazon Relational Database Service (Amazon RDS), as well as third-party SaaS applications, such as Salesforce, ServiceNow, Zendesk, and Marketo, and start monitoring metrics that are important to your business.
Amazon Lookout for Metrics automatically inspects and prepares the data from these sources and builds a custom ML model—informed by over 20 years of experience at Amazon—to detect anomalies with greater speed and accuracy than traditional methods used for anomaly detection. You can also provide feedback on detected anomalies to tune the results and improve accuracy over time. Amazon Lookout for Metrics makes it easy to diagnose detected anomalies by grouping together anomalies that are related to the same event and sending an alert that includes a summary of the potential root cause. It also ranks anomalies in order of severity so that you can prioritize your attention to what matters the most to your business.
How we used Amazon Lookout for Metrics
Inside Amazon Lookout for Metrics, you need to describe your data in terms of measures and dimensions. Measures are variables or key performance indicators on which you want to detect anomalies, and dimensions are metadata that represent categorical information about the measures.
To detect outliers, Amazon Lookout for Metrics builds an ML model that is trained with your source data. This model, called a detector, is automatically trained with the ML algorithm that best fits your data and use case. You can either provide your historical data for training, if you have any, or get started with real-time data, and Amazon Lookout for Metrics learns as it goes.
We used Amazon Lookout for Metrics to convert our anomaly detection tracking on two of our most important datasets: bundle revenue and voice revenue.
For bundle revenue, we track the following measures:
- Total revenue from sales
- Total number of sales
- Total number of sales to distinct users
- Average price at which the product was bought
Additionally, we track the following dimensions:
- Location (tower)
- Product
- Customer segment
For voice revenue, we track the following measures:
- Total calls made
- Total revenue from calls
- Total distinct users that made a call
- The average price at which a call was made
Additionally, we track the following dimensions:
- Location (tower)
- Type of call (international, on-net, roaming, off-net)
- Whether the user received a discount or not
- Customer spend
This allows us to have coverage on these two datasets, using only two anomaly detection models with Amazon Lookout for Metrics.
Architecture overview
Apache Nifi is an open-source data flow tool that we use for ETL tasks, both on premises and in AWS. We use it as a main flow engine for parsing, processing, and updating data we receive from the mobile network. This data ranges from call records, data usage records, airtime recharges, to network tower utilization and congestion information. This data is fed into our ML models to calculate the price on a product, location, time, and segment basis.
The following diagram illustrates our architecture.
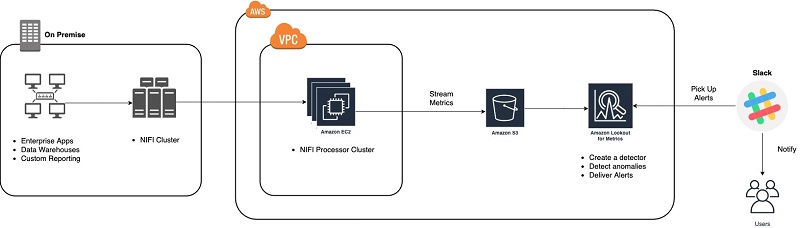
Because of the reality of the MNO industry (at the moment), it’s not always possible for us to leverage AWS for all of our deployments. Therefore, we have a mix of fully on-premises, hybrid, and fully native cloud deployments.
We use a setup where we leverage Apache Nifi, connected from AWS over VPC and VPN connections, to pull anonymized data on an event-based basis from all of our deployments (regardless of type) simultaneously. The data is then stored in Amazon S3 and in Amazon CloudWatch, from where we can use services such as Amazon Lookout for Metrics.
Results from our experiments
While getting to know Amazon Lookout for Metrics, we primarily focused the backtesting functionality within the service. This feature allows you to supply historical data, have Amazon Lookout for Metrics train on a large portion of your early historical data, and then identify anomalies in the remaining, more recent data.
We quickly discovered that this has massive potential, not only to start learning the service, but also to gather insights as to what other opportunities reside within your data, which you may have never thought of, or always expected to be there but never had the time to investigate.
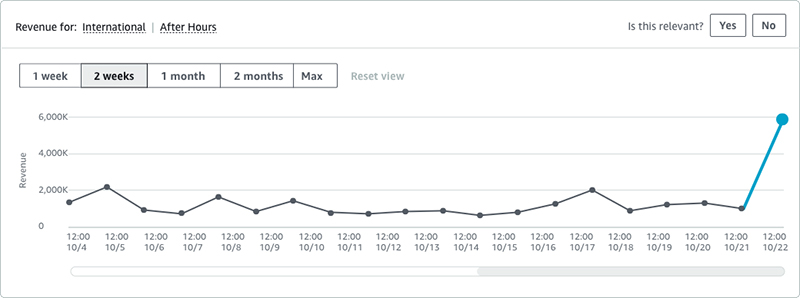
For example, we quickly found the following very interesting example with one of our customers. We were tracking voice revenue as the measure, under the dimensions of call type (on-net, off-net, roaming), region (a high-level concept of an area, such as a province or big city), and timeband (after hours, business hours, weekends)
Amazon Lookout for Metrics identified an anomaly on international calls in a certain region, as shown in the following graph.
We quickly went to our source data, and saw the following visualization.
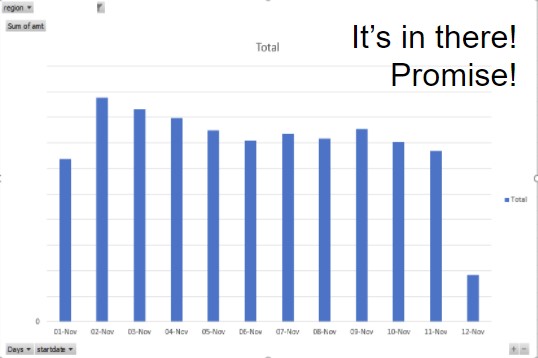
This graph looks at the total revenue for the days for international calls. As you can see, when looking at the global revenue, there is no real impact of the sort that Amazon Lookout for Metrics identified.
But when looking at the specific region that was identified, you see the following anomaly.
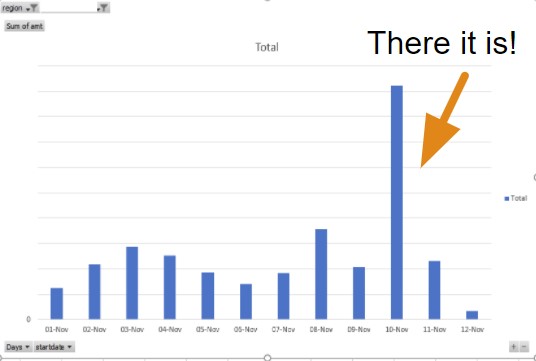
A clear spike in international calls took place on this day, in this region. We looked deeper into it and found that the specific city identified by this region is known as a tourist and conference destination. This begs the question: is there any business value to be found in an insight such as this? Can we react to anomalies like these in real time by using Amazon Lookout for Metrics and then providing specific pricing specials on international calls in the region, in order to take advantage of the influx of demand? The answer is yes, and we are! With stakeholders alerted to these notifications for future events and with exploratory efforts into our recent history, we’re prepared for future issues and are becoming more aware of operational gaps in our past.
In addition to the exploration using the back testing feature (which is still ongoing as of this writing), we also set up real-time detectors to work in parallel with our existing anomaly detection service.
Within two days, we found our first real operational issue, as shown in the following graph.
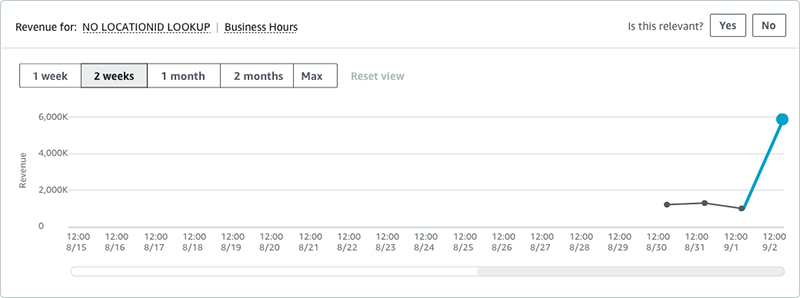
The graph shows revenue attributed to voice calls in another customer. In this case, we had a clear spike in our catchall NO LOCATION LOOKUP region. We map revenue from the towers to regions (such as city, province, or state) using a mapping table that we periodically refresh from within the MNO network, or by receiving such a mapping from the MNO themselves. When a tower isn’t mapped correctly by this table, it shows up as this catchall region in our data. In this case, there was a problem with the mapping feed from our customer.
The effect was that the number of towers that could not be classified was slowly growing. This could affect our pricing models, which could become less accurate at factoring the location aspect when generating the optimal price.
A very important operational anomaly to detect early!
Digitata in the future
We’re constantly evolving our ML and analytics capabilities, with the end goal of making connectivity more affordable for the entire globe. As we continue on this journey, we look to services such as Amazon Lookout for Metrics to help us ensure the quality of our services, find operational issues, and identify opportunities. It has made a dramatic difference in our anomaly detection capabilities, and has pointed us to some previously undiscovered opportunities. This all allows us to work on what really matters: getting everyone connected to the wonder of the internet at affordable prices!
Getting started
Amazon Lookout for Metrics is now available in preview in US East (N. Virginia), US East (Ohio), US West (Oregon), Asia Pacific (Tokyo), and Europe (Ireland). You can learn more about how Amazon Lookout for Metrics works in this blog post. Request preview access to get started today!
You can interact with the service using the AWS Management Console, the AWS SDKs, and the AWS Command Line Interface (AWS CLI). For more information, see the Amazon Lookout for Metrics Developer Guide.
About the Authors
Nico Kruger is the CTO of Digitata and is a fan of programming computers, reading things, listening to music, and playing games. Nico has 10+ years experience in telco. In his own words: “From C++ to Javascript, AWS to on-prem, as long as the tool is fit for the job, it works and the customer is happy; it’s all good. Automate all the things, plan for failure and be adaptable and everybody wins.”
Chris King is a Senior Solutions Architect in Applied AI with AWS. He has a special interest in launching AI services and helped grow and build Amazon Personalize and Amazon Forecast before focusing on Amazon Lookout for Metrics. In his spare time, he enjoys cooking, reading, boxing, and building models to predict the outcome of combat sports.