Artificial Intelligence
Understand drivers that influence your forecasts with explainability impact scores in Amazon Forecast
We’re excited to launch explainability impact scores in Amazon Forecast, which help you understand the factors that impact your forecasts for specific items and time durations of interest. Forecast is a managed service for developers that uses machine learning (ML) to generate more accurate demand forecasts, without requiring any ML experience. To increase forecast model accuracy, you can add additional information or attributes such as price, promotion, category details, holidays, or weather information to your forecasting model, but you may not know how each attribute influences your forecast. With today’s launch, you can now understand how each attribute impacts your forecasted values using the explainability feature, which we discuss in this post.
ML-based forecasting models, which are more accurate than heuristic rules or human judgment, can drive significant improvement in revenue and customer experience. However, business leaders often lose trust in technology when they see forecasted numbers drastically differing from their intuition, and may find it hard to trust ML systems. Because demand planning decisions have a high impact on the business, business leaders may end up overriding forecasts because they may believe that they have to take the forecast model predictions at face value to make critical business decisions, without understanding why those forecasts were generated and what factors are influencing forecasts to be higher or lower. This can lead to compromising forecast accuracy, and you may lose the benefit of ML forecasting.
Amazon Forecast now provides explainability, which gives you item-level insights across your preferred time duration. Having a certain level of understanding on why a particular forecast value is high or low at a particular time is helpful for decision-making and building trust and confidence in your ML solutions. Explainability reports include impact scores, which help you understand how each attribute in your training data contributes to either increasing or decreasing your forecasted values for specific items. In addition, you can choose to understand explainability for your entire forecast horizon or for specific time durations. Explainability removes the need of running multiple manual analyses to understand past sales and external variable trends to explain forecast results.
How to interpret explainability impact scores
Explainability helps you better understand how the attributes, such as price, category, or holidays, in your datasets impact your forecast values. Forecast uses a metric called impact scores to quantify the relative impact of each attribute and determine whether they generally increase or decrease forecast values.
Impact scores measure the relative impact attributes have on forecast values. For example, if the price attribute has an impact score that is twice as large as the brand_id attribute, you can conclude that the price of an item has twice the impact on forecast values than the product brand. Impact scores also provide information on whether an attribute increases or decreases the forecasted value. A negative impact score reflects that the attribute tends to decrease the value of the forecast.
Impact scores measure the relative impact of attributes to each other, not the absolute impact. If an attribute has a low impact score, that doesn’t necessarily mean that it has a low impact on forecast values; it means that it has a lower impact on forecast values than other attributes used by the predictor. If you change attributes in your predictor, the impact scores may differ, and the attribute with the low impact score may have a higher score relative to other attributes. Also, you can’t use impact scores to determine whether particular attributes improve the model accuracy or not. You should use accuracy metrics such as weighted quantile loss and others provided by Forecast to access predictor accuracy.
In the following graph, we take an example of an explainability report graph that shows the relative impact of different attributes on the forecasted value of item_d 1 across all the time points in the forecast horizon. We see that the relative impact is in the following order: Price has the highest impact, followed by StoreLocation, then Promo and Holiday_US. Price has the highest influence item_id 1 and tends to increase the forecast value. StoreLocation has the second highest impact on item_id 1 but tends to decrease the forecast value. Because Promo is close to 0.2 impact score, Price has five times more impact than Promo on the forecasted value of item_id 1, and both attributes tend to increase the forecast value. Holiday_US has an impact score of 0, which means that this attribute doesn’t increase or decrease the forecast value for item_id 1 relative to other attributes.

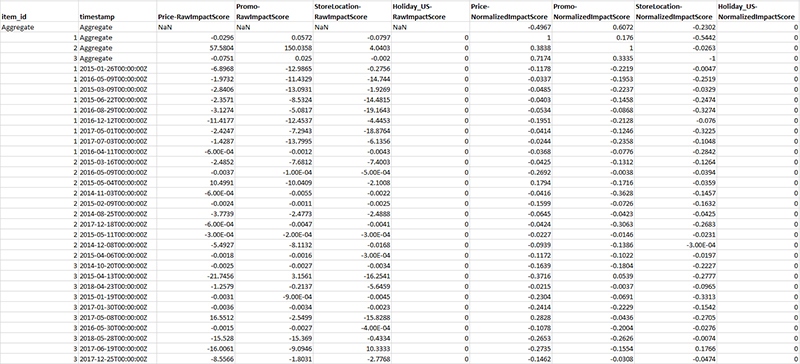
The following image shows an example of the explainability report export file with the impact scores for specific time series and time points as well as aggregated scores across those time series and time points.
Generate explainability impact scores
In this section, we walk through how to generate explainability impact scores for your forecasts using the Forecast console. To use the new CreateExplainability API, refer to the notebook in our GitHub repo or review Forecast Explainability.
- On the Forecast console, create a dataset group. Upload your historical demand dataset as target time series followed by related time series or item metadata that you want to use for more accurate forecasting and for which you’re interested in seeing explainability impact scores.
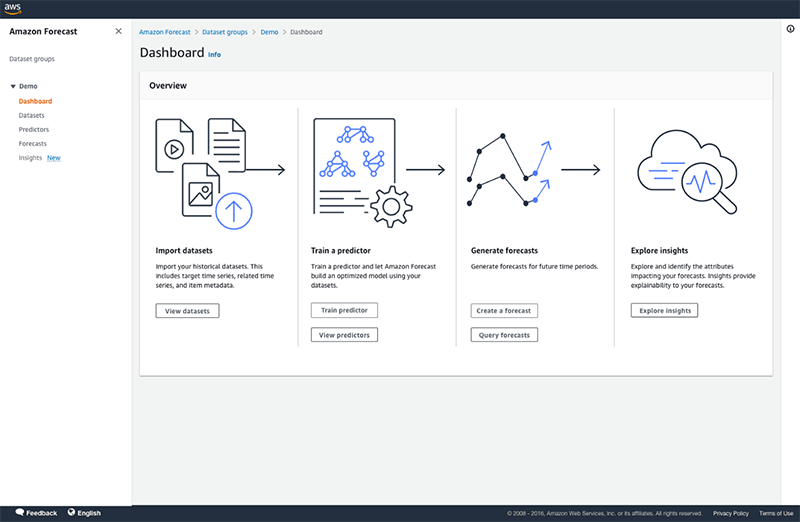
- In the navigation pane, under your dataset, choose Predictors.
- Choose Train new predictor.
Forecast defaults to AutoPredictor as the default training option. No further action is needed from you, but remember that only forecasts generated from a model that has been trained with AutoPredictor are eligible for later generating explainability impact scores for specific forecasts.
- Now that your model is trained, choose Forecasts in the navigation pane.
- Choose Create a forecast.
- Select your trained predictor to create a forecast.
- Choose Insights in the navigation pane.
- Choose Create explainability.

- Choose the forecast that you want to generate explainability impact scores for.
- Choose if you want to see impact scores for all the time points in the forecast horizon or only for a specific time duration.
You can specify up to 500 consecutive time points per explainability report.

- Upload the list of specific time series for which you want to see explainability impact scores.
A time series is a unique combination of item ID and dimension. You can specify up to 50 time series per Forecast explainability.

- Specify the schema of the CSV file that you have uploaded.
- Choose Create explainability.

It takes less than an hour to generate the explainability impact scores.
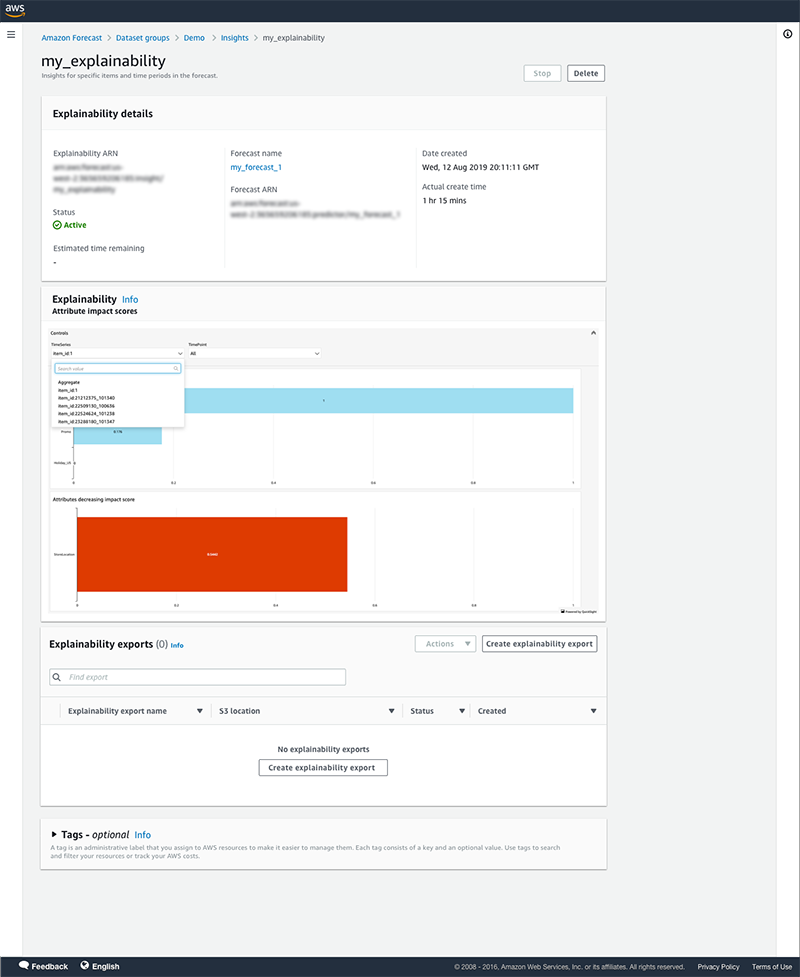
- When the job status is active, choose the explainability job to view the impact score.

Here you can review the explainability impact score graph. You can use the controls at the top of the graph to drill down to specific time series or time points or view at an aggregated level.
- To export all the impact scores, choose Create explainability export in the Explainability exports
- Provide the export details and choose Create explainability export.

The export is saved in an Amazon Simple Storage Service (Amazon S3) bucket that you specify.
- When the export is complete, navigate to your S3 bucket to review the explainability report CSV file.

The following is an example of your explainability export CSV file. Depending on how large your dataset is, multiple files may be exported.
Aggregate explainability impact scores for category level analysis
You may want to review explainability for a group of items together, which can have more than 50 items. For example, a grocery retailer might be interested in understanding what is driving the forecasts for all their fruits and vegetables, and this category may consist of more than 50 SKUs in their data. However, Forecast lets you specify up to 50 time series per Forecast explainability job. If you have more than 50 time series, you need to run the explainability job multiple times with different items in each job and then combine them.
The explainability export file provides two type of impact scores: normalized impact scores and raw impact scores. Raw impact scores are based on Shapley values and aren’t scaled or bounded. Normalized impact scores scale the raw scores to a value between -1 and 1. Raw impact scores are useful for combining and comparing scores across different explainability resources. Use the raw impact scores of all the time series across multiple explainability jobs to aggregate, then compare it to find the relative influence of each attribute. You can view an example on how to do so by following the notebook in our GitHub repo.
Conclusion
Forecast now provides explainability for specific items and time durations of interest. With the explainability feature, you can understand how each attribute impacts your forecasted values. To learn more, review Forecast Explainability and the notebook in our GitHub repo. If you are interested in aggregated explainability for all your items at the predictor level, review our blog on using the CreateAutoPredictor API here. Explainability is available in all Regions where Forecast is publicly available. For more information about Region availability, see AWS Regional Services.
About the Authors
 Namita Das is a Sr. Product Manager for Amazon Forecast. Her current focus is to democratize machine learning by building no-code/low-code ML services. On the side, she frequently advises startups and loves training her dog with new tricks.
 Dima Fayyad is a Software Development Engineer on the Amazon Forecast team. She is passionate about machine learning and AI and is currently working on large-scale distributed systems in the forecasting space. In her free time, she enjoys exploring different cuisines, traveling, and skiing.
 Youngsuk Park is a Machine Learning Scientist at AWS AI and Amazon Forecast. His research lies in the interplay between machine learning, optimization, and decision-making, with over 10 publications in top-notch ML/AI venues. Before joining AWS, he obtained a PhD from Stanford University.
 Shannon Killingsworth is a UX Designer for Amazon Forecast. His current work is creating console experiences that are usable by anyone, and integrating new features into the console experience. In his spare time, he is a fitness and automobile enthusiast.