Front-End Web & Mobile
Supply Chain Automation using IoT and Location-Based Services
Keeping track of distributed assets across facilities and geographic locations is cumbersome. Businesses use various applications and approaches to maintain and manage asset lifecycles, which can get complex and tedious.
This post will teach you a moderation approach using AWS IoT Core and Amazon Location Service (Amazon Location).
To build the solution, you’ll utilize an example scenario that tracks the vehicles shipped from the manufacturer’s location to the dealers across the country. Once the car reaches the allotted dealer location, it will notify the dealer contact through email and update the vehicle status, location, and inventory. The information connects to a dashboard for stakeholders and business users to acquire operational insights and boost performance.
Solution
The following elements make up our solution:
- An IoT event simulator creates and transmits location (latitude, longitude) telemetry every few seconds to AWS IoT Core.
- AWS Lambda, a serverless on-demand function, validates incoming telemetry, updates the vehicle’s status, persists data in the storage layer, and delivers them to Amazon Location.
- Amazon Location evaluates the telemetry and sends it to Lambda in case of a breach using Amazon EventBridge.
- The Lambda function locates dealers, gets user notification preferences, and delivers email using Amazon Simple Email Service (SES).
- Finally, Amazon QuickSight is used to build the analytics and visualization dashboard.
- Using Amazon Aurora (PostgreSQL Edition), we have built a static dataset for dealer information, car profile, and manufacturer information.
- Events like vehicle status changes, geofence breaches, and position telemetry are also recorded.
- AWS Secret Manager stores secrets like database credentials.
- Amazon CloudWatch provides monitoring and observability.
As mentioned earlier, the following diagram illustrates the system design.
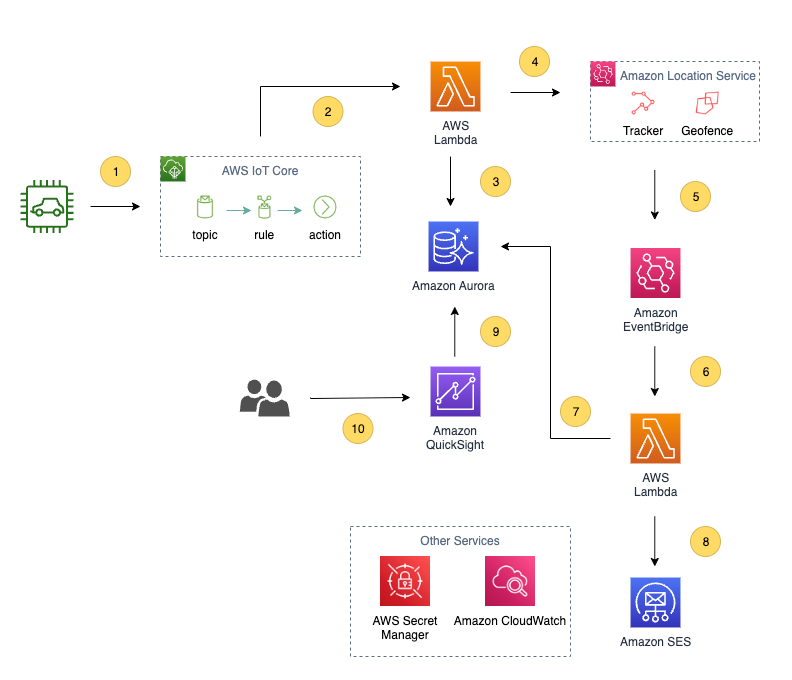
Figure 1. Architecture Diagram of the solution
The steps in the diagram are explained below.
- Telemetry transmitted from moving assets to AWS IoT Core.
- IoT Core forwards that events to AWS Lambda.
- Lambda verifies and saves the data.
- Lambda forwards the event to Amazon Location for evaluation.
- Amazon Location route the event to Amazon EventBridge if breach identified.
- EventBridge delivers the message to Lambda.
- Lambda identifies the geofence and collects the dealer notification information.
- Email notification sent to dealer with vehicle status.
- Dashboards are created in Amazon QuickSight using the data from Amazon Aurora.
- Users access the Analysis from QuickSight.
The following are the main tasks performed by the solution’s components.
Data preparation
A tracker is an Amazon Location resource that receives location updates from devices. The tracker provides support for location queries, such as current and historic device location. You must construct a set of geofences to represent the dealership locations and associate them to tracker. When a tracker resource is linked to a geofence collection, all the location updates sent to it will be automatically evaluated against all geofences in the linked collection.
IoT simulator
The approach will use an AWS Lambda function to simulate a device transmitting its location to AWS IoT Core. The data publishes JSON-formatted messages to IoT Core. In a real-world scenario, the physical device would take the place of the simulator and connect to IoT Core directly and securely.
Data routing
The Rules Engine, a component of AWS IoT Core, is used to set up an IoT Rule that continuously evaluates incoming messages and sends them to the destination for further processing. Lambda as our IoT Rule processing destination.
Data validation and storage
The event from IoT Core is processed using Lambda to ensure that the vehicle identification in the telemetry matches the information in the database and updates the vehicle status to In Transit. The events are then sent to Amazon Location.
Geofence breach processing
Amazon Location continuously evaluates the vehicle’s location against the geofence collection and generates the ENTER and EXIT events if the vehicle enters or exits the geofence. These events are then sent to Lambda using EventBridge, a scalable serverless event bus. Lambda will carry out the following tasks:
- Obtain the relevant dealer’s information and notification preferences from their profile using the geofence identifier in the event.
- Confirm delivery status to the designated dealership and updates the status to Arrived at dealer.
- Uses Amazon SES to send an email to the dealer letting them know the car has arrived. It also identifies and records potential dealer swaps if the vehicle doesn’t match the location.
Data visualization
Amazon QuickSight, a serverless business intelligence (BI) service, is used to create interactive dashboards. It also seamlessly integrates into Software-as-a-Service (SaaS) and web applications. We have provided instructions for creating sample dashboards for vehicle inventory, vehicle statuses, current vehicle position, geofence breach events, and vehicle transit paths.
Prerequisites
Confirm you have the following prerequisites.
- An active AWS account.
- Sign up for a QuickSight subscription here. Visit AWS QuickSight Pricing for further details on pricing.
Deployment
This section outlines the steps for deploying the solution.
Set up resources using CloudFormation.
The following resources are created and deployed using the AWS CloudFormation stack:
- Amazon Virtual Private Cloud (Amazon VPC) with Public and Private Subnets and NAT/Internet Gateway.
- Aurora Serverless PostgreSQL-Compatible database.
- IoT Core rule.
- Three Lambda functions.
- Amazon Location resources, including a tracker and geofence collection.
- EventBridge rule.
- Amazon SES Identity.
- Secret in AWS Secret Manager.
To Launch the stack, click ![]() and input the email address you want to receive notifications. Check the boxes acknowledging AWS Identity and Access management (IAM) creation and auto-expand, then select Create Stack. Visit this GitHub repo for the code artifacts.
and input the email address you want to receive notifications. Check the boxes acknowledging AWS Identity and Access management (IAM) creation and auto-expand, then select Create Stack. Visit this GitHub repo for the code artifacts.
Wait until the stack completes, then copy the SecretARN value from the DBCluster CloudFormation outputs tab. You’ll need that in the next step.
Load sample data into the database instance
In our previous step, we created a database instance using CloudFormation. You’ll utilize the Query Editor feature in the Amazon RDS Console to load data into the database.
- Navigate to the Amazon RDS console and select Query Editor on the left-hand side.
- Under the Database instance or cluster dropdown, select supplychaincluster.
- Select Connect with a Secrets Manager ARN for Username.
- Paste the Secrets Manager ARN from the CloudFormation Outputs tab found in the previous step.
- Enter vcsmaster for the database name, then select Connect.
- Download db_scripts.sql from GitHub and open it using a text editor.
- Copy the contents of the file into Query Editor, then select Run.
- It will take a few minutes to load the data into the database.
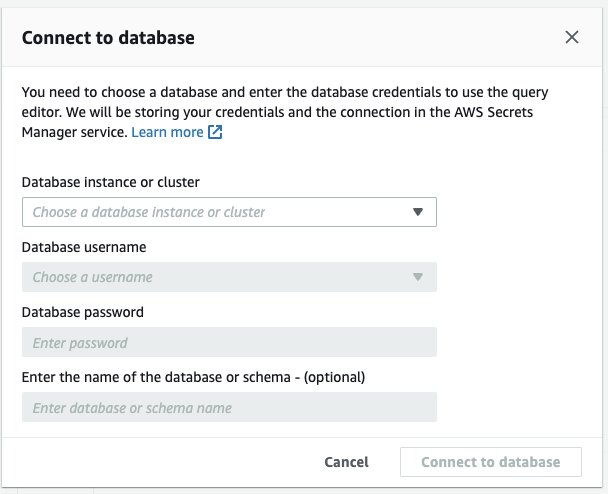
Figure 2. Connect to database from console
Database model
The following table enumerates the imported tables into the database.

Configuring Amazon Location Service geofences
Amazon Location geofence collections can import geofences defined using a standard geospatial data format called GeoJSON (RFC 7946). You can create geofences graphically using complementary tooling like geojson.io and save the generated GeoJSON file. Import the two GeoJSON provided within the geofences folder, within this post’s code repository.
- Navigate to the Amazon Location Services console and select Geofences collections.
- Select collection-01 and choose add Geofence.
- Click Browse files and select the files you downloaded and choose Add geofences.
Invoking IoT Simulator
The solution provides AWS Lambda functions that simplify simulating the moving vehicles. To invoke this feature:
- Navigate to the Lambda console.
- Choose the vcs-iot-simulator function and then select the Test button.
- The console will prompt you to enter a test event. You can choose Save after giving it a name by leaving the remaining to defaults.
- Next, choose Test, and the IoT simulator will launch. The process of creating and posting events takes around five minutes.
Setup QuickSight
- Since your database resides inside an Amazon VPC, we must make sure that QuickSight has access before configuring the data source. For more information, see Connecting to a VPC with Amazon QuickSight. Utilizing the login information kept in Secrets Manager, follow the steps to Create a dataset from the database. While following the steps to create a dataset, choose the Custom SQL option instead of tables and use the query mentioned in the following table.
- Creating a dataset also creates a data source component. You can add more datasets using the same data source.
- To create a dataset from an existing source, select the New dataset, and pick the data source from the Existing Data Source sections. Repeat the process for each listed dataset. The Analysis section will require them.
QuickSight allows users to write the queries required for Analysis directly. For simplicity, use the views produced in Amazon Aurora.

Creating analysis
- On the QuickSight home page, select New Analysis. Next, choose vehicle_details as the dataset and select Create Analysis to produce a visual automatically. You can add as many charts and datasets as necessary, which you’ll do in the following steps.
- To add more datasets, select the pen icon in the top left corner and choose Add Dataset. Select from the list available, repeating the process prescribed previously.
- Click the plus sign to add an extra sheet, and rename the sheets to Vehicle Inventory and Vehicle Status.
Creating visuals
You will now add other charts to our analysis. There are four steps in the process:
- Select +ADD in the upper left corner and then select Add visual.
- Choose a dataset.
- Select a Visual Type from the blade on the left-hand side.
- Set filter options using Field wells.
Follow these directions to add the charts listed in the table below. Add visuals one through four on the Vehicle Inventory sheet and five through seven on the Vehicle Status sheet.

Details for the Field wells are provided as pictures below. Check out Using visual field controls for more information.
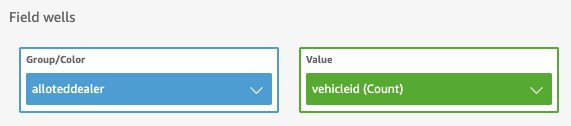
Field wells 1:
Add the field well options to get the vehicle count aggregated by dealer.
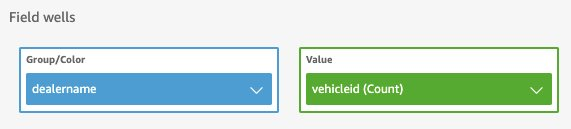
Field well configuration to get results by dealer
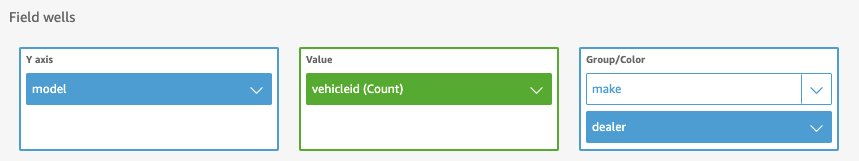
Field wells 2:
Add the field well options to get the vehicle count aggregated by make with filters for model and year.
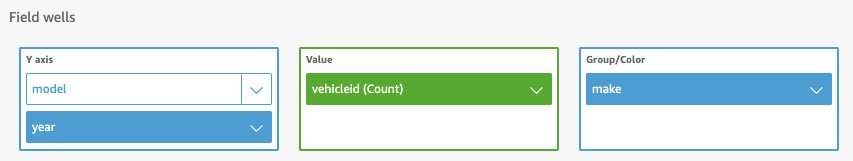
Field well configuration to get results by make and model
Field wells 3:
Add the field well options to get the vehicle count based on status.
Field well configuration to get results by vehicle’s status
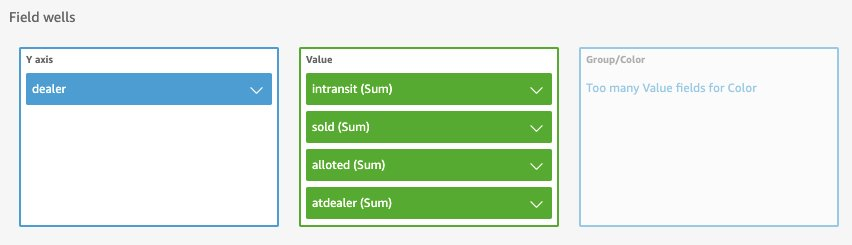
Field wells 4:
Add the field well option to get the vehicle count aggregated by dealer.
Field well configuration to get results by dealer’s available stock
Field wells 5:
Add the field well option to get the vehicle count aggregated by dealer.

Field well configuration to get results by vehicle’s transit status
Field wells 6:
Add the field well option to get the vehicle count aggregated by dealer.
Field well configuration to get results for vehicle inventory at dealer location
Field wells 7:
Add the field well option to get the vehicle count aggregated by dealer.

Field well configuration to get results for possible dealer trades
When finished, the visual for the Vehicle Stock Analysis will resemble this screen capture.
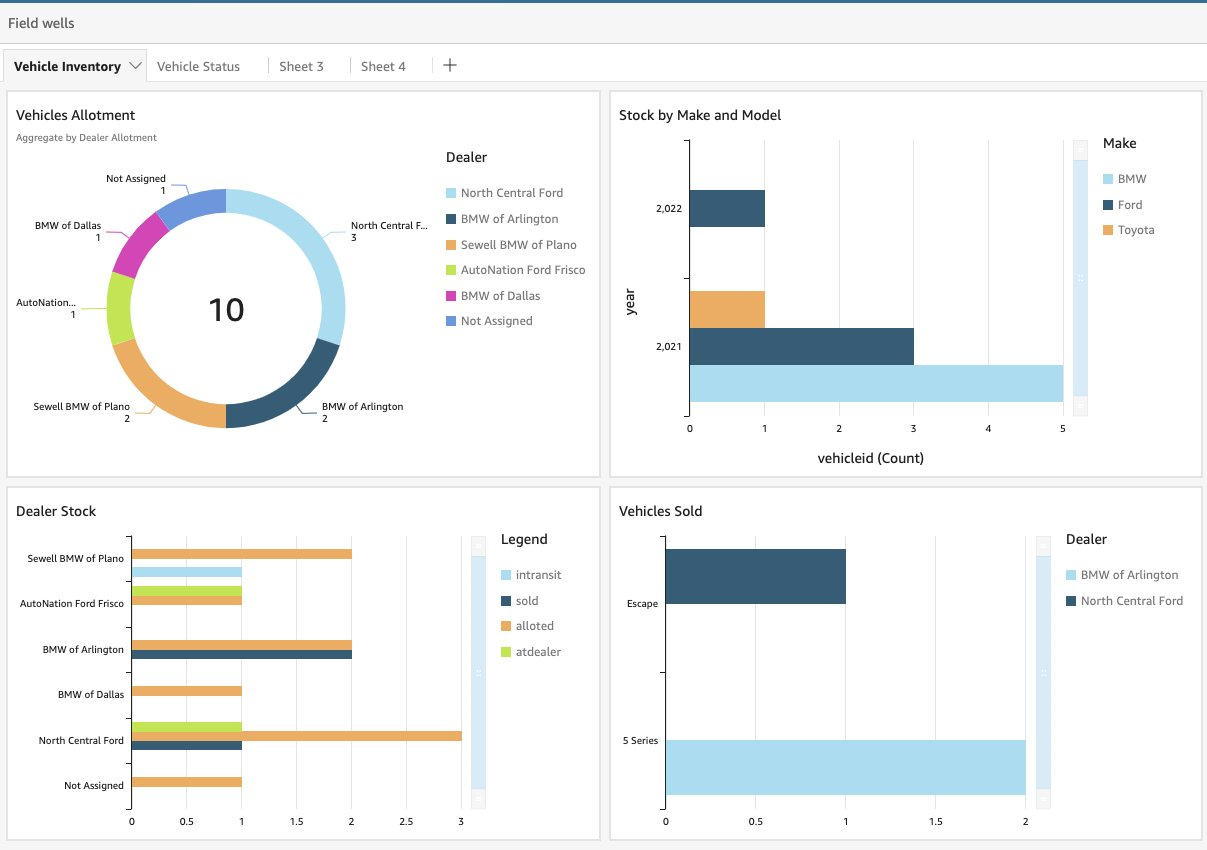
Figure 10. Vehicle Stock Analysis Dashboard
The visual for Vehicle Status Analysis will resemble this screen capture.
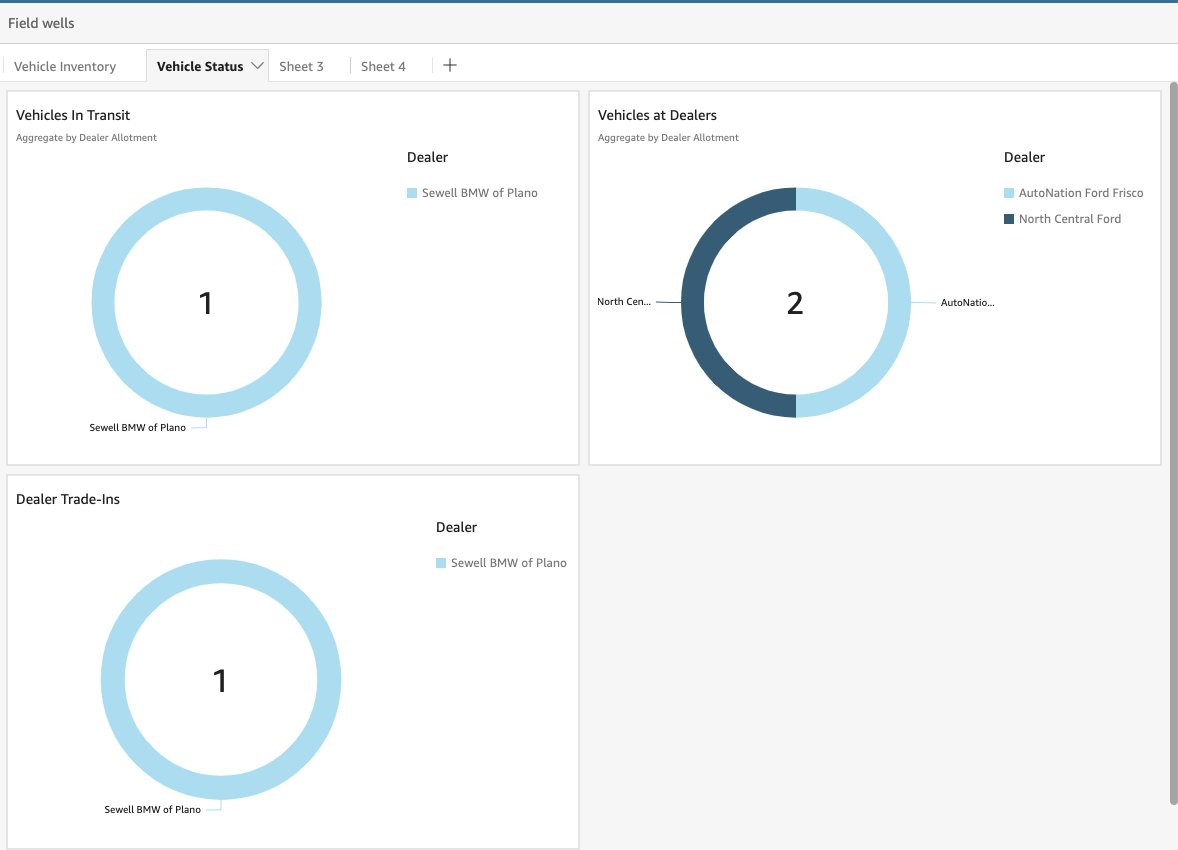
Figure 11. Vehicle Status Analysis Dashboard

Field wells 8:
Add the field well option to show the vehicle’s position based on geofence entry and exit events.
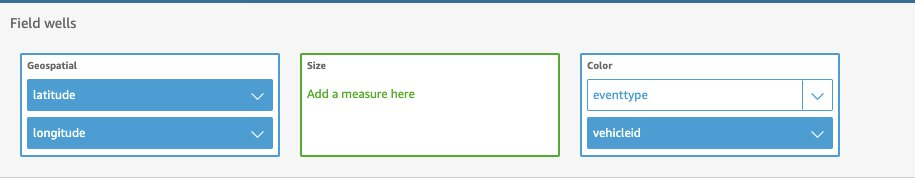
Field well configuration to display the geofence events
Field wells 9:
Add the field well option to show historical location events for the vehicles.
Field well configuration to display the geofence events
When finished, the visual for the geofence breach events will resemble this screen capture.
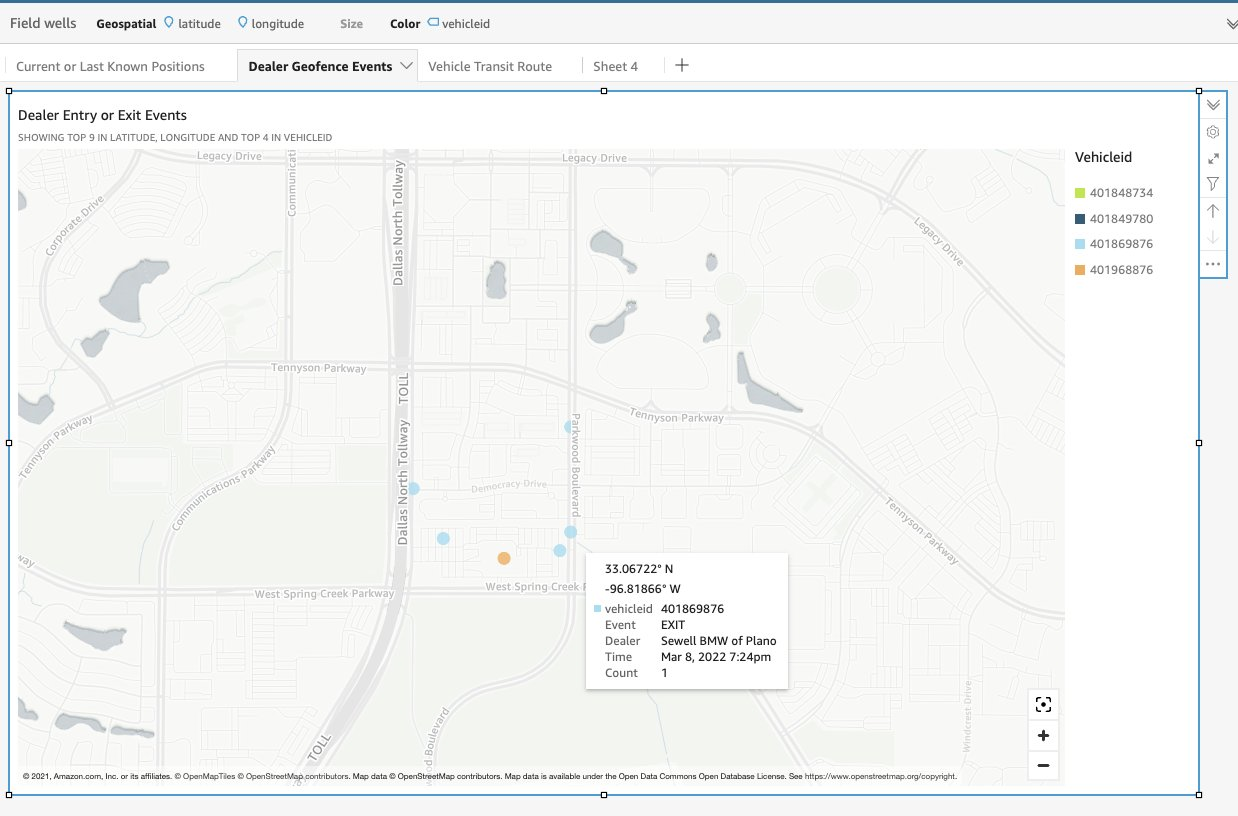
Figure 12. Geofence Events Dashboard
The visual for the vehicle transit history will resemble this screen capture.
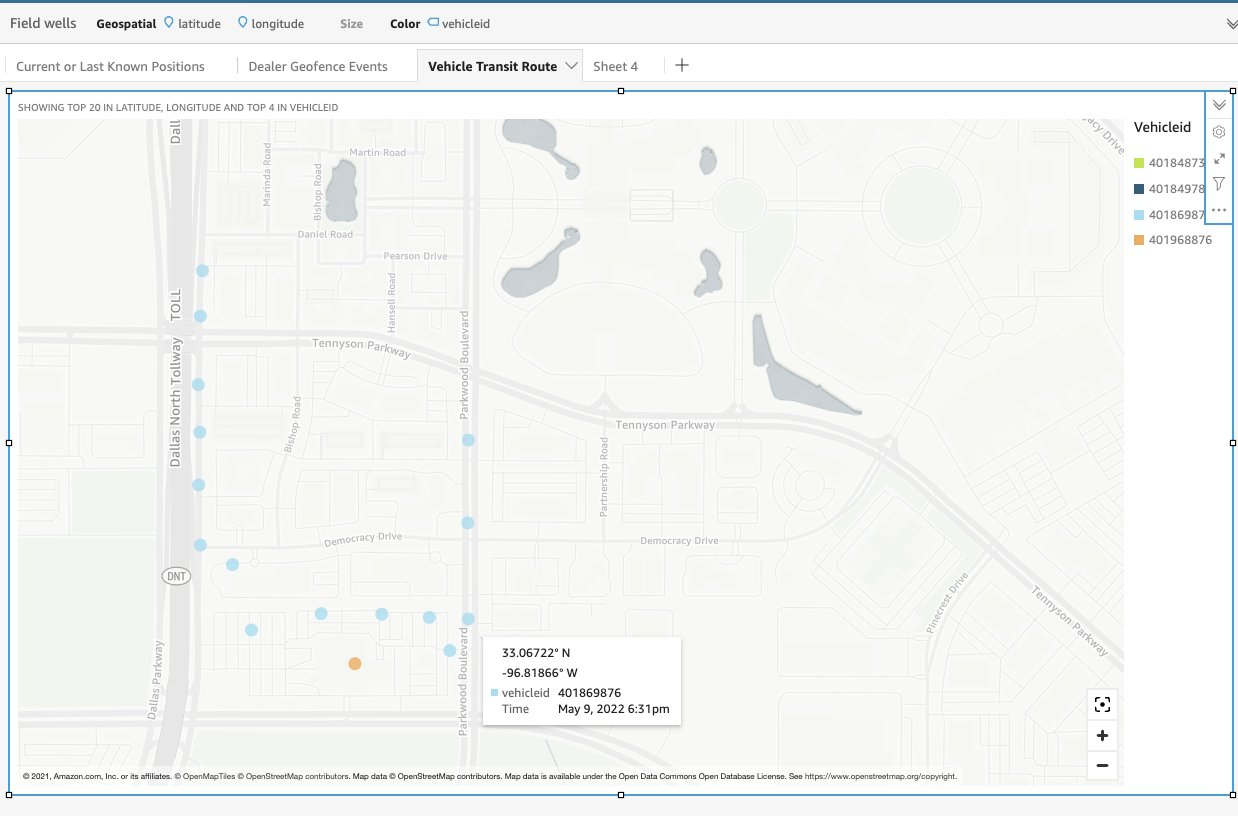
Figure 13. Location History Dashboard
Clean up
To prevent accruing additional charges in your AWS account, delete the resources you provisioned by navigating to the AWS CloudFormation console and deleting the SupplyChainAutomation stack. Follow Delete Amazon QuickSight subscription and the account instructions to clean up the QuickSight dashboard.
Conclusion
This post demonstrates how to create a near real-time tracking system, a live status update, and a different way to manage inventory for vehicles at dealerships. This solution can be applied to any moving assets and integrated into an inventory management system to update the stock levels in near real-time. The solution can be further enhanced to compute the travel time to the destinations, the length of time the vehicle spends on the lot before being sold, etc. See getting started with Amazon Location Service for additional information on how to create applications with geospatial functionality, including map viewing, geocoding, and reverse geocoding.
About the author: