Microsoft Workloads on AWS
How to view Azure costs using Amazon QuickSight
Optimizing your cloud costs is an ongoing process that starts with understanding your usage. Consistent monitoring provides valuable data to help you make both architectural and financial decisions that reduce your spend. Thousands of customers have successfully implemented the Cloud Intelligence Dashboards to track Amazon Web Services (AWS) usage with Amazon QuickSight. QuickSight is rich in features, allowing you to easily visualize data and surface insights, such as usage trends and anomalies. This provides opportunities for improvement and helps you achieve more while spending less.
Customers often seek to streamline their cloud financial management practices by using a common toolset. Many have asked whether it’s possible to view their Microsoft Azure costs using Amazon QuickSight.
In this blog post, we will introduce you to the Cloud Intelligence Dashboard for Azure, a solution that allows you to create Azure cost visualizations and reports using QuickSight’s intuitive drag-and-drop functionality. We’ll provide an overview of this solution, demonstrate how it works, and provide instructions so you can try it out in your own AWS account.
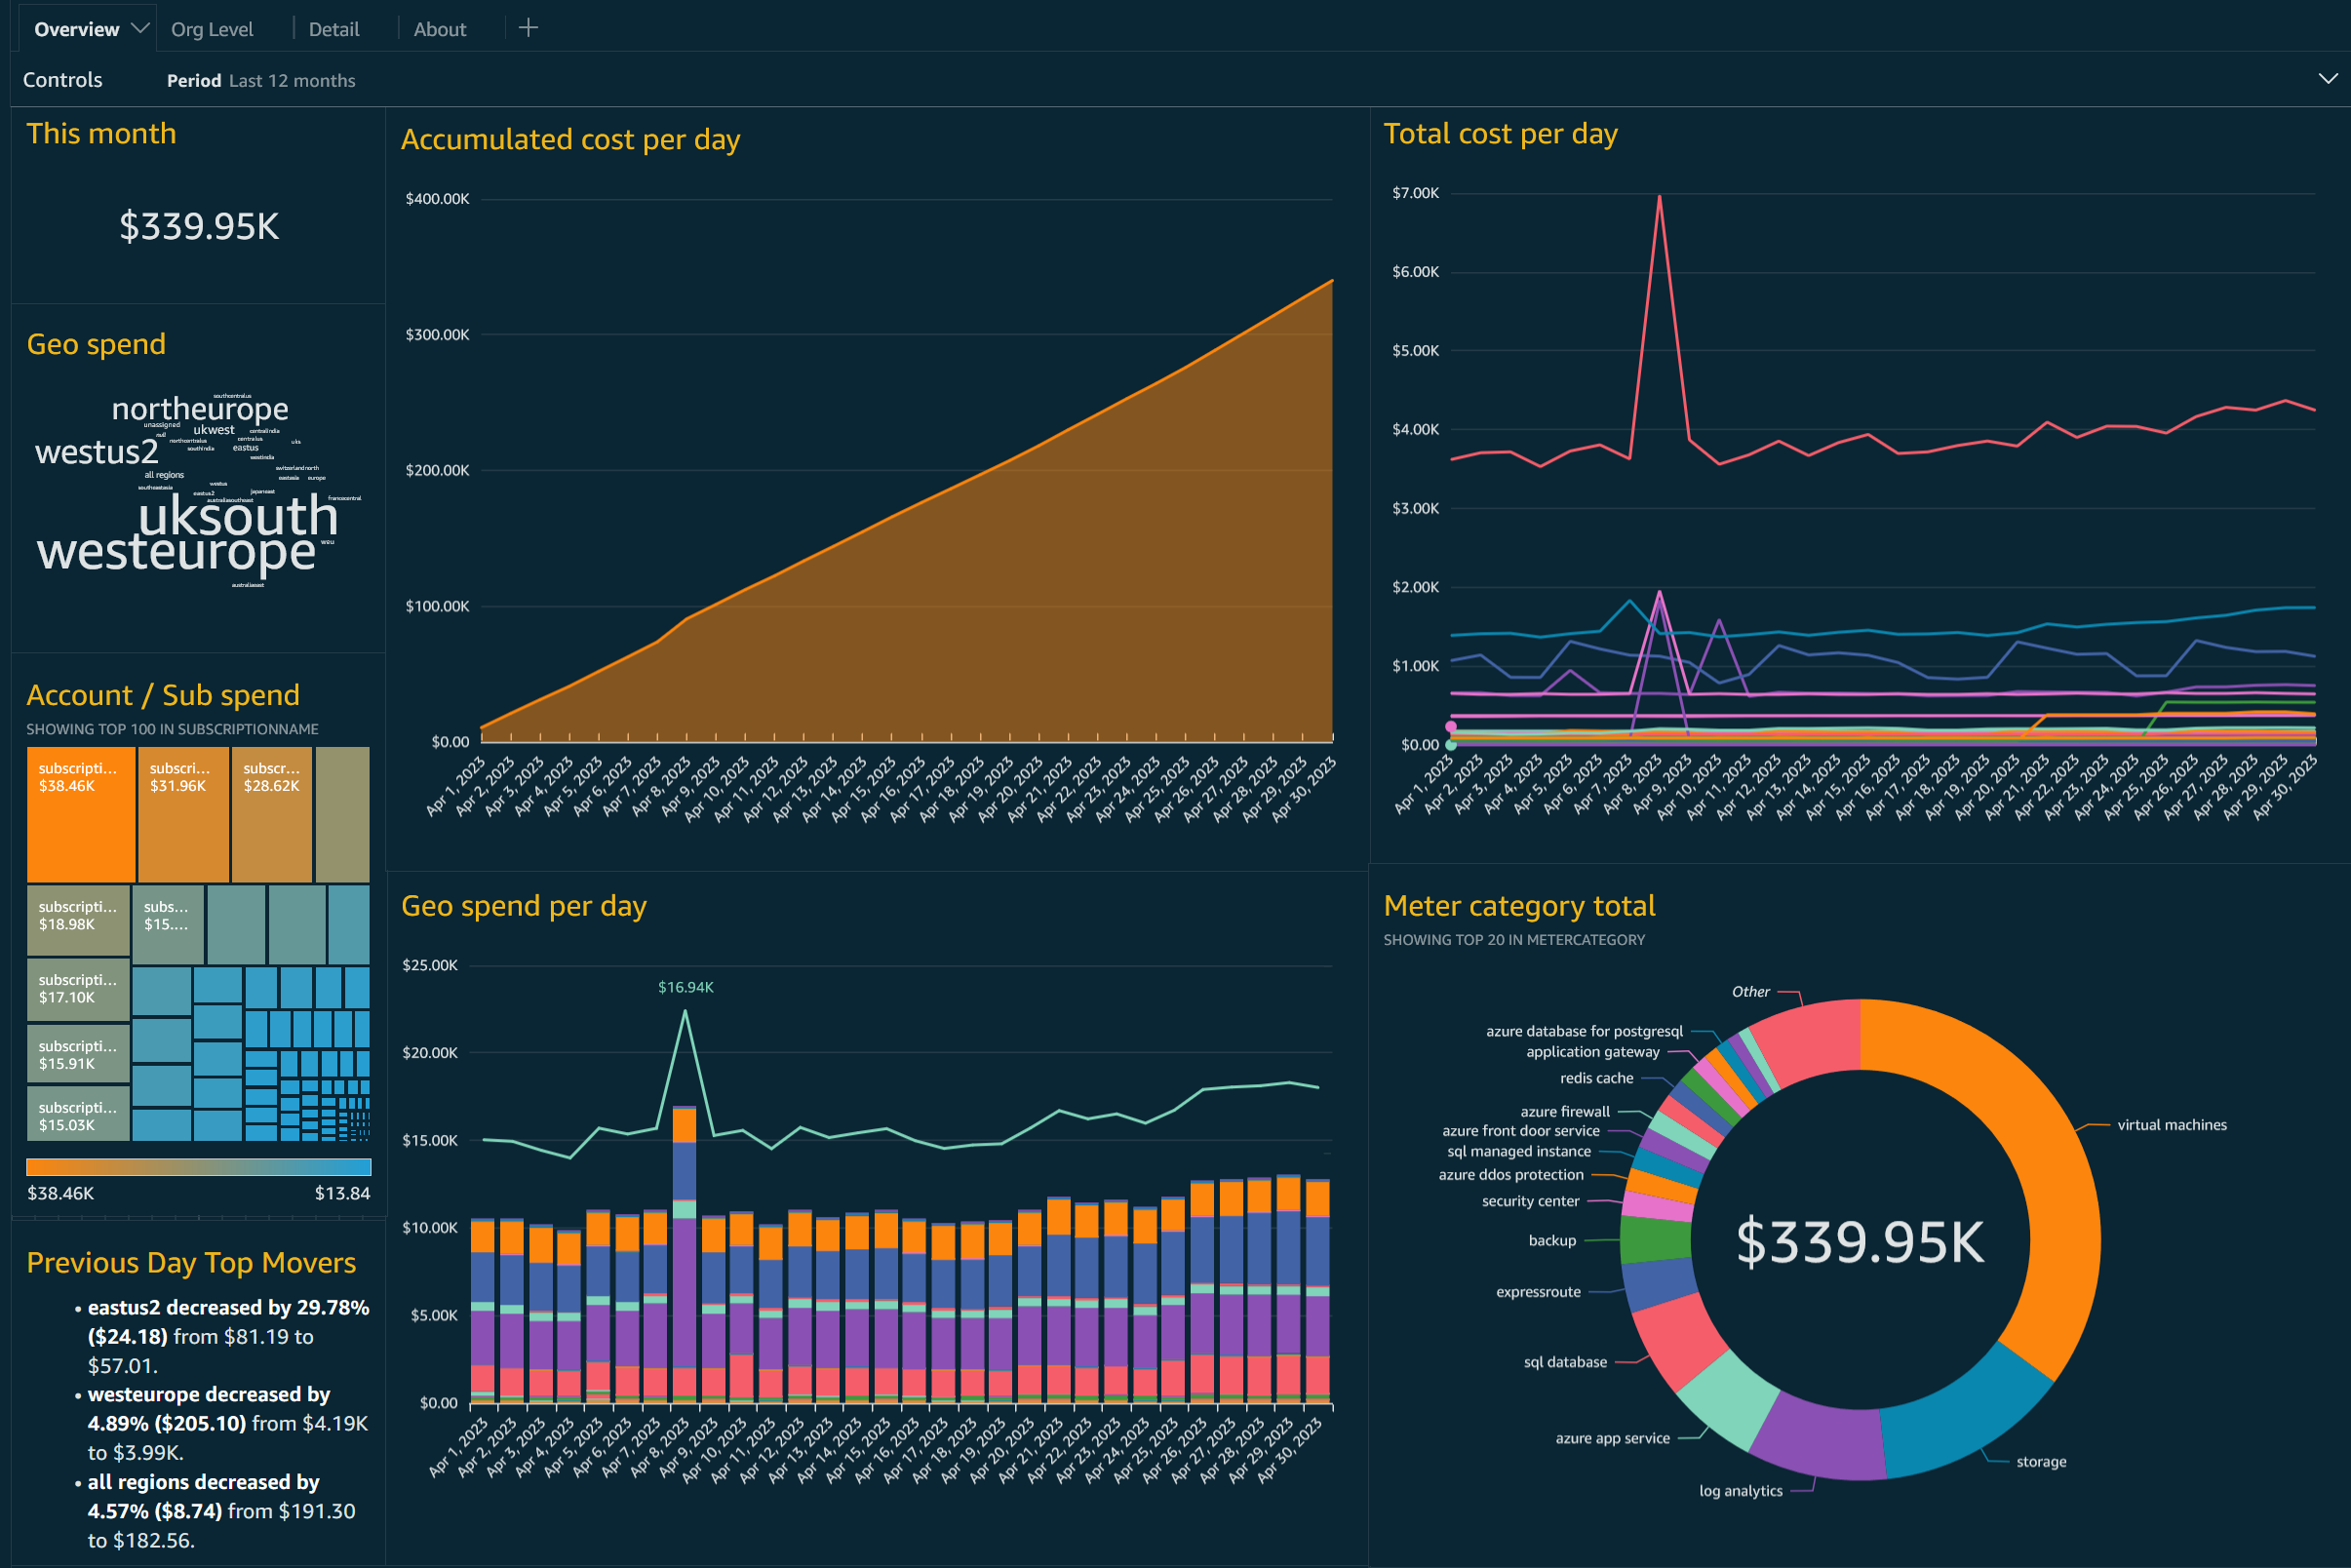
Figure 1: Cloud Intelligence Dashboard for Azure
To develop this solution, we worked closely with customers such as EMIS Health, who provides market leading healthcare software, information technology, and related services across the United Kingdom.
We use the Cloud Intelligence Dashboards often and wanted a similar view for our Azure usage. We worked with AWS to create a solution that allows us to view data from both cloud providers. This helps us identify issues quickly and maintain consistent reporting.
Neil Romatowski, Cloud Operations Manager, EMIS healthcare
Solution overview
The solution uses several AWS services as shown in Figure 2. Understanding their functions and interactions is key to customizing the setup to suit your needs.
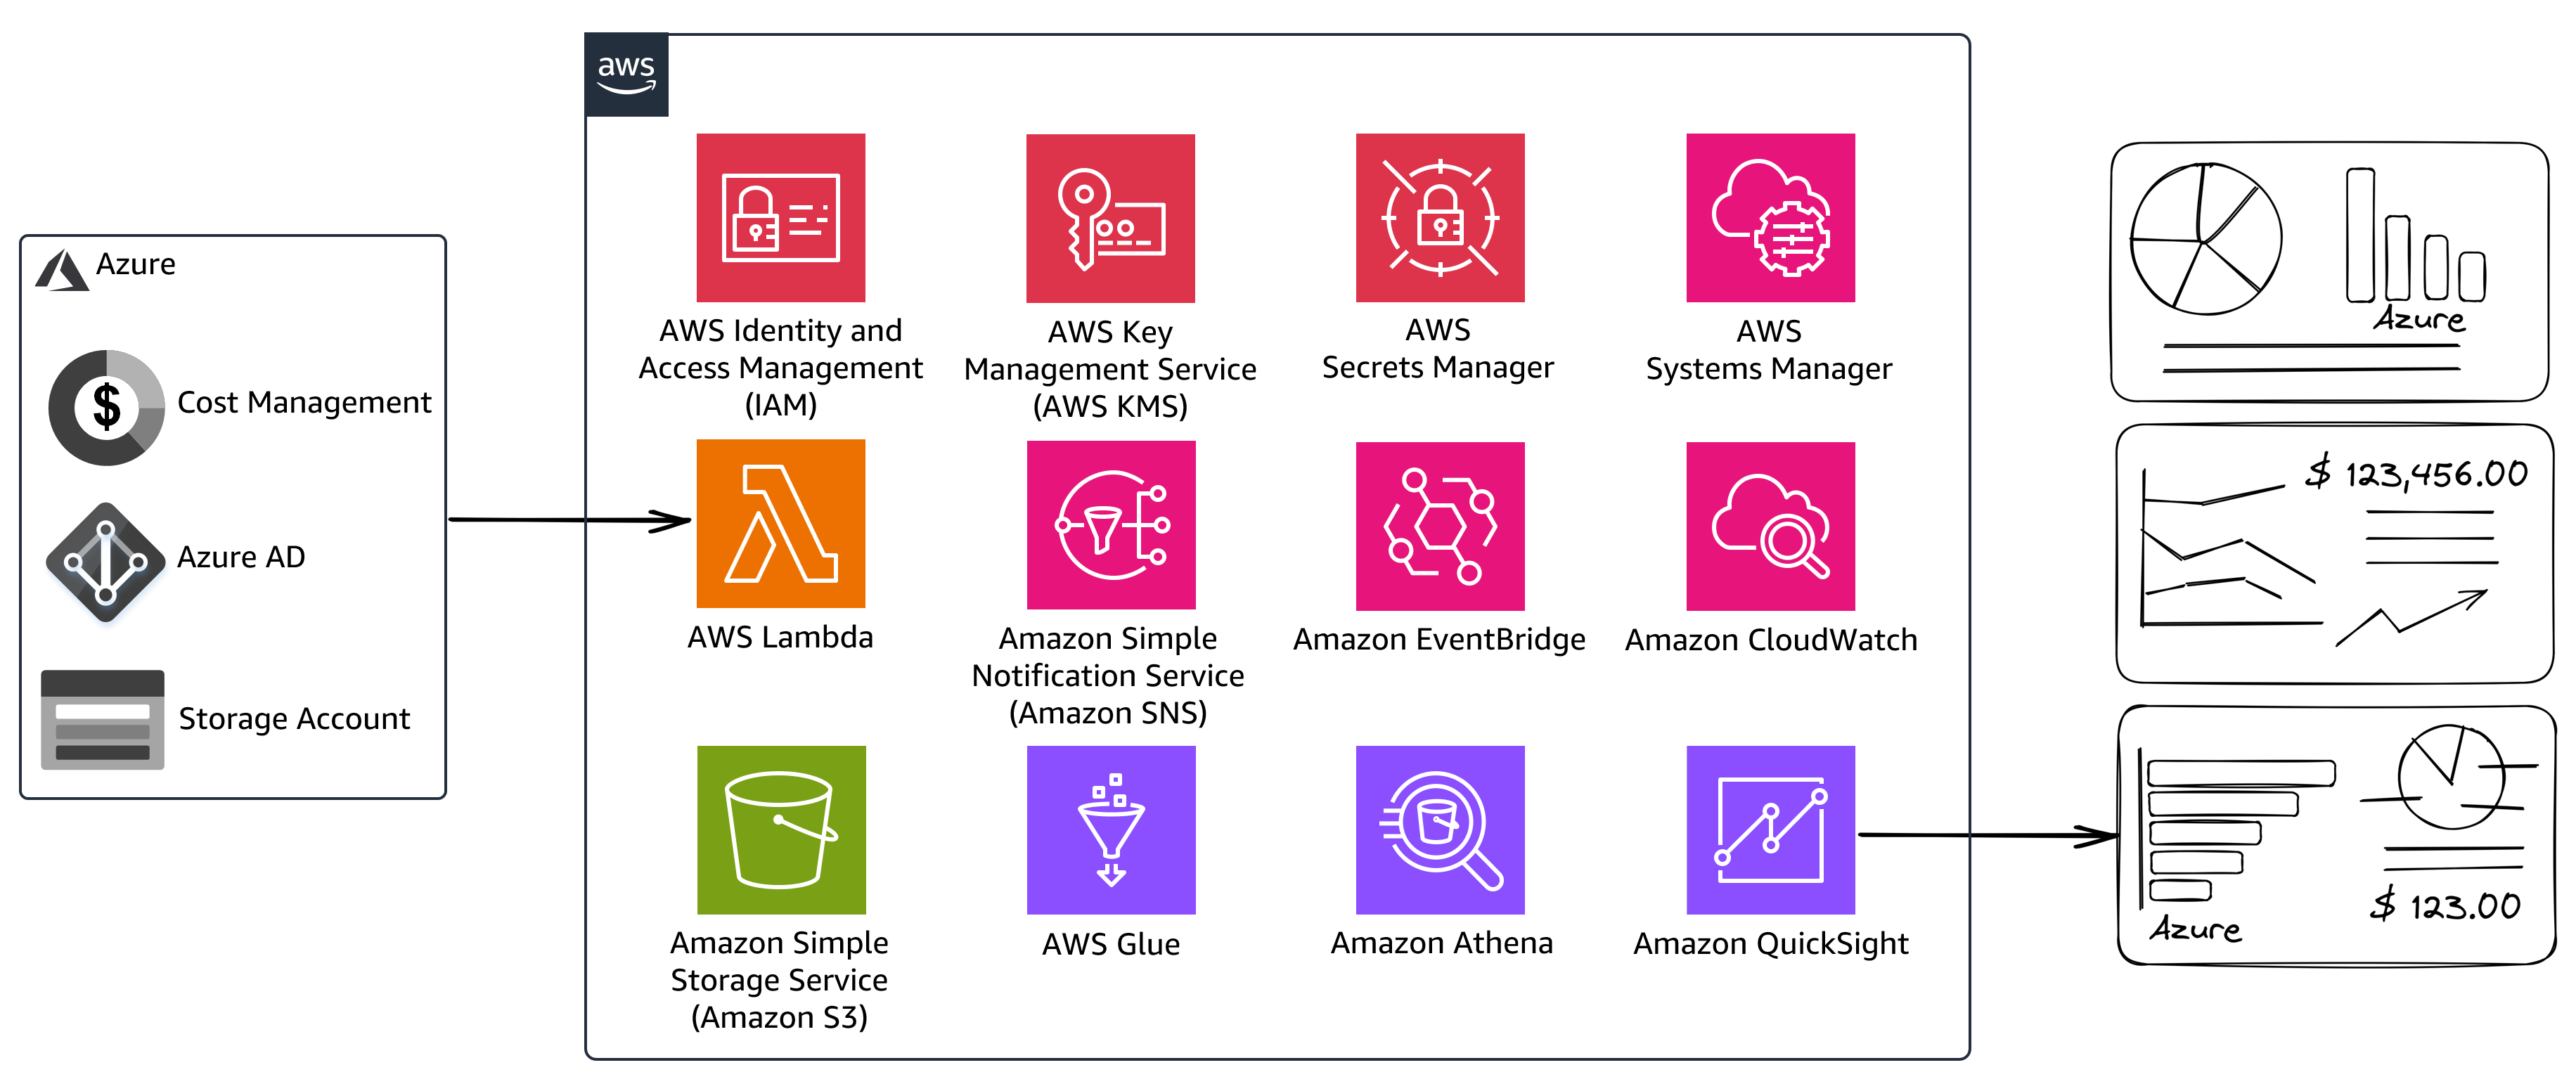
Figure 2: AWS Service Overview
Azure usage cost data is produced daily using a recurring task that automatically exports the data in CSV format to Azure Blob Storage.
This data is copied to Amazon Simple Storage Service (Amazon S3) by an AWS serverless application comprising AWS Lambda, Amazon EventBridge, and Amazon Simple Notification Service (Amazon SNS). For more information about the application and how it works, visit our blog post How to copy data from Azure Blob Storage to Amazon S3 using code.
The data contains the latest Azure month-to-date cost information. Before the data can be analyzed, it must be transformed. Data transformation includes converting data types, adding new columns, and deduplicating rows. For this, we use AWS Glue, a serverless data integration service. It simplifies the process by automating tasks to ensure efficient and consistent data transformation. The AWS Glue job consolidates all data manipulation activities. This centralization simplifies the overall workflow, making it easier to manage future changes.
The AWS Glue job is written in Python, which offers great flexibility for data transformation. For instance, in the Azure usage CSV files, all Azure tags are stored in one column. By using a Python function, we can separate this data into individual columns, allowing us to filter and analyze cost data using Azure tags.
CSV files are converted to Parquet, a binary, columnar storage format. This provides faster query speeds and better performance when compared to the tabular, plain text format of CSV files. The data structure is defined by an AWS Glue table. The original CSV files are retained to facilitate potential reprocessing, avoiding any additional Azure data egress charges. Once the AWS Glue job finishes, it produces a collection of Parquet files that are partitioned by month and updates the AWS Glue table schema.
When a CSV file cannot be processed, it is moved to an error folder for analysis. This prevents the daily pipeline from being blocked by one problematic file.
Amazon Athena reads the data. It leverages Presto, an open source, distributed SQL query engine, to process queries on the Parquet files stored in Amazon S3. Athena automatically determines the data schema based on the structure and content of the AWS Glue table. We process only the last six months of data and specific data fields required for the sample dashboard by default. These settings can be customized to suit your specific use case.
To speed up the dashboard rendering process, QuickSight uses SPICE (Super-fast, Parallel, In-memory Calculation Engine). It creates a dataset based on the Athena query, which is then used to build the QuickSight dashboard.
Figure 3 and Table 1 illustrate the interaction between AWS services and the communication between AWS and Azure.
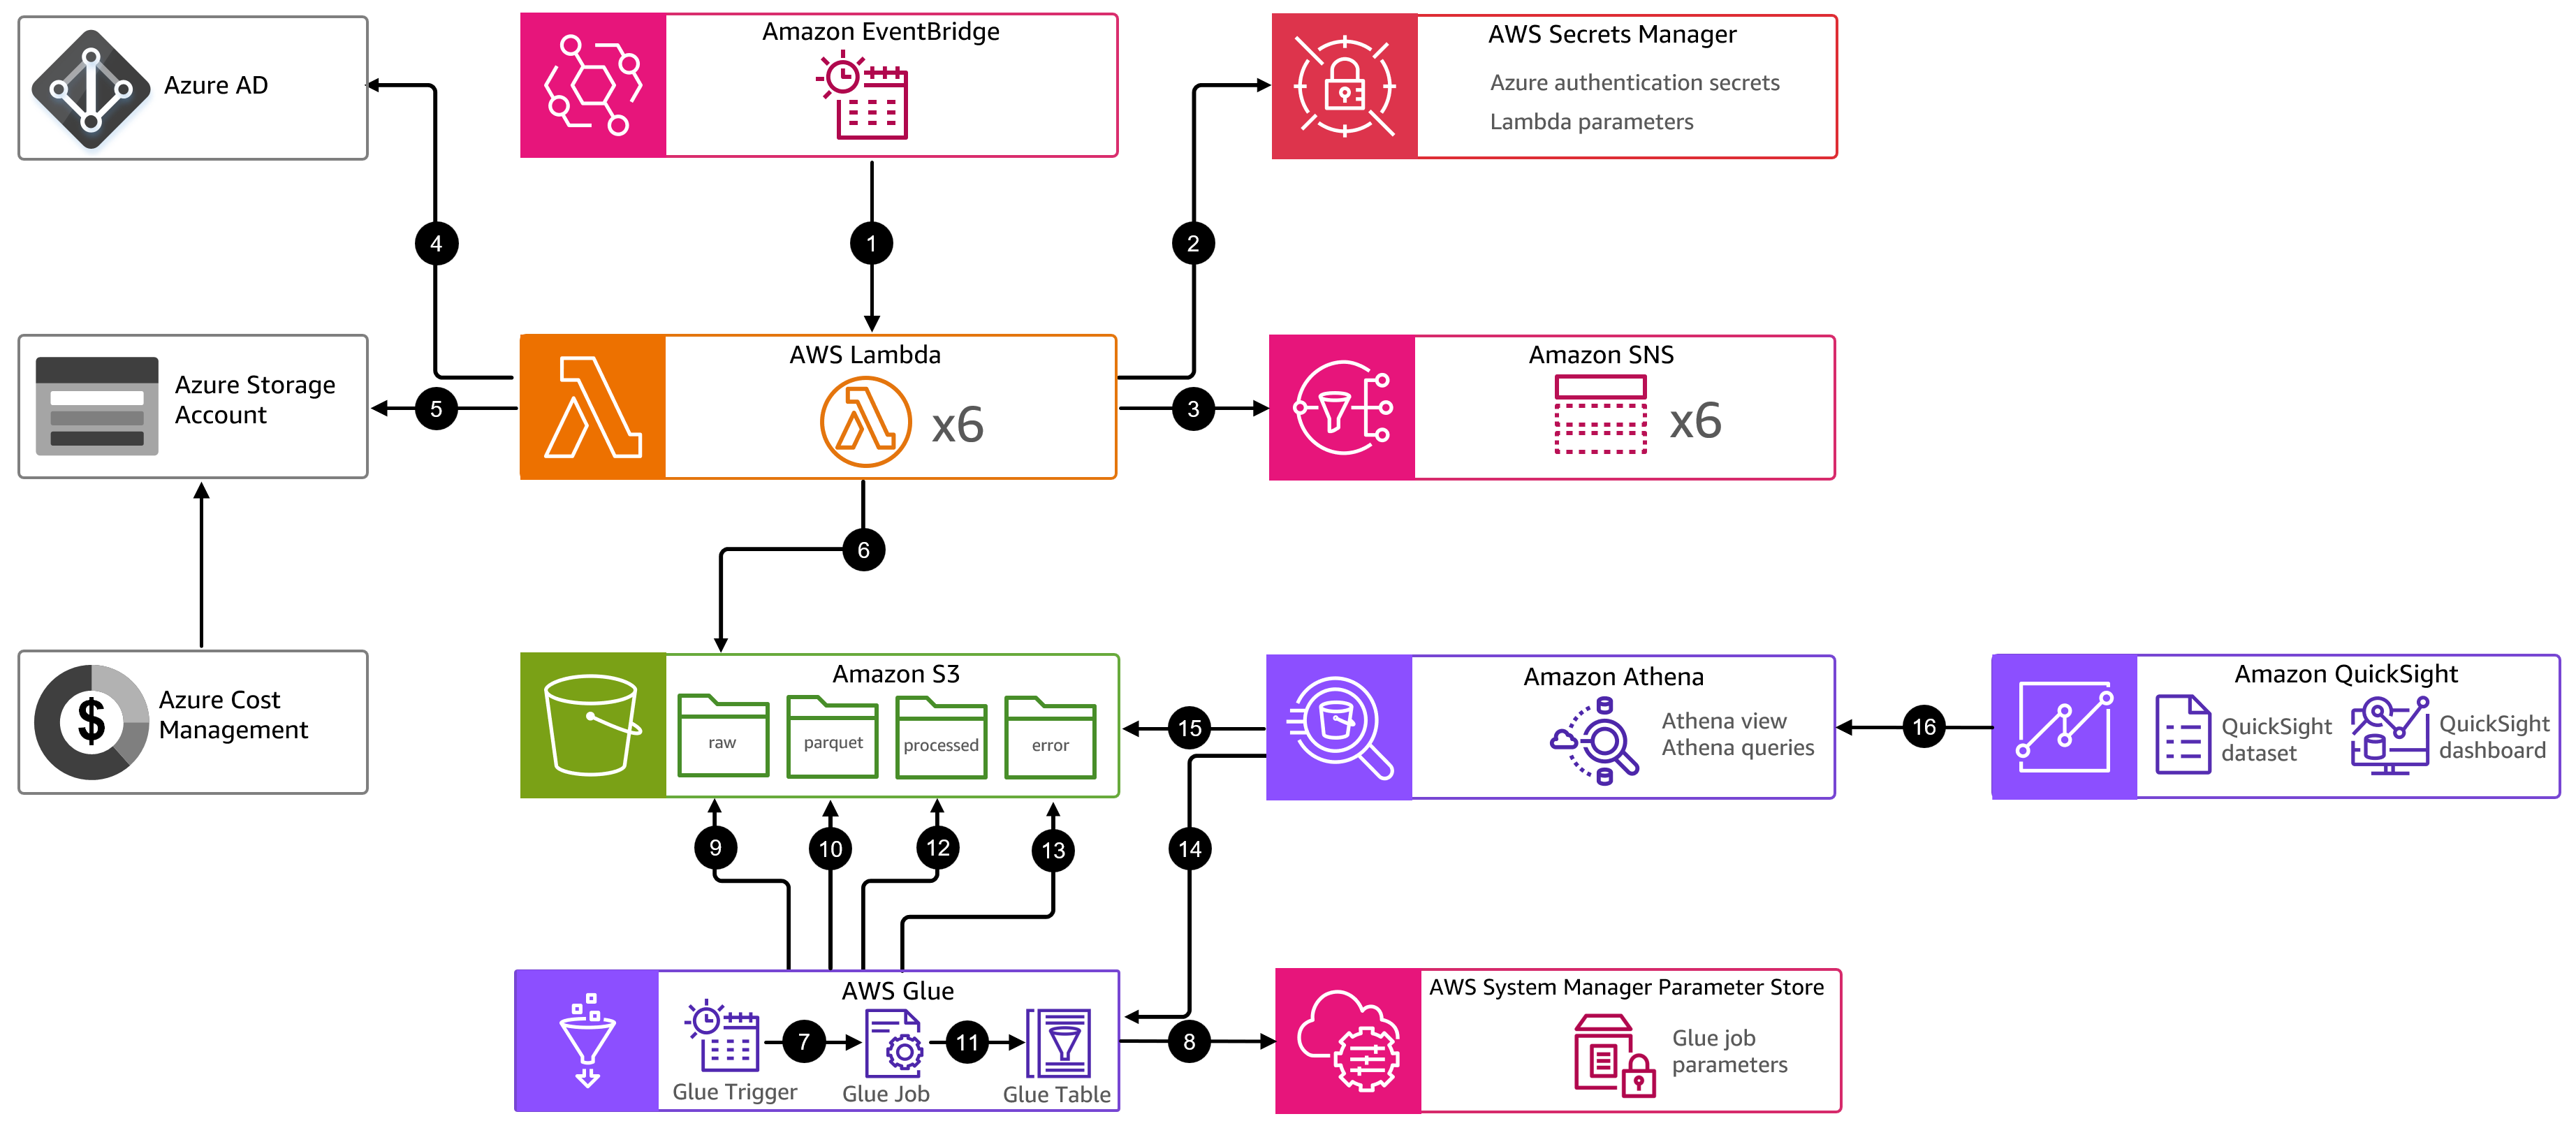
Figure 3: Order of events
| Step | Description |
| 1 | An Amazon EventBridge scheduled task triggers the first AWS Lambda function to start the copy of Azure cost management CSV files to AWS. |
| 2 | Lambda functions query parameters and secrets stored in AWS Secrets Manager. |
| 3 | Lambda functions communicate with each other using Amazon SNS topics. |
| 4 | Lambda functions requests an OAUTH token from Azure Active Directory over HTTPS. |
| 5 | Lambda functions interact with Azure blob storage over HTTPS. |
| 6 | Lambda functions download CSV files to the Amazon S3 azurecidraw folder. |
| 7 | An AWS Glue schedule triggers the AWS Glue job. |
| 8 | AWS Glue job queries AWS System Manager Parameter Store to retrieve values used by the job e.g. Amazon S3 bucket name. This is part of CloudFormation deployments only. |
| 9 | AWS Glue job loads data from the Amazon S3 azurecidraw folder. |
| 10 | AWS Glue job transforms data and converts CSV files to Parquet format. The resulting Parquet files are stored in the Amazon S3 azurecidparquet folder. |
| 11 | AWS Glue job updates the AWS Glue table schema. The schema helps other services, like Amazon Athena, to understand the structure of the data stored in Amazon S3. |
| 12 | AWS Glue job copies the CSV files from the Amazon S3 azurecidraw folder to the azurecidprocessed folder and subsequently deletes the contents of the azurecidraw folder. This process ensures that the original files are preserved, allowing them to be reprocessed if needed. |
| 13 | If an error occurs while processing the CSV file, it is automatically copied to the Amazon S3 azureciderror folder. |
| 14, 15 | An Amazon Athena query uses the AWS Glue Table and Parquet files to build an Athena view. |
| 16 | Amazon QuickSight uses the Athena view as its data source. The data source refreshes each day. |
Table 1: Order of operations
For more details on steps 1-6, review the blog post How to copy data from Azure Blob Storage to Amazon S3 using code.
Walkthrough
Visit the Cloud Intelligence Dashboard for Azure workshop for a full setup guide and interactive sample dashboard. The workshop shows you how to:
- Setup prerequisites, including your Azure environment.
- Deploy the solution using AWS CloudFormation or Terraform
- Manually trigger an initial copy of data.
- Deploy a sample QuickSight dashboard.
- Create additional QuickSight visualizations.
- Complete common administrative tasks such as changing the schedule and adding additional Azure tags.
The code for this blog post is available in an AWS Samples Git repository. Costs for this lab include the following components:
- AWS resources. Processing 2GB of data per day with the default configuration costs under $100 per month at the time of this writing.
- QuickSight Enterprise. Refer to pricing.
- Microsoft Azure egress data charges. Refer to pricing.
Clean up
If you no longer need the solution, refer to the clean up section of the workshop. It provides instructions on how to remove all resources associated with the solution, ensuring that you stop incurring any additional AWS charges.
Conclusion
In this blog post, we introduced you to the Cloud Intelligence Dashboard for Azure, a solution that lets you visualize your Azure usage costs in Amazon QuickSight. We showed you how the solution works and the AWS services it uses. The goal of this solution is to enable cost control for our customers, providing them with a panoramic view across multiple clouds. If you have any suggestions for future features, please log a GitHub issue at the repository.
AWS has significantly more services, and more features within those services, than any other cloud provider, making it faster, easier, and more cost effective to move your existing applications to the cloud and build nearly anything you can imagine. Give your Microsoft applications the infrastructure they need to drive the business outcomes you want. Visit our .NET on AWS and AWS Database blogs for additional guidance and options for your Microsoft workloads.
Contact us to start your migration and modernization journey today.