AWS Cloud Operations Blog
Using ELB Access Logs and AWS Application Cost Profiler to track tenant cost of shared AWS Infrastructure
In our previous post on AWS Application Cost Profiler (ACP), we demonstrated how application owners instrument a serverless application with tenant metadata in a contextual format using AWS X-Ray. This tenant metadata is necessary for ACP to generate a granular cost breakdown of shared AWS resources used by multi-tenant applications. These granular cost insights let customers running multi-tenant applications accurately understand the per-tenant usage and associated costs of shared resources within the application. Using this data, Independent Software Vendors (ISVs) can develop go-to-market strategies with tier-based support or consumption-based pricing for their products, and effectively manage the costs of a multi-tenant architecture model. Additionally, organizations running multi-tenant applications can use the data to define accurate cost allocation models for chargeback purposes.
As previously noted, ACP requires application owners to instrument their application for tenant metadata in a contextual format. However, it’s not always feasible for customers to update large swaths of application code to generate the necessary tenant metadata. This post demonstrates how you can leverage the access logs of your Application Load Balancer (ALB) to extract the tenant usage metadata of multi-tenant applications running behind an ALB without the need to instrument the code of the application.
Solution Overview
Many customers run their web application code behind an ALB to automatically distribute incoming application traffic across multiple targets, such as Amazon EC2 instances, containers, IP addresses, and AWS Lambda functions. Elastic Load Balancing provides access logs that capture detailed information about requests sent to your load balancer. Each log entry contains information, such as the time the request was received, the client’s IP address, request processing time, and request path.
Multi-tenant applications will typically include a tenant identifier in the initial request of the application’s authentication process, which is recorded in the request path field of the ALB access logs. AWS Glue is a serverless data integration service that can be used to build extract, transform, and load (ETL) pipelines. Using AWS Glue lets you extract the tenant identifier along with the client IP address from the ALB access logs. Subsequent requests made from that IP address can be correlated to the extracted tenant identifier. Since the ALB access logs contain the request start and stop times, we can record the usage period of each request and link that request to a tenant ID based on the IP address. Assuming that all shared resources behind the ALB are tagged with a common cost allocation tag, we have enough information to generate the tenant metadata file without changing any of our existing application code!
Architecture
The following diagram illustrates this solution:
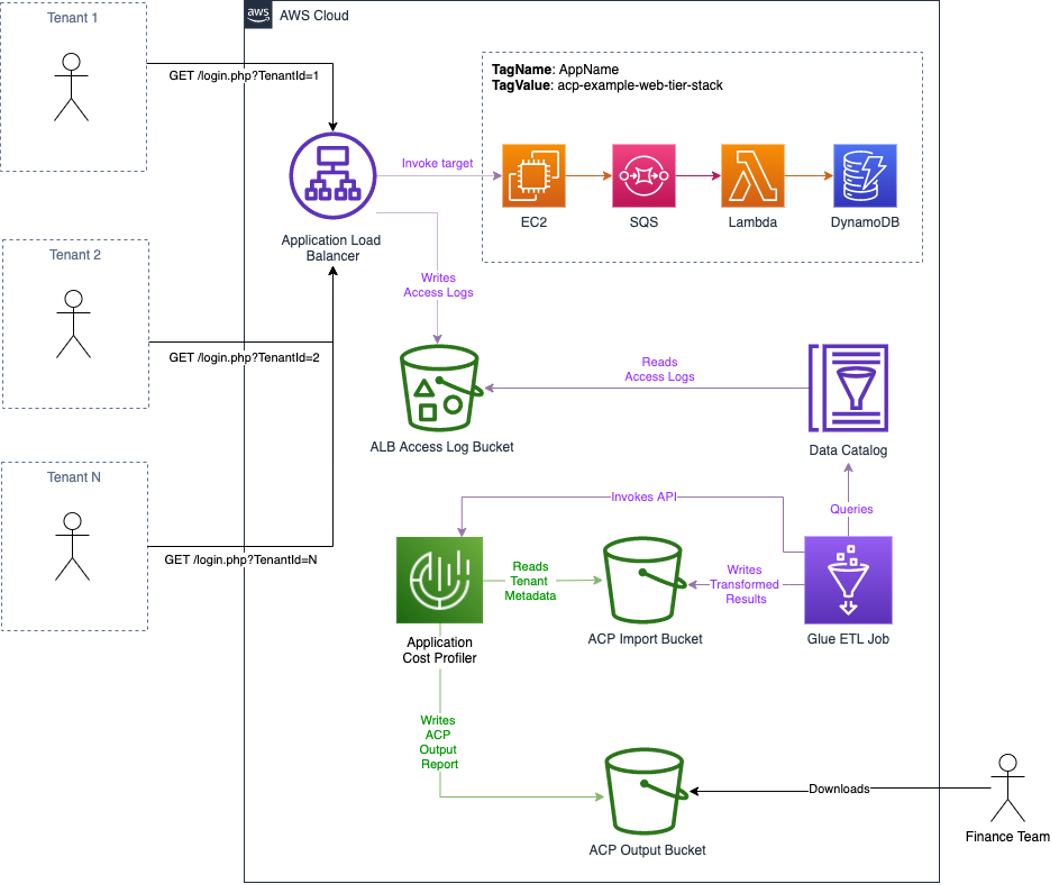
Figure 1: Architecture overview
The workflow is as follows:
- Tenants initiate authentication to the multi-tenant application. As part of this request flow, a tenant identifier is recorded in the ALB logs.
- After authentication, the tenants use the shared resources of the application behind the ALB. All of the shared resources are tagged with a common cost allocation tag.
- Access logs are written to the configured S3 bucket.
- Every hour a Glue Workflow is triggered:
- A Glue ETL job reads the ALB access log data from a Glue Data Catalog and transforms the data to the tenant usage format writing the output to an Amazon Simple Storage Service (S3) bucket with a bucket policy that grants ACP read access.
- ACP is notified of the new files ready for import, as is shown in the following figure.
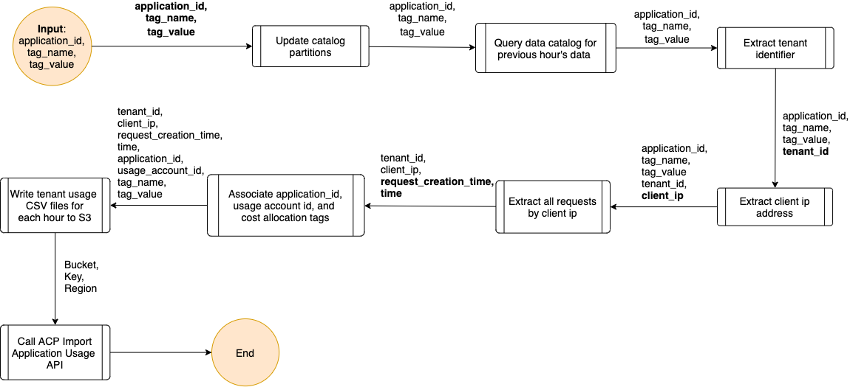
Figure 2: Logic for Glue ETL job
- Each day, ACP will retrieve the tenant usage files from Amazon S3, run the data through its data processing pipeline, and output the ACP report to the configured S3 bucket.
Deploy the infrastructure
To demonstrate this solution, this post provides a set of AWS CloudFormation templates that will setup the necessary S3 bucket for ACP, the Glue ETL infrastructure, and a multi-tier web application that can be used to generate sample data based on cost allocation tag.
Step 1: Configure the Application Cost Profiler for reporting consumption insights
ACP report configuration must be defined in the AWS Console, via the AWS CLI, or using one of the AWS SDKs. We will demonstrate how you configure this in the AWS console. The report configuration is to instruct ACP where to deliver the tenant cost reports. The destination is an S3 bucket with the proper permissions for ACP to write the reports.
Prerequisites
For this walkthrough, you need the following prerequisites:
- An AWS account
- AWS IAM user with console access and admin privileges
- Enable Cost Explorer
Setup S3 bucket and report configuration
- Log in to the AWS Console.
- Verify that Cost Explorer has been enabled (important as ACP will not process tenant usage data without Cost Explorer being enabled).
- Select the following launch stack button to launch our first CloudFormation stack that will install and configure an S3 bucket with proper ACP permissions and server side encryption settings, an AWS Event Bridge rule, and an SNS Topic for ACP events that you can optionally subscribe to.
![]()
.
- Once the launch of the CloudFormation stack has completed, use the console search function to navigate to the “AWS Application Cost Profiler” landing page.
- In the ACP dashboard, choose “Get started now”.
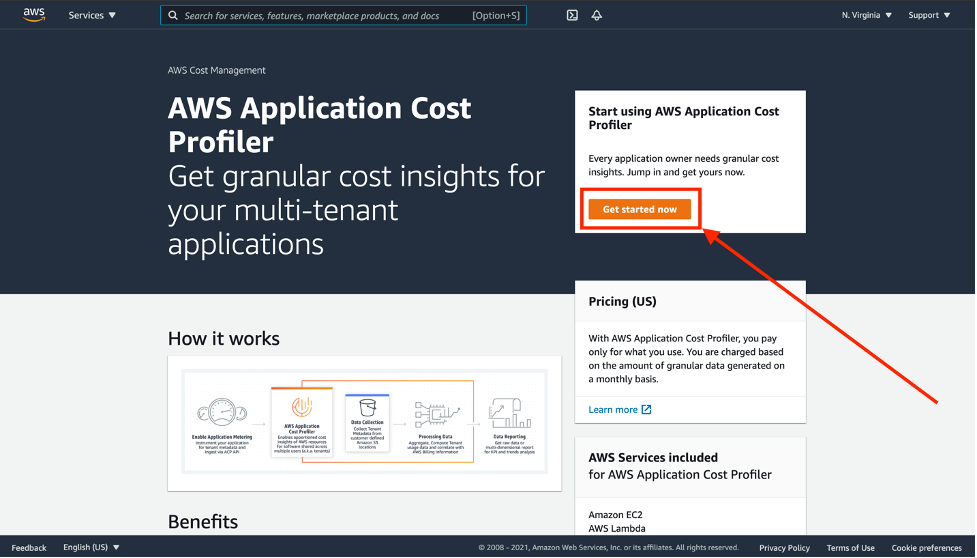
Figure 3: The landing page for AWS Application Cost Profiler
- Setup a new report configuration:
- Report Name – This is user defined and cannot be changed once saved.
- Report Description – This is a user defined description of the report configuration (optional).
- S3 Bucket Name – This is the S3 bucket where ACP will deliver the reports. This bucket was created using the previous CloudFormation template, and it can be found in the outputs under the key “AcpReportDeliveryBucket”. The bucket is named “acp-{REGION}–{ACCOUNT_ID}”, substituting {REGION} with the AWS region that the CloudFormation template was deployed to, for example us-east-1, and {ACCOUNT_ID} with the actual AWS account ID that was used to deploy the CloudFormation template, for example, “acp-us-east-1-987654321”. This report bucket name can also be found in the “Resources” section of the CloudFormation stack deployed above.
- S3 Prefix – This is the prefix in the S3 bucket used above where ACP will deliver the reports. The S3 Bucket deployed in the CloudFormation template above enabled write permissions for ACP to the “reports” prefix. Therefore, enter “reports” for the S3 prefix here.
- Time Frequency – Choose whether the report is generated on a Daily or Monthly cadence, or both.
- Report Output Format – Choose the type of file that will be created within your S3 bucket. If you choose CSV, then ACP creates a comma-separated values text file with gzip compression for the reports. If you choose Parquet, then a Parquet file is generated for the reports.
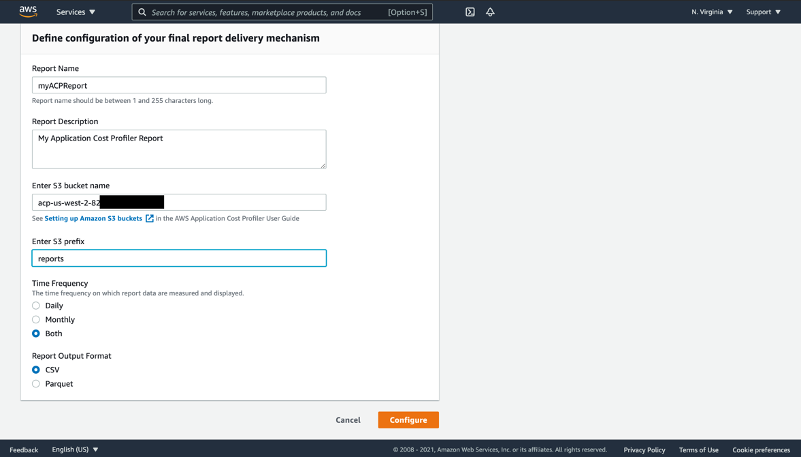
Figure 4: Define configuration of the ACP report delivery
- Select the “Configure” button. ACP will verify the existence of the S3 bucket defined above, as well as the services write permissions to the prefix defined above. If successful, then you will see a confirmation.
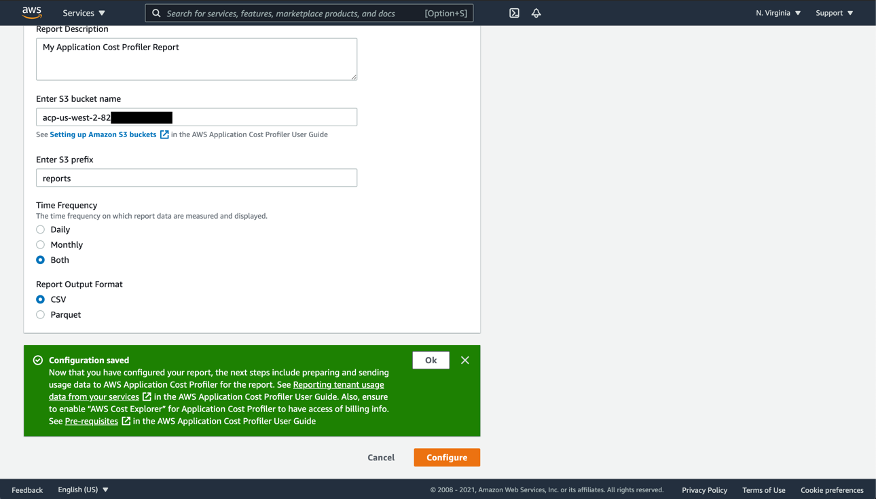
Figure 5: Confirmation after successfully configuring ACP report delivery
- Select “OK” to return to the ACP.
Now that you’ve set up an S3 bucket destination with permissions, and set up a report configuration within the ACP console, you are ready to prepare, upload, and import your tenant usage data.
Step 2: Deploy the sample web application
- Log in to the AWS Console.
- Select the following launch stack button to launch the second CloudFormation stack that will install and configure the sample web application.
![]() .
.
This creates a multi-tenant application you can use to generate sample ALB logs which will be transformed by the Glue ETL job and processed by ACP. The architecture of this web application consists of an Amazon Virtual Private Cloud (Amazon VPC) with two public subnets and two private subnets. An Application Load Balancer is deployed across the public subnets and routes web requests to EC2 instances deployed in each of the private subnets. These EC2 instances submit messages containing the tenant id extracted from each web request to an Amazon Simple Queue Service (Amazon SQS) queue. A Lambda function reads each message on the queue and increments a counter in an Amazon DynamoDB table. All of these resources are tagged with the same cost allocation tag. See the architecture diagram in Figure 6 in below for more details.
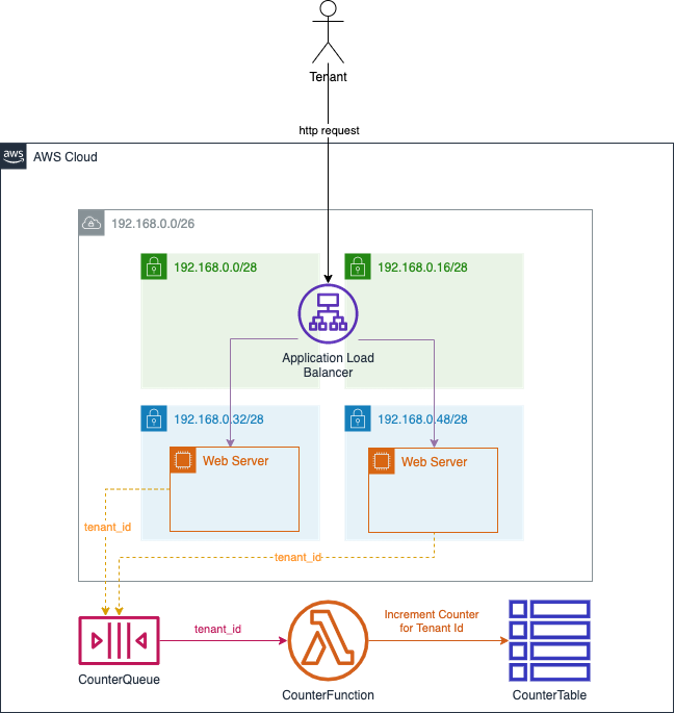
Figure 6: Architecture of sample multi-tenant web application used to generate ALB logs
- Once this CloudFormation template has completed deploying, navigate to the Outputs section of the stack and note the “WebTierInvokeUrl” value. It will be in the following format:
http://{your-alb-dns-name}/login.php
- Using the “WebTierInvokeUrl” identified above, open a web browser and paste the value into the location window. This will execute the sample web application.
- If no tenant ID is detected in the request cookie or URL query parameters, then a random tenant ID is assigned and the request is redirected back to the login page with the tenant ID as a query parameter.
- To generate request data, you can then page through a series of three pictures by clicking the links in each page.
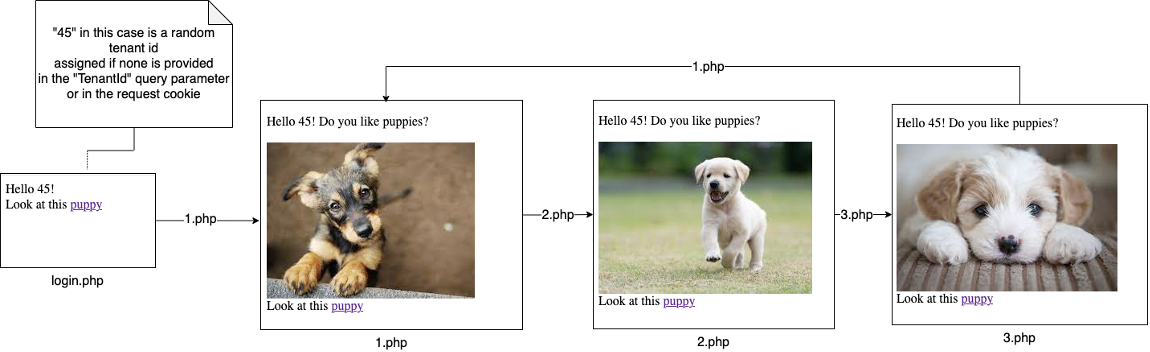
Figure 7: Page flow of sample web application
-
- Each request will sleep between zero and five seconds to simulate the variable processing time by the web application.
- Each request will also submit a message containing the request’s tenant ID to the Amazon SQS “CounterQueue” queue.
- The “CounterLambda” Lambda function is invoked when messages are placed on the “CounterQueue”. It reads the tenant ID from the message and increments an atomic counter on the DynamoDB “CounterTable” table for each request made for an individual tenant ID.
- To simulate different tenants, change the “TenantId=” value in the browser location window to a different ID, such as “TenantId=19” or “TenantId=30”. Press enter each time to execute the sample serverless application. Invoking this endpoint in a browser will cause the web application to execute and log the request in the ALB access logs. You can also use utilities like Apache JMeter to simulate multiple tenants. Here is an example JMeter script that works well with the Distributed Load Testing on AWS solution to quickly simulate the load generated by multiple tenants from different IP addresses that are similar to real world traffic*.
*Note: Use this sample JMeter script be sure to change the value on line 13 to the dns name of the sample web application load balancer:
<stringProp name="Argument.value">YOUR_ALB_DNS_NAME</stringProp>
Although it’s not a very efficient design, the sample application will generate usage across multiple AWS services. ACP can associate this usage to individual tenant IDs because all of the resources are tagged with a common cost allocation tag.
Step 3: Deploy the Glue ETL infrastructure
- Log in to the AWS Console.
- Select the following launch stack button to launch the next CloudFormation stack that will install and configure the Glue ETL infrastructure used to transform the ALB access logs into the tenant usage metadata format required by ACP.
![]() .
.
Once the CloudFormation stack has completed, in the N. Virginia/us-east-1 region use the console search function to navigate to the “AWS Glue” landing page. Using the navigation panel on the left side under the “Data catalog” section, select “Tables”. You will see a table with the name format “acp_alb_{ACCOUNT_ID}_{REGION}”.
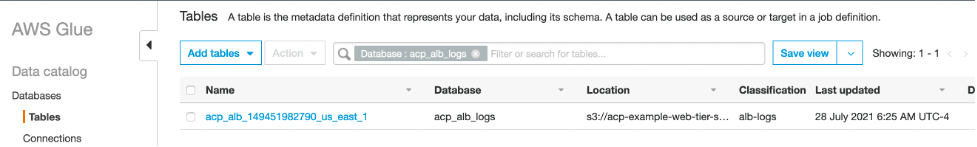
Figure 8: View of the Glue Data Catalog table containing ALB access log data
The data for this table is sourced from the ALB access logs for the sample application, and it is read by the Glue ETL script when generating the tenant usage data.
Again, using the navigation panel on the left side under the “ETL” section, select “Workflows”. Here you will see a workflow named “alb-logs-to-usage-etl-workflow”.
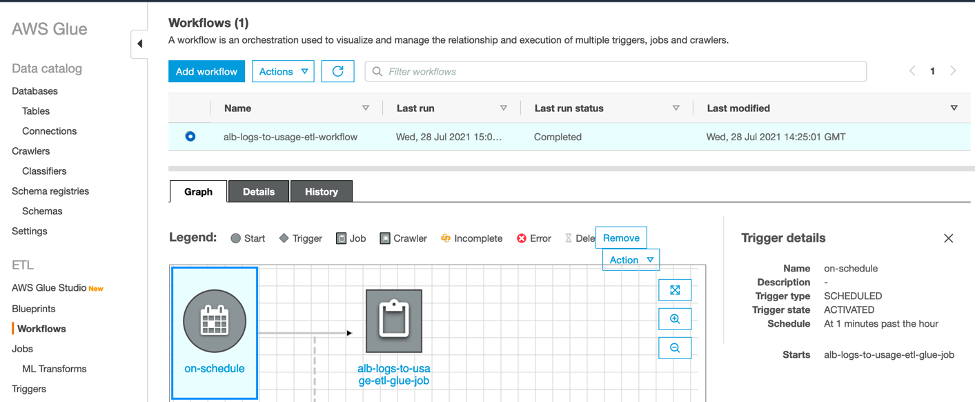
Figure 9: View of the Glue ETL Workflow
This workflow triggers a python script every hour to process new ALB logs and submit the generated usage data to ACP for processing.
Run the Glue ETL job
Manually navigate to AWS Glue Studio to run the Glue ETL job. AWS Glue Studio is a new graphical interface that makes it easy to create, run, monitor, extract, transform, and load (ETL) jobs in AWS Glue. Click “View Jobs”, and you will again see the “alb-logs-to-usage-etl-glue-job”. Check the box next to the job name, and then select the “Run job” button on the right.
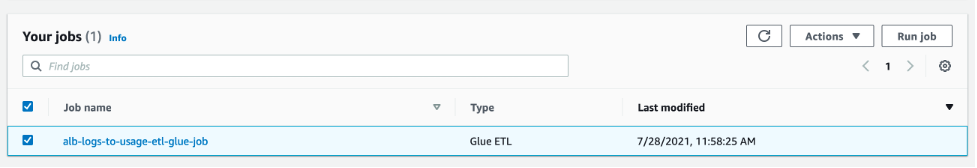
Figure 10: View of the Glue ETL jobs screen in AWS Glue Studio
To monitor the job’s progress, select the job name and navigate to the “Runs” tab.
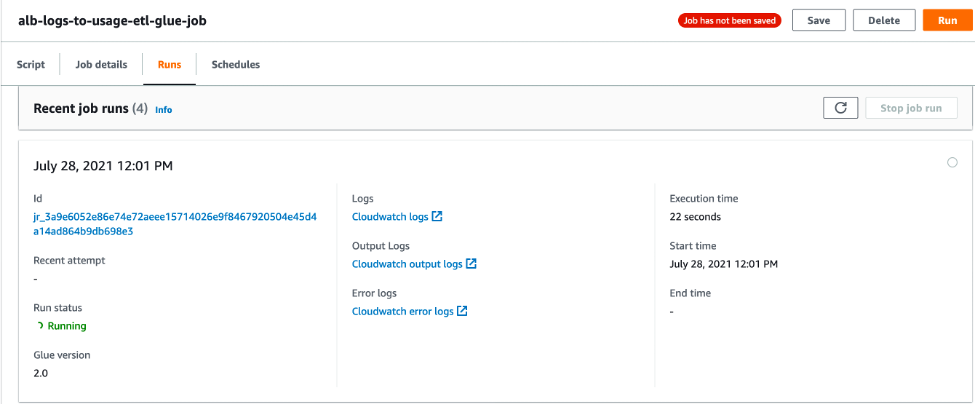
Figure 11: View of the running Glue ETL job in AWS Glue Studio
Once the job is complete, open the link labeled “CloudWatch output logs”. This will take you to the jobs log stream in Amazon CloudWatch logs. Select the log stream to view the output logs of the Glue job.
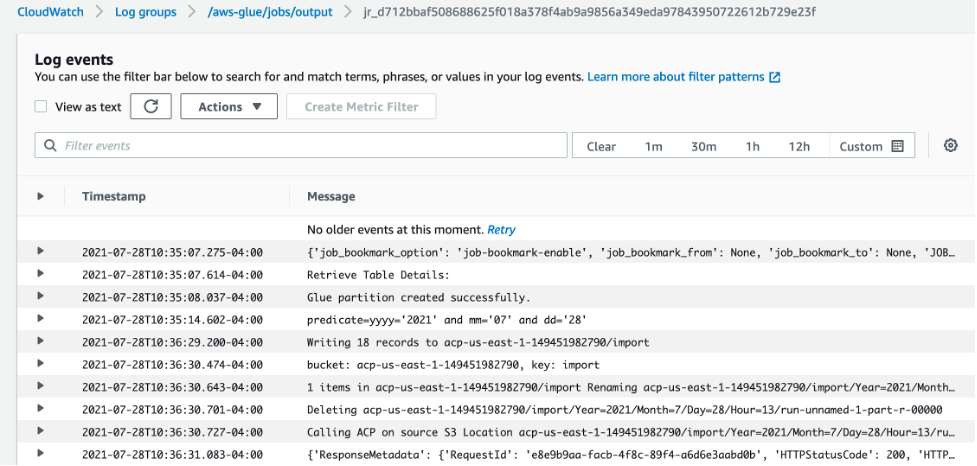
Figure 12: View of the Glue ETL job logs in Cloudwatch
Here you can see the job has transformed the ALB access logs and written the results to Amazon S3. If you navigate to this location in Amazon S3, then you can view a subset of the output results by using S3 Select.
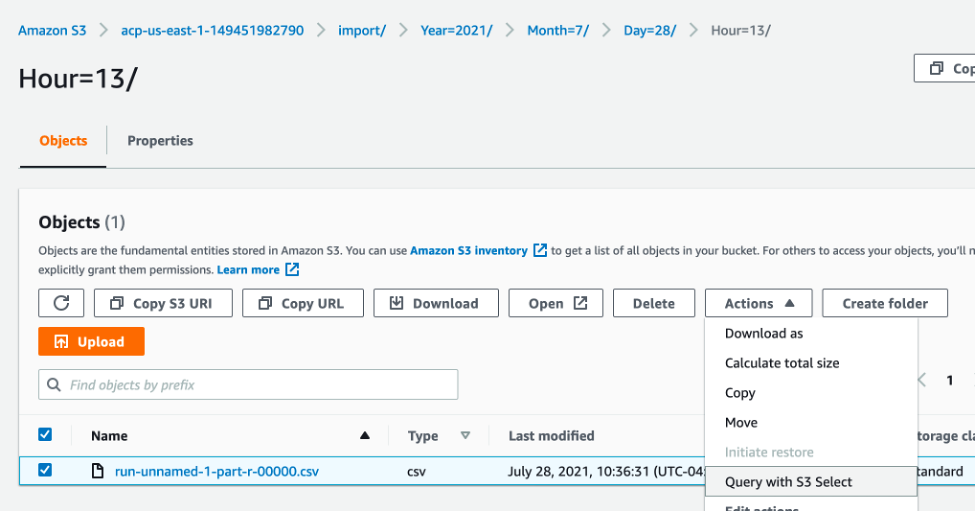
Figure 13: View of the transformed ALB access logs file in S3
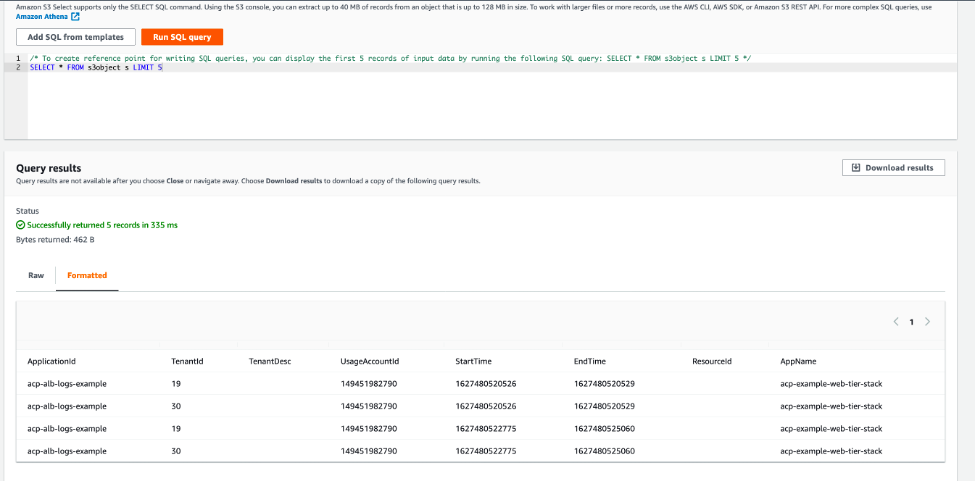
Figure 14: S3 Select results screen showing the transformed data
Application Cost Profiler Data
If the time frequency for your ACP report was set up to be daily, it can take up to 24 hours after the Glue ETL job calls the ImportApplicationUsage API for the ACP data to be available in the S3 report bucket and prefixed configured. Using the above CloudFormation setup, the ACP data will be placed in s3://acp-{REGION}–{ACCOUNT_ID}/reports/YYYY/MM/DD/part-*.csv.gz accordingly. An EventBridge event will also be generated when ACP data is available in the following format:
The following data is available in the tenant cost csv file generated by ACP.
Table 2: AWS ACP Tenant Cost Breakdown Elements on output file
| Column name | Description |
| PayerAccountId | The management account ID in an organization, or the account ID if the account is not part of AWS Organizations. |
| UsageAccountId | The account ID for the account with usage. |
| LineItemType | The type of record. Always Usage. |
| UsageStartTime | Timestamp (in milliseconds) from Epoch, in UTC. Indicates the start time of the period for the usage by the specified tenant. |
| UsageEndTime | Timestamp (in milliseconds) from Epoch, in UTC. Indicates the end time of the period for the usage by the specified tenant. |
| ApplicationIdentifier | The ApplicationId specified in the usage data sent to ACP. |
| TenantIdentifier | The TenantId specified in the usage data sent to ACP. Data with no record in the usage data is collected in unattributed. |
| TenantDescription | The TenantDesc specified in the usage data sent to ACP. |
| ProductCode | The AWS product being billed (for example, AmazonEC2). |
| UsageType | The type of usage being billed (for example, BoxUsage:c5.large). |
| Operation | The operation being billed (for example, RunInstances). |
| ResourceId | The resource ID or ARN for the resource being billed. |
| ScaleFactor | If a resource is over-allocated for an hour, for example, then the usage data reported is equal to two hours instead of one hour, and a scale factor is applied to make the total equal the actual billed amount (in this case, 0.5). This column reports the scale factor used for the specific resource for that hour. The scale factor is always greater than zero (0) and less than or equal to one. |
| TenantAttributionPercent | The percentage of the usage attributed to the specified tenant (between zero (0) and 1). |
| UsageAmount | The amount of usage attributed to the specified tenant. |
| CurrencyCode | The currency that the rate and cost are in (for example, USD). |
| Rate | The billing rate for the usage, per unit. |
| TenantCost | The total cost for that resource for the specified tenant. |
| Region | The AWS Region of the resource. |
| Name | If you created resource tags for your resources on the Cost and Usage report, or through the resource usage data, then the Name tag is shown here. For more information about resource tags, see Resource tags details in the Cost and Usage Report User Guide. |
The following is an example of the actual csv output in the ACP report as viewed via S3 Select:
This csv file can then be queried directly using Amazon Athena or integrated into your existing analytics and reporting tools, such as Amazon Quicksight as in the following example.
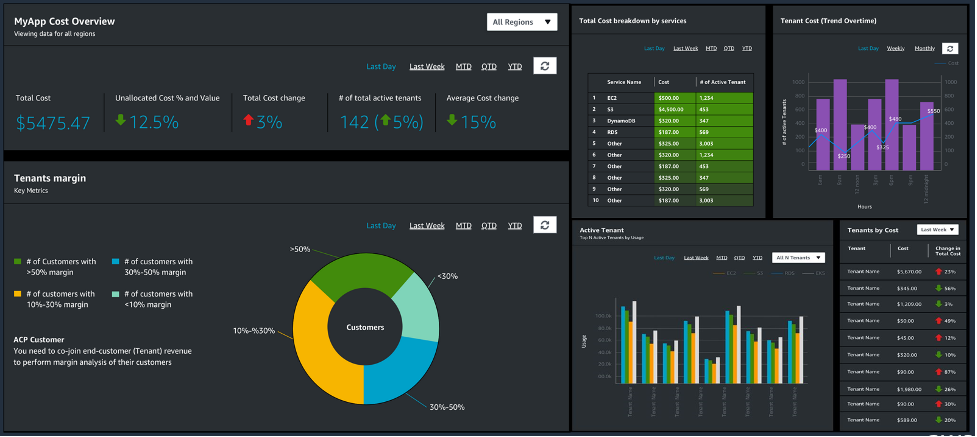
Figure 15: Example of an Amazon QuickSight dashboard created from the ACP report
Cost
See the ACP pricing page for pricing details. For our example, ACP costs remained inside the free tier when running the application for one month. Additional costs were associated with running the example web application and the Glue ETL job.
Tear Down
To tear down the project delete the following stacks via the CloudFormation console:
- acp-example-analytics-stack
- acp-example-web-tier-stack
- ApplicationCostProfilerBucketStack
Conclusion
In this walkthrough, you have setup a new AWS ACP report configuration, including a destination S3 Report Bucket with appropriate permissions. Then, you completed the process of generating tenant usage data for a sample web application, imported the usage data into ACP, and received the result reports.
Our service team provides reference implementation guidance for different architecture patterns to facilitate the instrumentation. We also have a dedicated Solution Architects team to support you through the instrumentation and facilitate onboarding. If you need support for onboarding, then reach out to us at aws-acp@amazon.com or contact your account team to get support.
To further understand the value and importance of cost per-tenant, please refer to the Calculating Tenant Costs in a SaaS Environment post, as well as the AWS re:Invent session that outlines the basic approach and challenges associated with capturing this information.