AWS Cloud Operations Blog
Visualize AWS Health events using Amazon Managed Grafana
Introduction
In this blog post you will learn how to visualize AWS Health events using Amazon Managed Grafana to gain deeper insights across multiple Health events in a centralized place. When used in conjunction with AWS Health, Grafana can enhance the ability to respond to issues, optimize performance, and ensure the overall Health of the AWS environment. The solution provided in this post will reduce the time and effort in managing and monitoring different communication channels and will provide a single place for monitoring in a near real time visibility. This solution can be further enhanced by allowing you to create customized dashboards and alerts based on specific Health event Criteria.
AWS Health is a service that helps you stay informed about the status of your AWS resources and services. It does this by consolidating information from various AWS services, like Amazon CloudWatch, AWS Trusted Advisor, and AWS Personal Health Dashboard, to deliver a unified view of your AWS environment and potential issues. This consolidated view helps you proactively manage your resources and take appropriate action in case of any disruptions or potential risks.
Architecture Overview
The following architecture diagram highlights the AWS services used in the solution:
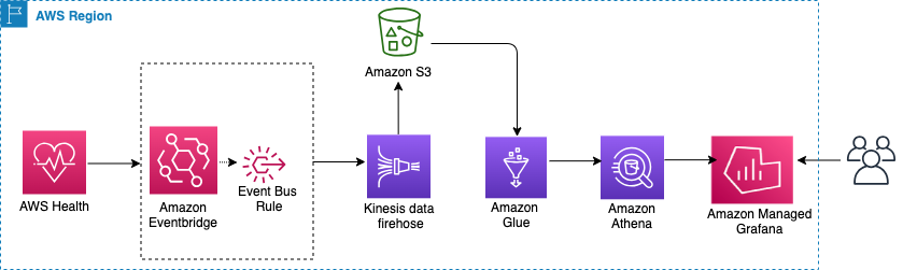
Figure 1: AWS Architecture diagram showing solution overview
In the solution, you are ingesting AWS Health events via Amazon Event Bridge rules and the Amazon Kinesis Firehose service to stream the real-time Health event into an Amazon S3 bucket. These events are extracted and loaded into AWS Glue Data catalogue and uses Amazon Athena to build a Managed Grafana dashboard to visualize the events in near real time.
Prerequisites
You will need the following resources for this solution:
- Setting up Amazon Athena workgroups with Amazon Grafana pre-requisites.
- By default, the permissions required by the Amazon S3 to access the underlying data source of an Athena query are not included in this managed policy. You must add the necessary permissions for the Amazon S3 buckets manually, on a case-by-case basis by referring to the Amazon Athena Prerequisites.
- Amazon Managed Grafana workspace. For information, and steps for creating the Amazon Managed Grafana workspace, see Creating a Workspace.
a. Amazon Managed Grafana lets you to configure user access through AWS IAM Identity Center or other SAML based Identity Providers (IdP). Review Amazon Managed Grafana supports direct SAML integration with identity providers.
b. In this post, you’re using the AWS IAM Identity Center option with Amazon Managed Grafana. To set up Authentication and Authorization, follow the instructions in the Amazon Managed Grafana User Guide to enable AWS IAM Identity Center.
c. To use AWS data source configuration, first use the Amazon Managed Grafana console to enable service-managed AWS Identity and Access Management (IAM) roles that grants the workspace with AWS IAM policies necessary to access resources in your AWS Account/Organization. Then, use the Amazon Managed Grafana workspace console to add the Amazon Athena data source.
Walk-through
Step 1: Launch the AWS CloudFormation Template
Download and launch this AWS CloudFormation Template to deploy Lambda, Glue Crawler, Glue Database and its related components.
Note: Some of the resources that this stack deploys incur costs when in use.
To create your resources using AWS CloudFormation template, complete the following steps:
- Sign in to the AWS Management Console.
- Navigate to the AWS CloudFormation console > Create Stack > “With new resources”.
- Upload the yaml template file and choose Next.
- Specify a “Stack name” and choose Next.
- Leave the “Configure stack options” at default values and choose Next.
- Review the details on the final screen and under “Capabilities” check the box for “I acknowledge that AWS CloudFormation might create IAM resources with custom names”.
- Choose Submit.
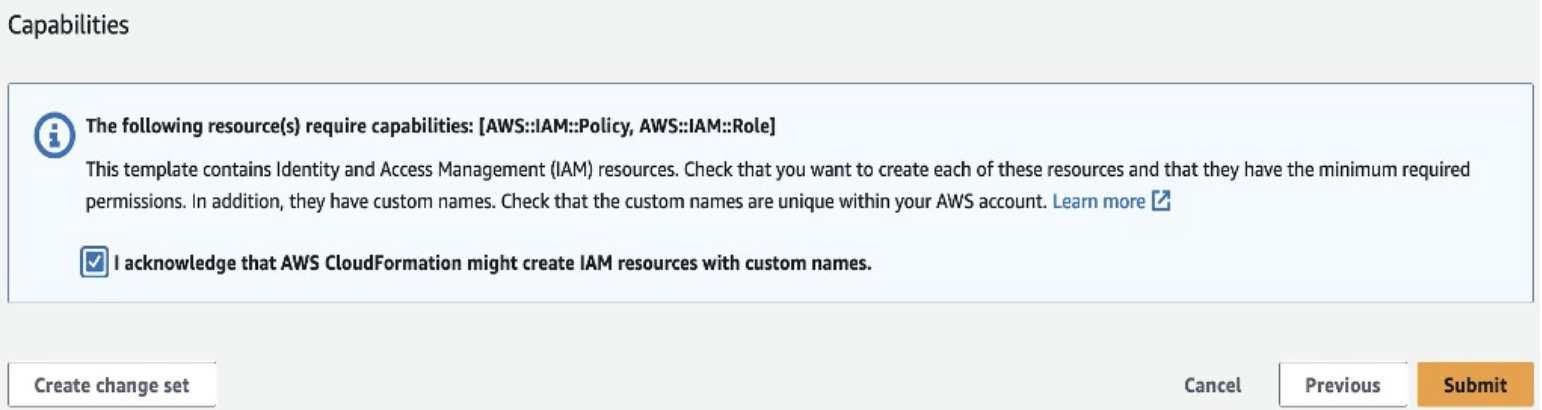
Figure 2: Acknowledgement
Note: You can review the progress of your new stack under AWS CloudFormation > Stacks > Stack_Name > Events tab
Upon successful creation of the Stack, you will notice the deployment of the following resources within the Resources section of CloudFormation: Amazon EventBridge Scheduler, an AWS Lambda Function, an Amazon S3 Bucket, an AWS Glue Crawler, an Amazon Athena Query, and AWS IAM Roles and Policies.
Note: Please keep in mind that after the completion of the mentioned CloudFormation (CFN) setup, it is essential to wait for an AWS Health event to be received by your EventBridge.
Step 2: Follow the below steps to create Amazon Athena view from saved queries
- Open Amazon Athena console.
- In the Query editor, open the saved queries tab and select the query named AWS_Health_Summary_View.
- Run the query to create a View named as AWS_Health_View.
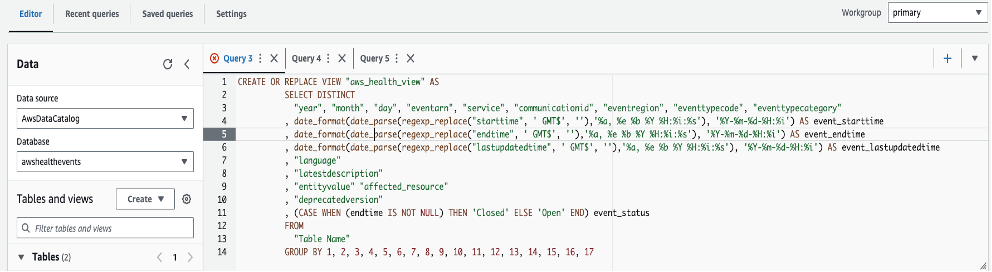
Figure 3: Amazon Athena Query Editor
Step 3: Configuring Amazon Athena data Source in Amazon Managed Grafana
To Configure Amazon Athena as data source in Amazon Managed Grafana:
- Launch the Amazon Managed Grafana console using the Grafana workspace URL and login using the user credentials you configured.
- Under Administration > Data sources > choose Amazon Athena.
- Configure the Amazon Athena settings by choosing Default Region (us-east-1), Data source (AWSDataCatalog), Workgroup (primary) and the Output Location of your Athena query.
- Choose Save & test to verify that the data source is working. Start querying and visualizing the metrics from the AWS environment.
Note: In case you receive a permission denied error, verify the Grafana service role permissions discussed in the previous step.
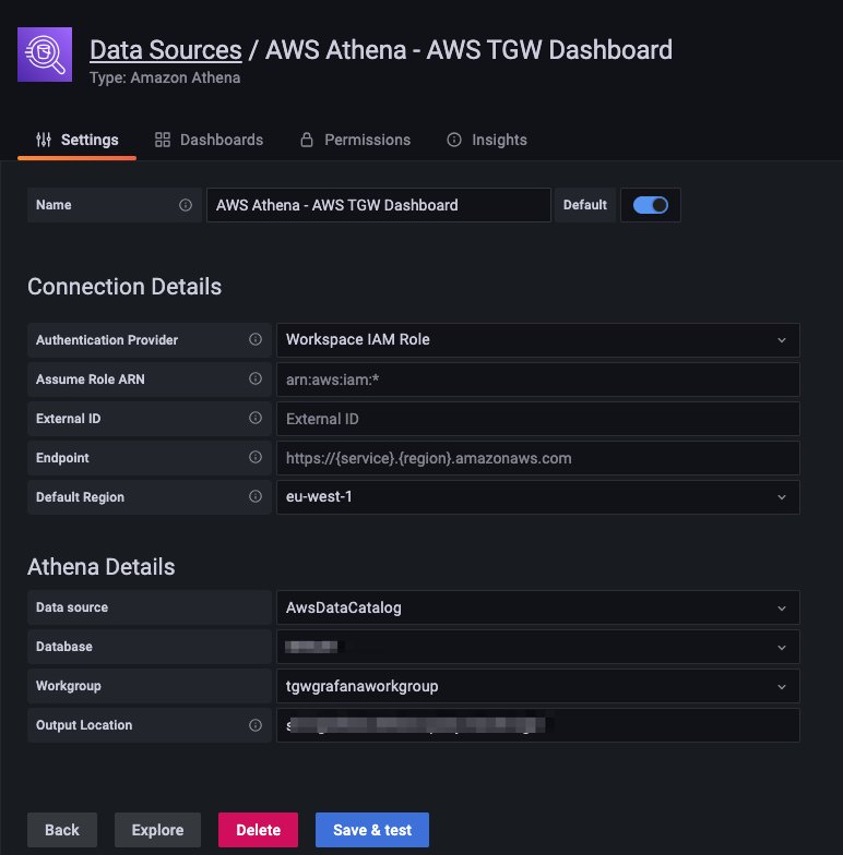
Figure 4: Image representing how to add data source in Grafana
- Choose Save & Test
Step 4: Create an Amazon Managed Grafana Dashboard using Athena as a data source
You will use Amazon Managed Grafana to create a new AWS Health dashboard. Now that you have completed all the previous steps successfully, we will create Amazon Managed Grafana dashboard by following below-mentioned steps:
- Download the Health dashboard JSON file from this GitHub Repository.
- To import a dashboard, choose the “+” or go to the Dashboards tab on the Amazon Managed Grafana console and choose Import.
- Copy and paste the contents of the JSON file into the Import via panel JSON textbox and choose Load.
Note: You can either upload a dashboard JSON file, paste a dashboard URL or paste dashboard JSON text directly into the text area and choose Load
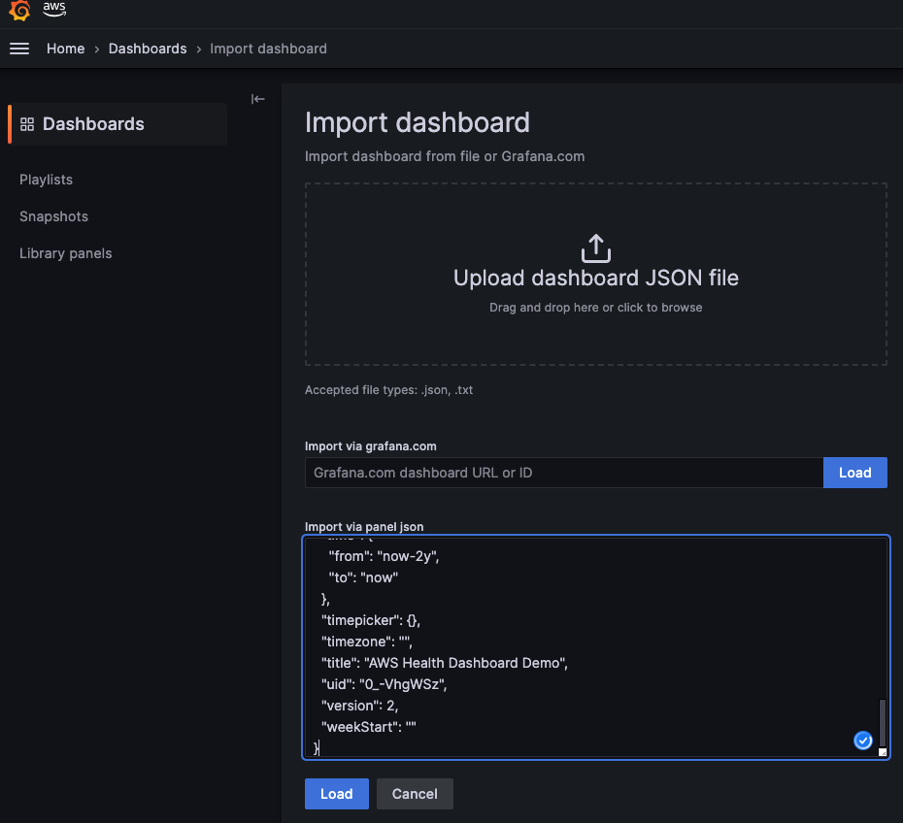
Figure 5: Importing JSON in Grafana
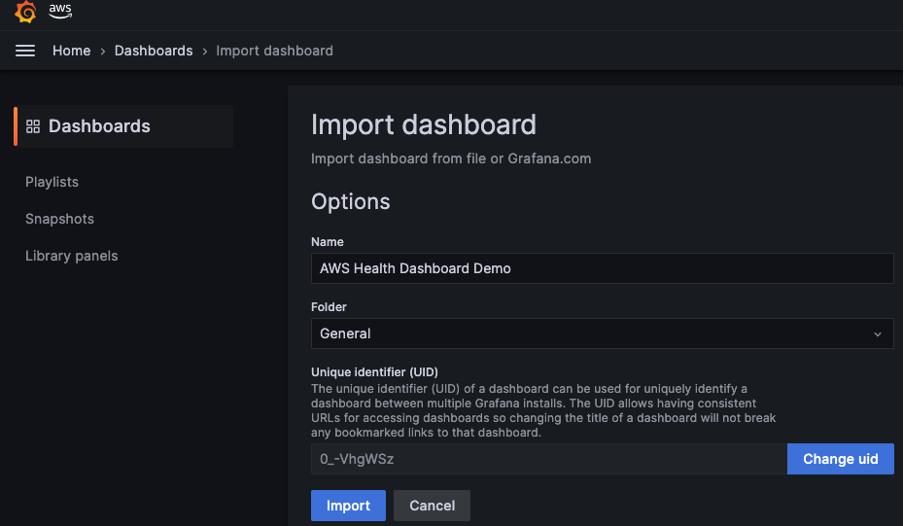
Figure 6: Naming your Grafana dashboard
Learn more about Exporting and importing dashboards.
Step 5: Analyse AWS Health metrics using Grafana dashboard
Now your Grafana dashboard is setup and configured to refresh every 5 minutes. This dashboard runs a query against the materialized views created in Amazon Athena and provides us with the visibility on below events:
Incident Awareness: Get timely notifications about service disruptions, enabling you to take appropriate action or make necessary adjustments to your applications.
Maintenance Visibility: Be informed about upcoming maintenance activities that might impact your resources, helping you plan and manage potential downtime.
Service Performance Insights: Access historical data about service performance to analyse trends and identify potential issues.
You can further enhance this dashboard by customizing it as per your business use-case.
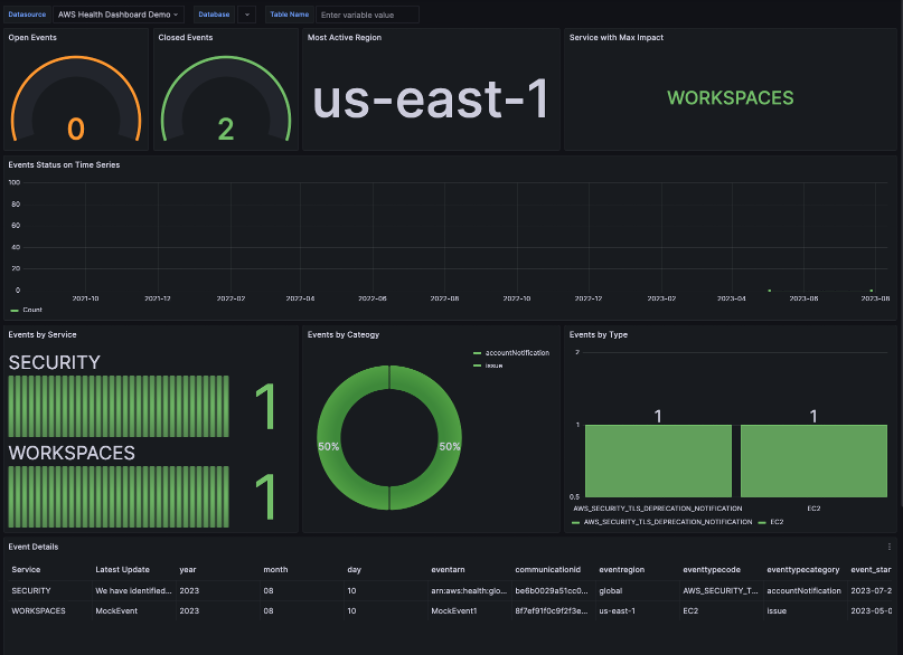
Figure 7: Image representing AWS Health events in Grafana dashboard
Clean up
To avoid incurring future charges, delete all resources used in this post.
- Empty S3 bucket before deleting the AWS CloudFormation stack.
- Delete AWS CloudFormation Stack
- Delete Amazon Managed Grafana Workspace
- Delete Amazon Athena workgroup
Conclusion
In this blog post, you learned how to build AWS Health event dashboard on Amazon Managed Grafana. You reviewed how one can create a single-pane-of-glass visibility to track AWS Health events in near real-time. This will help your cloud operations team by providing ongoing visibility into your resource performance and the availability of your AWS services and accounts. You can use this dashboard to learn how service and resource changes might affect your applications running on AWS. You can get hands-on experience with the AWS observability services using the One Observability Workshop.