AWS Open Source Blog
Tracing AWS Lambda functions in AWS X-Ray with OpenTelemetry
AWS Distro for OpenTelemetry is a secure, Amazon Web Services (AWS)-supported, production-ready distribution of the Cloud Native Computing Foundation (CNCF) OpenTelemetry project that provides open source APIs, libraries, and agents to collect distributed traces and metrics for application monitoring. OpenTelemetry is a community effort to simplify observability instrumentation for all. As a committed, active member of that community, AWS follows an upstream-first approach where all our enhancements are first contributed upstream. Our distribution is then built using the upstream code.
Many customers are building their distributed applications based on a microservices architecture. Customers use managed AWS services including AWS Lambda, Amazon Elastic Container Service (Amazon ECS), and Amazon Elastic Kubernetes Service (Amazon EKS) running on Amazon Elastic Cloud Compute (Amazon EC2) and AWS Fargate for running their code along with services like Amazon API Gateway, Amazon Simple Notification Service (Amazon SNS), Amazon Simple Queue Service (Amazon SQS), Amazon DynamoDB, Amazon Simple Storage Service (Amazon S3), and others.
With the distributed architecture, customers face a variety of operational challenges, including how to solve availability and performance issues quickly. Also, when customers try to monitor these applications, they want to understand the health of the application and which services are impacted because of a performance bottleneck or an increase in error rate that can affect their end users. Customers typically use the observability data of metrics, logs, and tracing to try to solve these problems.
Customers also want to leverage the new set of standardized OpenTelemetry agents, APIs, and SDKs to capture, correlate, and send application performance data to AWS monitoring solutions, such as AWS X-Ray along with partner solutions. OpenTelemetry supports exporting data to a variety of open source and commercial backends. OpenTelemetry has its own open standard data protocol, OpenTelemetry Protocol (OTLP), which provides interoperability with other protocols, including commercial, proprietary monitoring systems.
To support OpenTelemetry for instrumenting AWS Lambda functions, we have added an OpenTelemetry Lambda layer based on Lambda Extensions using the OpenTelemetry Python SDK. The OpenTelemetry Collector runs as part of the Lambda extension along with the OpenTelemetry Python SDK. This allows AWS Lambda to use the OpenTelemetry Collector X-Ray Exporter to send traces to AWS X-Ray. This Lambda support is also available in the downstream distribution – AWS Distro for OpenTelemetry (ADOT).
With ADOT, we can collect trace data when using the Python SDK. When we add AWS dependency calls, the Python SDK can be auto-instrumented. The Lambda layer for AWS Lambda provides a plug-and-play user experience by automatically instrumenting a Lambda function, by packaging the OpenTelemetry Python SDK together with an out-of-the-box configuration for AWS Lambda and AWS X-Ray. Users can enable and disable the OpenTelemetry Lambda extension for their Lambda function without changing the code.
We can trace the end-to-end path even when the call passes through managed services like AWS Step Functions, Amazon API Gateway, and AWS AppSync. ADOT works in conjunction with applications instrumented with the AWS X-Ray SDK. In addition to collecting the Lambda function performance data, we also automatically collect resource-specific information from the function, such as Lambda function name, Amazon Resource Name (ARN), function version, and other parameters that would help connect the application performance data with the infrastructure performance workflow.
Getting started with tracing
To try out ADOT with tracing Lambda functions in Python Lambda Runtime, building the Lambda layer and enabling auto-instrumentation for Lambda function are required steps.
Launching OpenTelemetry Collector in AWS Lambda environment needs the help of AWS Lambda Extensions. Lambda layers users can use this environment directly. The layers embed both the Collector (as a Lambda extension) and Python SDK, so Lambda users can onboard OpenTelemetry with this solution out of the box.
Step 1: You can use any existing AWS Lambda application with Python v3.8 runtime or download a sample application. Prerequisites to run this sample project include having the AWS CLI, AWS SAM CLI, and Docker running on your worker node. Let’s start building.
Install AWS CLI.
Run aws configure to set credentials (with administrator permissions) and default region.
Install Docker.
Install AWS SAM CLI.
Step 2: Install GitHub to clone the repo $ sudo yum install git -y or download the code from GitHub Console.
Sample execution—This command will compile the ADOT layer and sample app locally and publish them in your AWS account.
This execution will create an AWS Lambda sample application and ADOT layer in the us-west-2 region. Part of this execution will enable auto-instrumentation for the sample Lambda function.
Step 3: Navigate to the AWS Console and check new Lambda Application with the name adot-py38-sample. Next, go to Lambda Functions, open function adot-py38-sample-function, and select Layers.
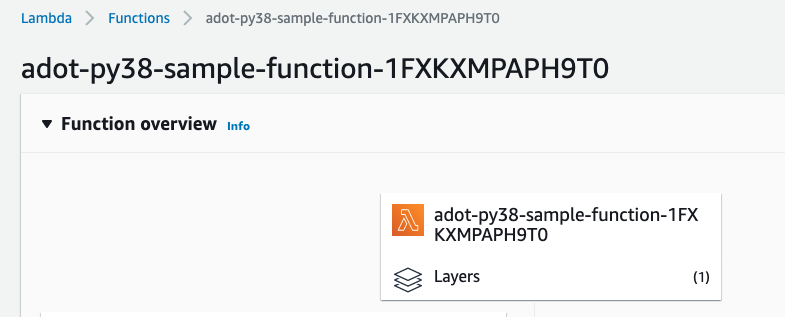
The following screenshot shows layer details, and the ADOT layer can be found under Layers.


To compile and publish only the ADOT layer in the AWS account, run run.sh -t layer.yml.
Step 4: To enable tracing using ADOT for the Lambda function, follow these steps via AWS Console:
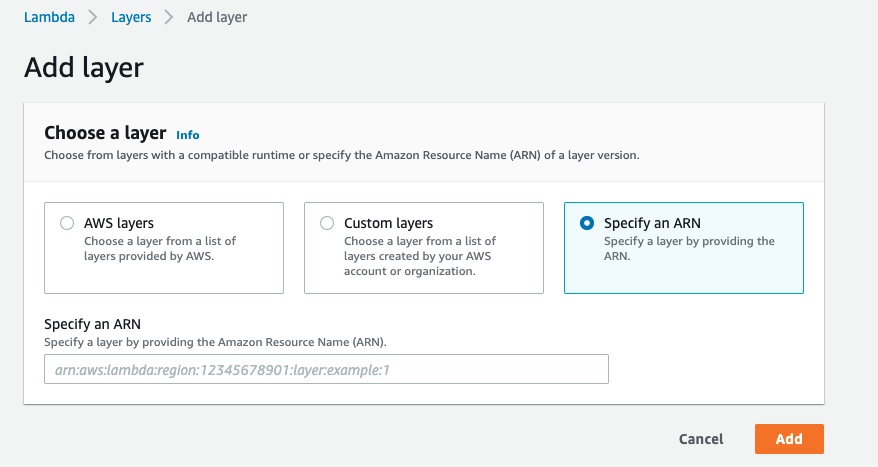
Add the ADOT Lambda layer. Open the Lambda function you intend to instrument in the AWS console. In the Layers in Designer section, choose Add a layer. When asked to specify an ARN, enter the layer ARN, and then choose Add. Or, we can select Custom layers and select the layer from the drop-down menu with the latest version.

Add the environment variable AWS_LAMBDA_EXEC_WRAPPER = /opt/python/adot-instrument to the Lambda function under Configuration, Environment variables.

Enable Active Tracing in the Lambda function under Configuration, Monitoring and operations tools.

Step 5: Invoke the Sample App with Test event.

Step 6: Select the Monitor tab to see HTTP request and AWS SDK request are instrumented.
The following is an AWS X-Ray Service Map showing trace requested by sample application.

Step 7: Click on the trace ID in Lambda Monitor console tab, which will redirect us to X-Ray console. Or, we can open AWS X-Ray console and click the latest trace ID to see Service Map, Analytics, and X-Ray Insights to detect issues.

AWS X-Ray Service Map showing error trace:


Here is another IoT sample application that includes AWS Step Functions, AWS Lambda, Amazon DynamoDB, and Amazon Connect. I have followed Step 4 to enable the AWS Distro for OpenTelemetry in Lambda function, configured and added the layer, and then enabled tracing. I have enabled tracing for Step Functions as well.

Under Step Functions, State machines execution status, select the X-Ray trace map to check the trace details. AWS X-Ray Service Map showing trace requested by IOT sample application:


In case of Step Functions execution failure, we can select the failed trace ID under state machines to check the details:

AWS X-Ray Service Map showing error trace and details related to the error in the trace:

Cleaning up
To clean up, open the AWS CloudFormation console and clear the sample resources by selecting Delete stack adot-py38-sample.
Conclusion
In this blog post, we walked through setting up ADOT with AWS Lambda support to collect and send trace data to AWS X-Ray without having to change any existing code. To learn more, check out the OpenTelemetry membership page. Join the discussions, test new features, and contribute your ideas and experience. To learn more about AWS Distro for OpenTelemetry, visit our developer portal.