AWS Security Blog
How to visualize Amazon Security Lake findings with Amazon QuickSight
Part 2 of a 3-part series
In this post, we expand on the earlier blog post Ingest, transform, and deliver events published by Amazon Security Lake to Amazon OpenSearch Service, and show you how to query and visualize data from Amazon Security Lake using Amazon Athena and Amazon QuickSight. We also provide examples that you can use in your own environment to visualize your data. This post is the second in a multi-part blog series on visualizing data in QuickSight and provides an introduction to visualizing Security Lake data using QuickSight. The first post in the series is Aggregating, searching, and visualizing log data from distributed sources with Amazon Athena and Amazon QuickSight.
With the launch of Amazon Security Lake, it’s now simpler and more convenient to access security-related data in a single place. Security Lake automatically centralizes security data from cloud, on-premises, and custom sources into a purpose-built data lake stored in your account, and removes the overhead related to building and scaling your infrastructure as your data volumes increase. With Security Lake, you can get a more complete understanding of your security data across your entire organization. You can also improve the protection of your workloads, applications, and data.
Security Lake has adopted the Open Cybersecurity Schema Framework (OCSF), an open standard. With OCSF support, the service can normalize and combine security data from AWS and a broad range of enterprise security data sources. Using the native ingestion capabilities of the service to pull in AWS CloudTrail, Amazon Route 53, VPC Flow Logs, or AWS Security Hub findings, ingesting supported third-party partner findings, or ingesting your own security-related logs, Security Lake provides an environment in which you can correlate events and findings by using a broad range of tools from the AWS and APN partner community.
Many customers have already deployed and maintain a centralized logging solution using services such as Amazon OpenSearch Service or a third-party security information and event management (SIEM) tool, and often use business intelligence (BI) tools such as Amazon QuickSight to gain insights into their data. With Security Lake, you have the freedom to choose how you analyze this data. In some cases, it may be from a centralized team using OpenSearch or a SIEM tool, and in other cases it may be that you want the ability to give your teams access to QuickSight dashboards or provide specific teams access to a single data source with Amazon Athena.
Before you get started
To follow along with this post, you must have:
- A basic understanding of Security Lake, Athena, and QuickSight
- Security Lake already deployed and accepting data sources
- An existing QuickSight deployment that can be used to visualize Security Lake data, or an account where you can sign up for QuickSight to create visualizations
Accessing data
Security Lake uses the concept of data subscribers when it comes to accessing your data. A subscriber consumes logs and events from Security Lake, and supports two types of access:
- Data access — Subscribers can directly access Amazon Simple Storage Service (Amazon S3) objects and receive notifications of new objects through a subscription endpoint or by polling an Amazon Simple Queue Service (Amazon SQS) queue. This is the architecture typically used by tools such as OpenSearch Service and partner SIEM solutions.
- Query access — Subscribers with query access can directly query AWS Lake Formation tables in your S3 bucket by using services like Athena. Although the primary query engine for Security Lake is Athena, you can also use other services that integrate with AWS Glue, such as Amazon Redshift Spectrum and Spark SQL.
In the sections that follow, we walk through how to configure cross-account sharing from Security Lake to visualize your data with QuickSight, and the associated Athena queries that are used. It’s a best practice to isolate log data from visualization workloads, and we recommend using a separate AWS account for QuickSight visualizations. A high-level overview of the architecture is shown in Figure 1.
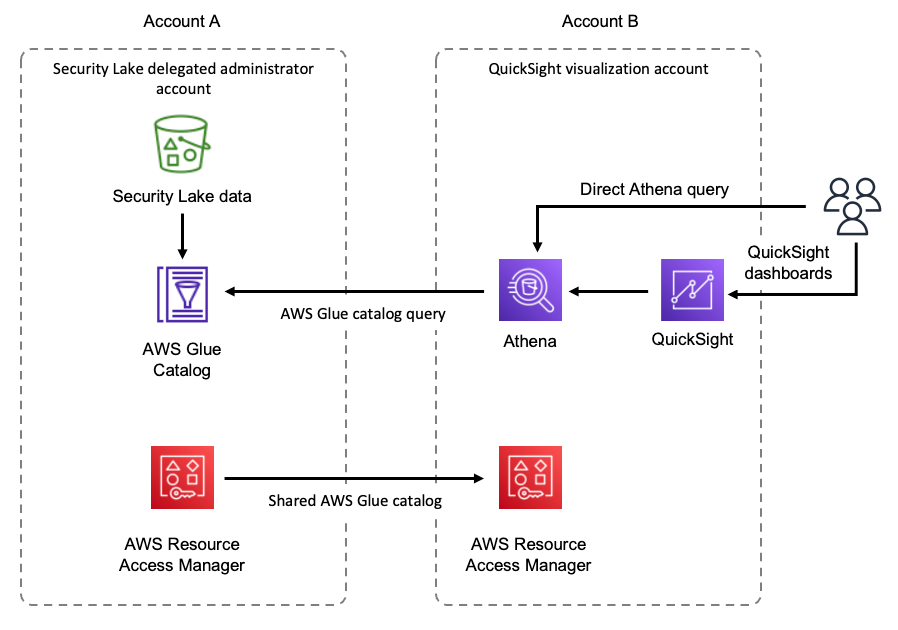
Figure 1: Security Lake visualization architecture overview
In Figure 1, Security Lake data is being cataloged by AWS Glue in account A. This catalog is then shared to account B by using AWS Resource Access Manager. Users in account B are then able to directly query the cataloged Security Lake data using Athena, or get visualizations by accessing QuickSight dashboards that use Athena to query the data.
Configure a Security Lake subscriber
The following steps guide you through configuring a Security Lake subscriber using the delegated administrator account.
To configure a Security Lake subscriber
- Sign in to the AWS Management Console and navigate to the Amazon Security Lake console in the Security Lake delegated administrator account. In this post, we’ll call this Account A.
- Go to Subscribers and choose Create subscriber.
- On the Subscriber details page, enter a Subscriber name. For example, cross-account-visualization.
- For Log and event sources, select All log and event sources. For Data access method, select Lake Formation.
- Add the Account ID for the AWS account that you’ll use for visualizations. In this post, we’ll call this Account B.
- Add an External ID to configure secure cross-account access. For more information, see How to use an external ID when granting access to your AWS resources to a third party.
- Choose Create.
Security Lake creates a resource share in your visualizations account using AWS Resource Access Manager (AWS RAM). You can view the configuration of the subscriber from Security Lake by selecting the subscriber you just created from the main Subscribers page. It should look like Figure 2.
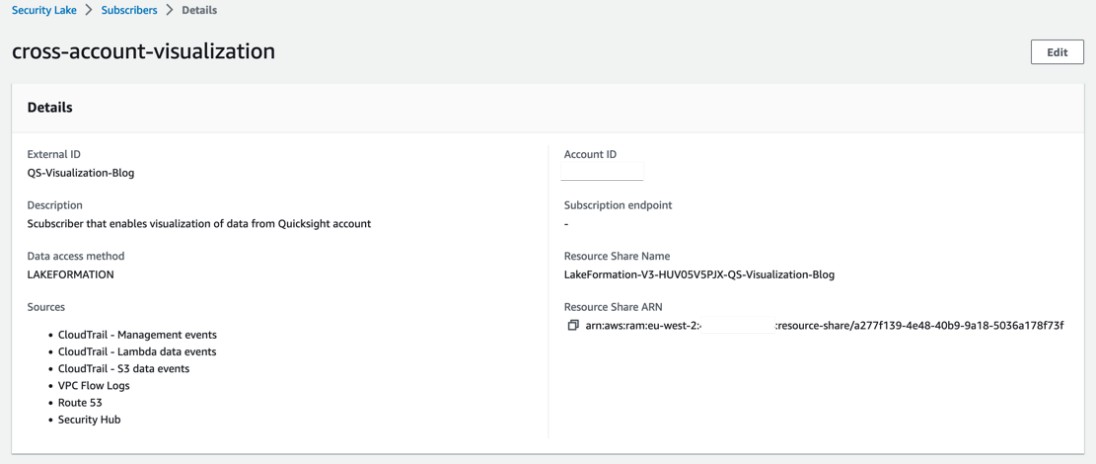
Figure 2: Subscriber configuration
Note: your configuration might be slightly different, based on what you’ve named your subscriber, the AWS Region you’re using, the logs being ingested, and the external ID that you created.
Configure Athena to visualize your data
Now that the subscriber is configured, you can move on to the next stage, where you configure Athena and QuickSight to visualize your data.
Note: In the following example, queries will be against Security Hub findings, using the Security Lake table in the ap-southeast-2 Region. If necessary, change the table name in your queries to match the Security Lake Region you use in the following configuration steps.
To configure Athena
- Sign in to your QuickSight visualization account (Account B).
- Navigate to the AWS Resource Access Manager (AWS RAM) console. You’ll see a Resource share invitation under Shared with me in the menu on the left-hand side of the screen. Choose Resource shares to go to the invitation.

Figure 3: RAM menu
- On the Resource shares page, select the name of the resource share starting with LakeFormation-V3, and then choose Accept resource share. The Security Lake Glue catalog is now available to Account B to query.
- For cross-account access, you should create a database to link the shared tables. Navigate to Lake Formation, and then under the Data catalog menu option, select Databases, then select Create database.
- Enter a name, for example security_lake_visualization, and keep the defaults for all other settings. Choose Create database.

Figure 4: Create database
- After you’ve created the database, you need to create resource links from the shared tables into the database. Select Tables under the Data catalog menu option. Select one of the tables shared by Security Lake by selecting the table’s name. You can identify the shared tables by looking for the ones that start with amazon_security_lake_table_.
- From the Actions dropdown list, select Create resource link.

Figure 5: Creating a resource link
- Enter the name for the resource link, for example amazon_security_lake_table_ap_southeast_2_sh_findings_1_0, and then select the security_lake_visualization database created in the previous steps.
- Choose Create. After the links have been created, the names of the resource links will appear in italics in the list of tables.
- You can now select the radio button next to the resource link, select Actions, and then select View data under Table. This takes you to the Athena query editor, where you can now run queries on the shared Security Lake tables.

Figure 6: Viewing data to query
To use Athena for queries, you must configure an S3 bucket to store query results. If this is the first time Athena is being used in your account, you’ll receive a message saying that you need to configure an S3 bucket. To do this, choose Edit settings in the information notice and follow the instructions.
- In the Editor configuration, select AwsDataCatalog from the Data source options. The Database should be the database you created in the previous steps, for example security_lake_visualization.
- After selecting the database, copy the query that follows and paste it into your Athena query editor, and then choose Run. This runs your first query to list 10 Security Hub findings:

Figure 7: Athena data query editor
This queries Security Hub data in Security Lake from the Region you specified, and outputs the results in the Query results section on the page. For a list of example Security Lake specific queries, see the AWS Security Analytics Bootstrap project, where you can find example queries specific to each of the Security Lake natively ingested data sources.
- To build advanced dashboards, you can create views using Athena. The following is an example of a view that lists 100 findings with failed checks sorted by created_time of the findings.
- You can now query the view to list the first 10 rows using the following query.
Create a QuickSight dataset
Now that you’ve done a sample query and created a view, you can use Athena as the data source to create a dataset in QuickSight.
To create a QuickSight dataset
- Sign in to your QuickSight visualization account (also known as Account B), and open the QuickSight console.
- If this is the first time you’re using QuickSight, you need to sign up for a QuickSight subscription.
- Although there are multiple ways to sign in to QuickSight, we used AWS Identity and Access Management (IAM) based access to build the dashboards. To use QuickSight with Athena and Lake Formation, you first need to authorize connections through Lake Formation.
- When using cross-account configuration with AWS Glue Catalog, you also need to configure permissions on tables that are shared through Lake Formation. For a detailed deep dive, see Use Amazon Athena and Amazon QuickSight in a cross-account environment. For the use case highlighted in this post, use the following steps to grant access on the cross-account tables in the Glue Catalog.
- In the AWS Lake Formation console, navigate to the Tables section and select the resource link for the table, for example amazon_security_lake_table_ap_southeast_2_sh_findings_1_0.
- Select Actions. Under Permissions, select Grant on target.
- For Principals, select SAML users and groups, and then add the QuickSight user’s ARN captured in step 2 of the topic Authorize connections through Lake Formation.
- For the LF-Tags or catalog resources section, use the default settings.
- For Table permissions, choose Select for both Table Permissions and Grantable Permissions.
- Choose Grant.

Figure 8: Granting permissions in Lake Formation
- After permissions are in place, you can create datasets. You should also verify that you’re using QuickSight in the same Region where Lake Formation is sharing the data. The simplest way to determine your Region is to check the QuickSight URL in your web browser. The Region will be at the beginning of the URL. To change the Region, select the settings icon in the top right of the QuickSight screen and select the correct Region from the list of available Regions in the drop-down menu.
- Select Datasets, and then select New dataset. Select Athena from the list of available data sources.
- Enter a Data source name, for example security_lake_visualizations, and leave the Athena workgroup as [primary]. Then select Create data source.
- Select the tables to build your dashboards. On the Choose your table prompt, for Catalog, select AwsDataCatalog. For Database, select the database you created in the previous steps, for example security_lake_visualization. For Table, select the table with the name starting with amazon_security_lake_table_. Choose Select.

Figure 9: Selecting the table for a new dataset
- On the Finish dataset creation prompt, select Import to SPICE for quicker analytics. Choose Visualize.
- In the left-hand menu in QuickSight, you can choose attributes from the data set to add analytics and widgets.
After you’re familiar with how to use QuickSight to visualize data from Security Lake, you can create additional datasets and add other widgets to create dashboards that are specific to your needs.
AWS pre-built QuickSight dashboards
So far, you’ve seen how to use Athena manually to query your data and how to use QuickSight to visualize it. AWS Professional Services is excited to announce the publication of the Data Visualization framework to help customers quickly visualize their data using QuickSight. The repository contains a combination of CDK tools and scripts that can be used to create the required AWS objects and deploy basic data sources, datasets, analysis, dashboards, and the required user groups to QuickSight with respect to Security Lake. The framework includes three pre-built dashboards based on the following personas.
| Persona | Role description | Challenges | Goals |
| CISO/Executive Stakeholder | Owns and operates, with their support staff, all security-related activities within a business; total financial and risk accountability |
|
|
| Security Data Custodian | Aggregates all security-related data sources while managing cost, access, and compliance |
|
|
| Security Operator/Analyst | Uses security tooling to monitor, assess, and respond to security-related events. Might perform incident response (IR), threat hunting, and other activities. |
|
|
After deploying through the CDK, you will have three pre-built dashboards configured and available to view. Once deployed, each of these dashboards can be customized according to your requirements. The Data Lake Executive dashboard provides a high-level overview of security findings, as shown in Figure 10.
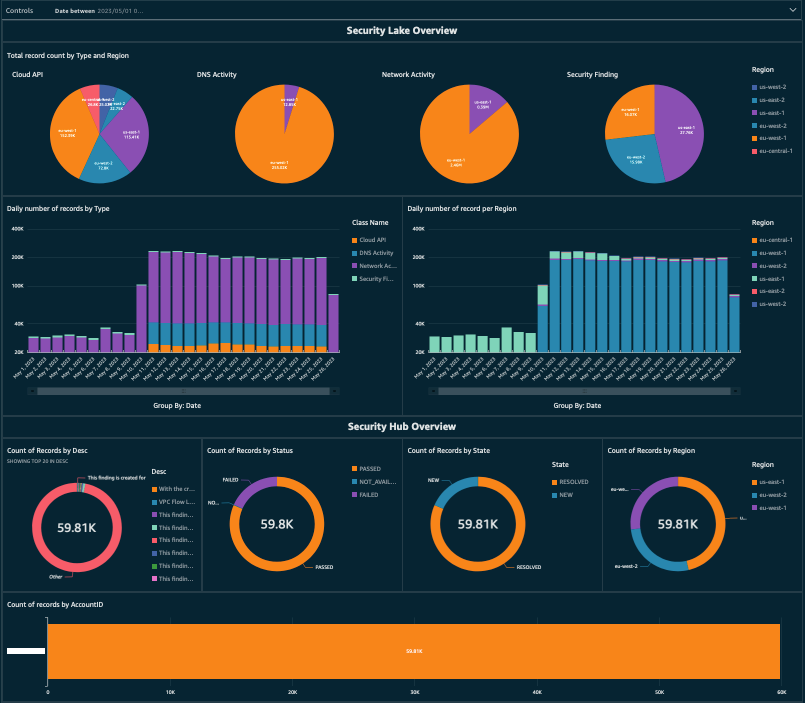
Figure 10: Example QuickSight dashboard showing an overview of findings in Security Lake
The Security Lake custodian role will have visibility of security related data sources, as shown in Figure 11.
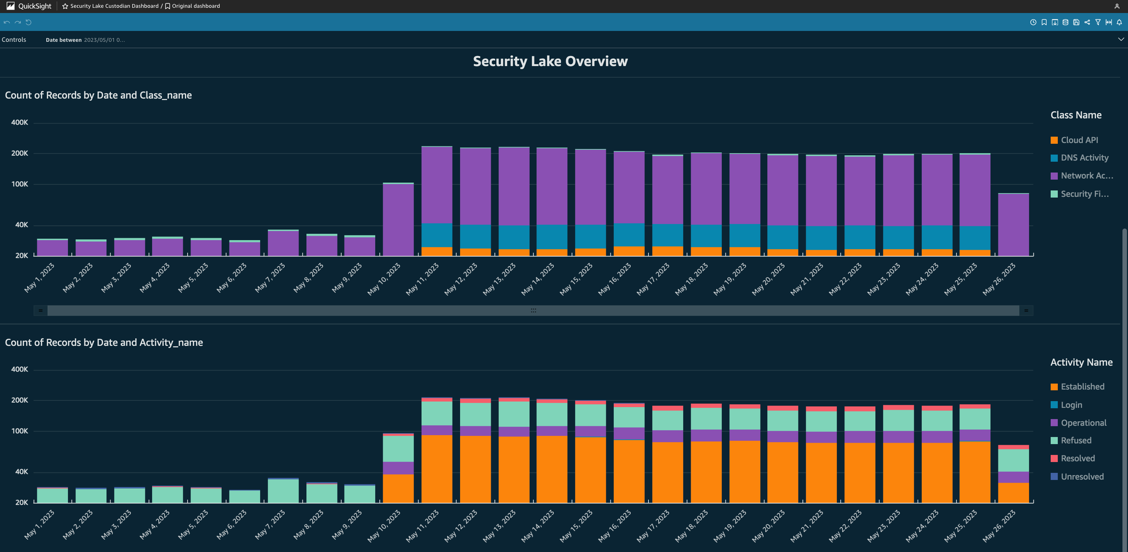
Figure 11: Security Lake custodian dashboard
And the Security Lake operator will have a view of security related events, as shown in Figure 12.
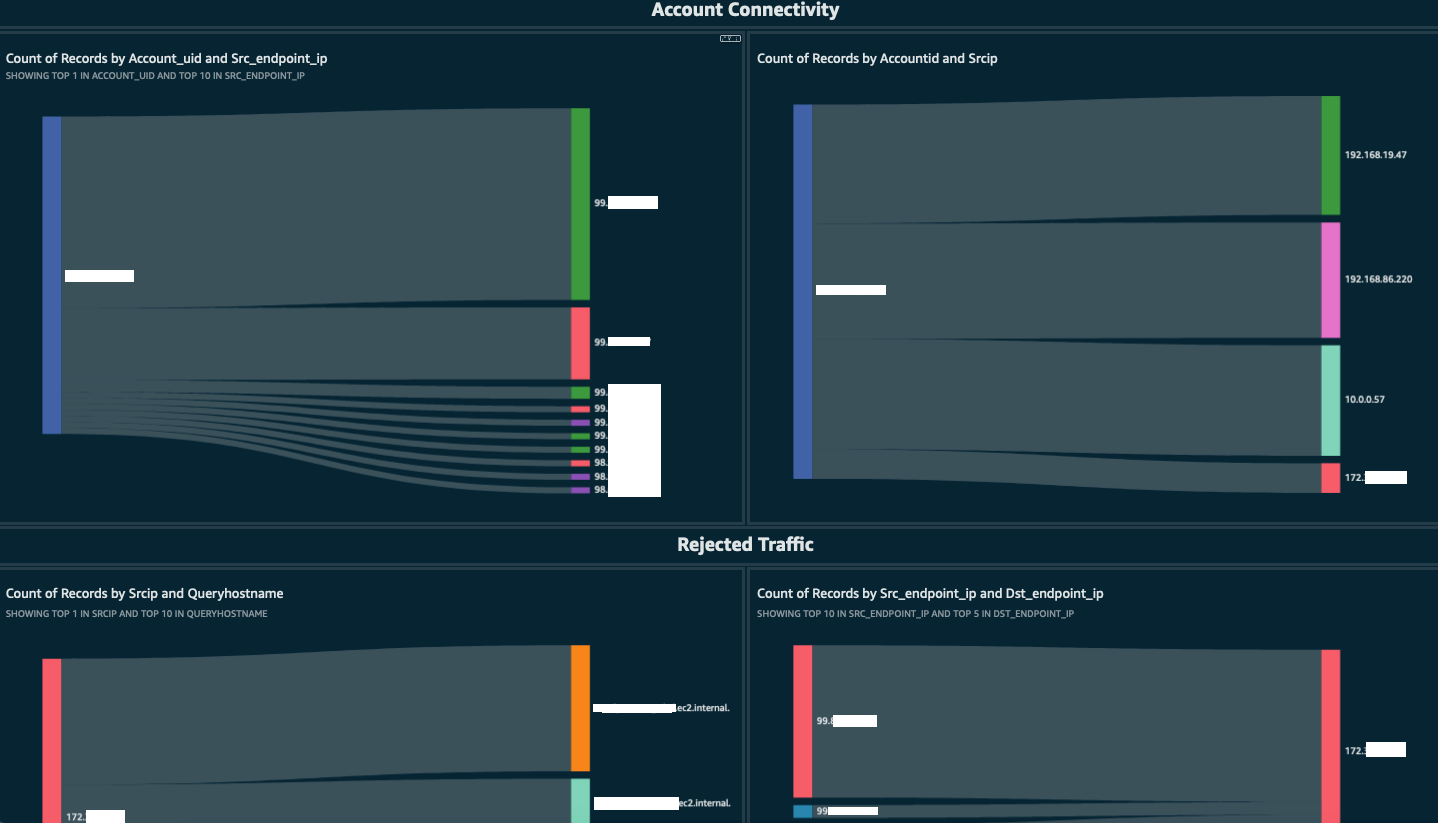
Figure 12: Security Operator dashboard
Conclusion
In this post, you learned about Security Lake, and how you can use Athena to query your data and QuickSight to gain visibility of your security findings stored within Security Lake. When using QuickSight to visualize your data, it’s important to remember that the data remains in your S3 bucket within your own environment. However, if you have other use cases or wish to use other analytics tools such as OpenSearch, Security Lake gives you the freedom to choose how you want to interact with your data.
We also introduced the Data Visualization framework that was created by AWS Professional Services. The framework uses the CDK to deploy a set of pre-built dashboards to help get you up and running quickly.
With the announcement of AWS AppFabric, we’re making it even simpler to ingest data directly into Security Lake from leading SaaS applications without building and managing custom code or point-to-point integrations, enabling quick visualization of your data from a single place, in a common format.
For additional information on using Athena to query Security Lake, have a look at the AWS Security Analytics Bootstrap project, where you can find queries specific to each of the Security Lake natively ingested data sources. If you want to learn more about how to configure and use QuickSight to visualize findings, we have hands-on QuickSight workshops to help you configure and build QuickSight dashboards for visualizing your data.
If you have feedback about this post, submit comments in the Comments section below. If you have questions about this post, contact AWS Support.
Want more AWS Security news? Follow us on Twitter.