AWS Storage Blog
Monitor data transfer costs related to Amazon S3 Replication
UPDATE (2/10/2022): Amazon S3 Batch Replication launched on 2/8/2022, allowing you to replicate existing S3 objects and synchronize your S3 buckets. See the S3 User Guide for additional details.
In this post, we will review how to monitor the cost and usage details of Amazon S3 Replication for use-cases such as compliance, disaster recovery, or data sovereignty.
In Amazon Simple Storage Service (Amazon S3), you can automatically and asynchronously replicate data to a different bucket in another AWS Region by using Cross-Region Replication (CRR) or across buckets within the same AWS Region by using Same-Region Replication (SRR). Together, SRR and CRR form Amazon S3 Replication to deliver enterprise-class replication features such as cross-account replication for protection against accidental deletion and replication to any Amazon S3 storage class.
CRR helps you meet compliance requirements and minimize latency by keeping copies of your data in different geographical locations. SRR helps you configure live replication between developer and test accounts, and to meet data sovereignty laws. In either configuration, Amazon S3 replicates all objects in the source bucket to a destination bucket, or optionally a subset of objects. In both CRR or SRR, you can use prefixes and tags to control the data that can be replicated.
The challenge arises in how to monitor your cost and usage specific to Amazon S3 Replication as part of a larger project or a specific use case (for example, compliance, disaster recovery).
Users can use AWS Cost and Usage Report to list AWS usage for each service category used by an account and its AWS Identity and Access Management (IAM) user in hourly or daily line items.
This post walks you through:
- How to filter your cost and usage report for fields relevant to monitoring cost and usage of CRR and SRR in Amazon S3.
- Setting up optimal visuals in Amazon QuickSight based on relevant Amazon S3 fields for rich interactive data visualizations and analytics on CRR and SRR activity.
Getting started with the AWS Cost and Usage Reports and Query using Athena
We will start by creating a new bucket in S3 and use it to Cost and Storage data. The data is stored in Parquet format and partitioned automatically by month and year. Customers can create IAM policies to restrict the access to data. Once ready, you must create the AWS Cost and Usage Report from within the Billing and Cost Management console. For more information, see Creating an AWS Cost and Usage Report.
To use Athena, you must set up an AWS Glue crawler, an AWS Glue database, and an AWS Lambda event. Billing and Cost Management provides an AWS CloudFormation template that does this setup for you. See the documentation on Getting Started with Athena. Furthermore, review the following blog for more information on how to Query your AWS Cost and Usage Report using Amazon Athena and details on the CloudFormation template.
Use AWS Cost and Usage report to monitor S3 SRR and S3 CRR activity
The AWS Cost and Usage Report contains the most comprehensive set of AWS cost and usage data available, including additional metadata about AWS services and pricing. Each report contains 100+ columns. To monitor cost and usage specific to Amazon S3 Replication, here are columns to filter on:
Filter ‘product_servicecode’ to only include:
- AWSDataTransfer
- Amazon S3
Filter ‘line_item_operation’ to only include:
- PutObjectForRepl
- GetObjectForRepl
- UploadPartForRepl
- InitiateMultipartUploadForRepl
- CompleteMultipartUploadForRepl
- StandardStorage
Furthermore, we recommend you tag the source and target S3 buckets with the same Key and Value (for example, Key: ReplicationRule, Value: Project_DR). We will be using these tags to filter based on tag (resource_tags_user_x). Be sure to activate the tag in Cost Allocation Tags in Billing.
These filters will allow you to set up a dashboard to visual the cost and usage by tag, by operation, by resource, and by product_family (for example, API Request, Data Transfer, or Storage).
Set up visuals in Amazon QuickSight for rich interactive analytics
We will be using Athena to analyze data from S3 and Amazon QuickSight to visualize the data. Where Athena makes it easy to analyze data in Amazon S3 using standard SQL, Amazon QuickSight makes it easy to visualize the data. As a fully managed service, QuickSight lets you easily create and publish interactive dashboards that include ML Insights. Dashboards can then be accessed from any device, and embedded into your applications, portals, and websites. In this section, we walk through setting up dashboards to visualize cost and usage of Amazon S3 Replication, broken down by API Requests, Data Transfer, and Storage.
First, you must set up Athena as a data source for QuickSight. See the documentation for help with Creating a dataset Using Athena Data, Preparing datasets, and Working with Analyses.
We can prepare the data in two manners:
- Narrow the number of fields available to make visuals by only selecting relevant fields.
- Filter the fields based on recommendations listed in this blog post above.
We will focus on filtering the data, but you should review the multitude of ways to prepare data.
On the data preparation page, expand the Filters pane. For more information on filtering a dataset, see Adding a Text Filter.
Apply the following filters:
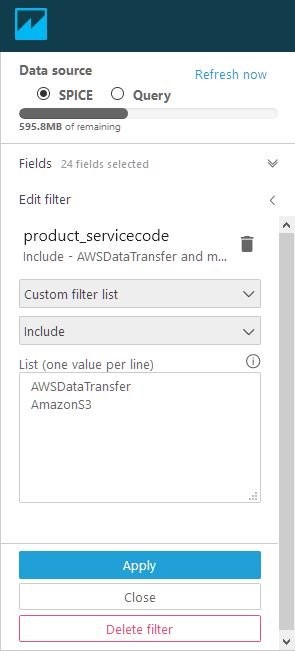
- Filter: product_servicecode
- Custom Filter List
- Include
- List (one value per line):
- AWSDataTransfer
- Amazon S3
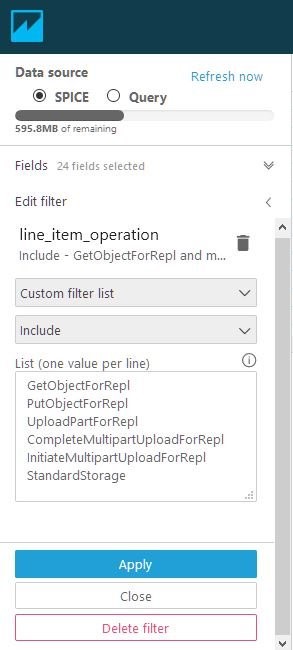
- Filter: line_item_operation
- Custom Filter List
- Include
- List (one value per line):
- GetObjectForRepl
- PutObjectForRepl
- UploadPartForRepl
- CompleteMultipartUploadForRepl
- InitiateMultipartUploadForRepl
- StandardStorage
To build an analysis, select Save and Visualize at the top. Here are some example visuals.
Use a Pivot Table with the following field wells:
- Rows: line_item_usage_start_date (aggregated by month)
- Columns: product_product_family
- Values: line_item_unblended_cost (aggregated as a Sum)
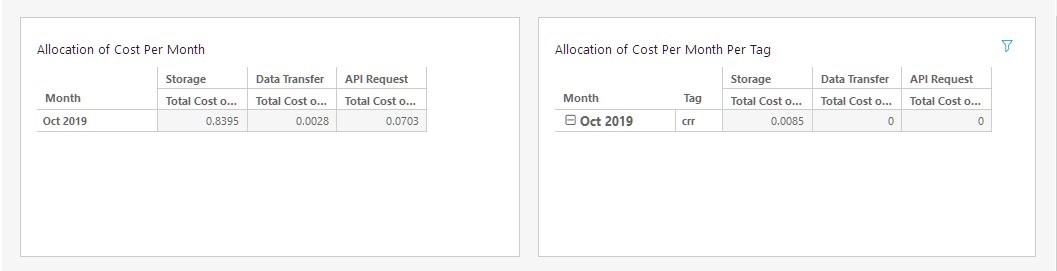
Here are some recommendations for visuals:
- pivot table by Product Family
- Add table calculations to Pivot Tables to see running sum over time by tag
- Filter by tags, resource id (S3 Bucket)
Pricing
With AWS, you pay only for the individual services you need, for as long as you use them, and without requiring long-term contracts or complex licensing. AWS will be charging for the following items:
- S3 Standard Storage for Source and Destination Bucket.
- API call charges for PUT requests
- Egress charges from Source bucket and Ingress charges to Target Bucket (for CRR)
Pricing for requests and interregion data transfers are based on the source AWS Region. For most up-to-date information, see the pricing page for Amazon S3 Replication Pricing.
Example pricing:
Source S3 bucket (N. Virginia): 100 GB
Destination Region: US West (N. California)
Number replication PUT requests at destination: 100
S3 Standard storage cost for source: 100 GB * $0.023 = $2.30
S3 Standard storage cost for replicated data at destination: 100 GB * $0.023 = $2.30
Data transfer: 100 GB * $0.02 (per GB data transferred) = $2.00
Price per PUT request: $0.005 (per 1000 requests) / 1000 = $0.000005
Replication PUT requests: 100 * $0.000005 = $0.0005
Total: $2.30 + $2.30 + $2.00 + $0.0005 = $6.6005
Conclusion
AWS supplies users with the tools to help you access, organize, understand, control, and optimize your AWS costs and usage. Furthermore, you can integrate the tools with the most comprehensive, secure, scalable, and cost-effective portfolio of services to build your custom analytics solutions.
If you have any questions or suggestions, leave your feedback in the comment section. If you need any further assistance on monitoring and analyzing your AWS activity, contact your AWS account team or a trusted APN Partner.
For more information, see the AWS Cost and Usage Report page or the AWS Cost and Usage Report User Guide.