AWS Database Blog
Monitoring your security with GuardDuty in real time with Amazon Elasticsearch Service
September 8, 2021: Amazon Elasticsearch Service has been renamed to Amazon OpenSearch Service. See details.
When you use Amazon GuardDuty to help you protect your AWS accounts and workloads, you can enhance your ability to quickly search and visualize a large amount of data. In an enterprise, you might be analysing activity from thousands of accounts. After the analysis, your security team needs to be alerted in order to take corrective action. Timing is crucial.
By combining GuardDuty with Amazon Elasticsearch Service and data visualization, you can convert data into actionable insights. In this post, I show how to use Amazon ES to help you analyze GuardDuty findings. Also, I show how you can search, explore, and visualize your data by using Kibana, an open source data visualization plugin for Amazon ES.
Here is an overview and the steps to get started creating such resources.
Solution overview and prerequisites
A high-level flow of how this is setup is shown below and consists of the following steps.
- Collect GuardDuty findings using Amazon Cloudwatch events and AWS Lambda. Send them to an Amazon S3
- Send the logs that are delivered to the S3 bucket to Amazon ES.
- Analyze, search, or aggregate your findings in Amazon ES.
- Visualize the findings by using a Kibana dashboard.

Before you start the steps here, enable GuardDuty in the master account as outlined in this AWS blog post. The master account is where all the findings from the GuardDuty are aggregated. The master account is typically managed by your security team, and will display the findings from all the member accounts.
Step 1: Collect GuardDuty logs using AWS Lambda and send them to Amazon S3
In order to aggregate the GuardDuty logs, setup an AWS Lambda function that will collect those GuardDuty findings and store them in Amazon S3. In the Lambda function provided below, you can also send alerts or notifications to your security team by using Amazon Simple Notification Service (Amazon SNS).
Create an S3 bucket, shown below, to store the GuardDuty logs as outlined the Amazon S3 user guide. When you do this, note the Amazon Resource Name (ARN) of the bucket. It’s used later. The ARN will be of the form:
arn:aws:s3:::guarddutylogs

Add a Lambda function
- Sign in to the AWS Management Console.
- In the Compute section, choose Lambda.
- Choose Create a Function.
- Choose Author from Scratch.

- In the Author from scratch section, shown below, add these:
- Name. Enter a name for the function.
- Choose Node.js 6.10 as the runtime environment
- Role. Choose one of the following options:
- Choose an existing role. If you have any appropriate roles, select it.
- Create new role from template. If you select this option, you can continue without choosing any policy templates—it will create a role with basic Lambda execution privileges by default.
- Role Name. Enter a name for the role.
- Policy templates. If you created a new role, you can leave this blank.
- Choose Create Function.

- For the Function Code, use the code below.
- Pass in the following environment variable, shown in the image below:
GUARDDUTY_LOGS_BUCKET: Name of the S3 Bucket where the logs are delivered. Same as the one you created previously.

Create a role for the Lambda function
Your Lambda function requires the proper permissions to be able to send the GuardDuty logs to the S3 bucket. It also needs permission to send a notification to the SNS topic and to post the logs to the CloudWatch logs group.
Create a CloudWatch Events rule and target for GuardDuty
- Create a rule that enables CloudWatch to send events for all findings that GuardDuty generates. Run the following CloudWatch CLI command:
- Attach a Lambda function as a target for the rule that you created previously. Run the following CloudWatch CLI command:
- Add the permissions required to invoke the target. Run the following Lambda CLI command:
Create an Amazon ES domain
Amazon Elasticsearch Service (Amazon ES) is a managed service that makes it easy to create a domain and deploy, operate, and scale Elasticsearch clusters in the AWS Cloud. Amazon ES is a popular open-source search and analytics engine for use cases such as log analytics, real-time application monitoring, and clickstream analytics. You can use Amazon ES to analyze the GuardDuty logs and filter findings of a given type. You can also build dashboards that can be used to get a quick insights into the activity happening across different accounts.
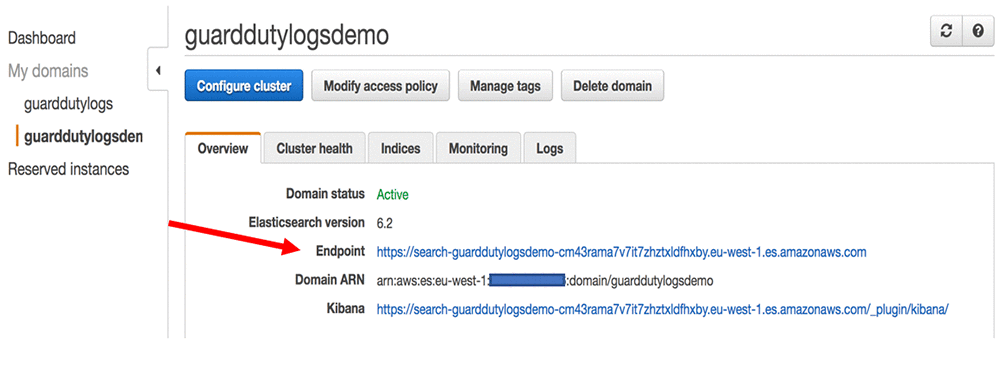
To create an Amazon ES domain, you can follow the instructions in the Amazon ES developer guide at Creating Amazon ES domains. After your Amazon ES cluster is up and running, note the endpoint as shown below.

Step 2: Send the streaming data from S3 to Amazon ES
After the data is in S3 buckets, it can serve as a repository where all the current data and the historical data reside. You can use Amazon Machine Learning to build models or use the S3 bucket as a data lake.
Load the streaming data into the Amazon ES domain from S3 buckets. Streaming data provides fresh data for analytics and dashboards. To load the streaming data, use a Lambda function as an event handler in the AWS Cloud. Whenever a GuardDuty finding is put into the S3 bucket, it can trigger an event that can then invoke a Lambda function, which runs your custom Java/Node.js/Python/C# code.
In this setup, use the Amazon S3 bucket you created earlier where all the GuardDuty findings are delivered as the event source. Follow the instructions outlined in an AWS blog post to set this up and use the code below for the Node.js 6.10 environment. Ensure that the JSON-file suffix, for the files in the S3 bucket, will trigger the Lambda function.
Elasticsearch, http-aws-es, and flat libraries were developed by a third party, not AWS. AWS is not responsible for the functioning or suitability of external content.
For the Function Code, use the code below.
Step 3: Use Amazon ES for analysis and search
After you have the data streaming into Amazon ES, you can use it for analysis and search for unexpected activity in your account. To be able to search documents in the Amazon ES domain, you can use the Amazon ES search API or you can use Kibana to search your documents. Kibana is a popular open source tool for visualization that is designed to work with Amazon ES. Amazon ES provides a default installation of Kibana with an Amazon ES domain. Follow these tasks:
- To view the GuardDuty findings, I can choose the version provided by Amazon ES service. However, that will require some extra work for the security. As a shortcut, I’ll run Kibana on my laptop and use the AWS SigV4 signing proxy, available here on github. This signing proxy was developed by a third party, not AWS. AWS is not responsible for the functioning or suitability of external content. This proxy is great for development and test, but is not suitable for production workloads. You can refer to the AWS blog post for more information.
- To use Kibana, configure at least one index pattern. These index patterns are used by Kibana to identify the indices that you want for analysis. After Kibana is open in your browser, you can see the Get Started page. Create an index pattern in order to visualize the data. Go to the Management tab and select Index Patterns. Create an index pattern. In this case, select * as a wildcard for the guarddutylogs and select Next Step. This is shown in the image below.

- In Step 2 of the Kibana process, you can also configure time filter and select a field to be able to narrow down your data by a time range. Select eventLastSeen as the Time Filter field and select Create Index Pattern as shown below.

- The Index Patterns screen shows your document fields, for example fields like type of finding, city and country from which the attack vector originated, as well as several other fields. In this case, the Lambda function above has flattened the data for easy search and analytics purposes. Choose the Discover tab to search your data.
- One of the most useful pieces of information in the data you have collected so far is type. The purpose of the finding type is to provide a concise yet readable description of the potential security issue. If you expand a document in the documents table by choosing Expand
 to the left of the document entry in the table, you will see the fields and data for that document. To display or hide a field column in the documents table, choose Toggle column in table
  . If you choose that for the type, it will load the data in a table with type as a column as shown below.

Step 4: Visualize the data using Kibana dashboard
In Kibana, you can also visualize the data that you have in your Amazon ES indices. You can then build dashboards that display related visualizations. Kibana visualizations are based on the queries that are run on Amazon ES similar to the above. By using Amazon ES aggregations to extract and process the data, you can create charts and graphs that show the spikes, dips, and trends that you’re interested in.
To get started setting up a dashboard in Kibana, do the following:
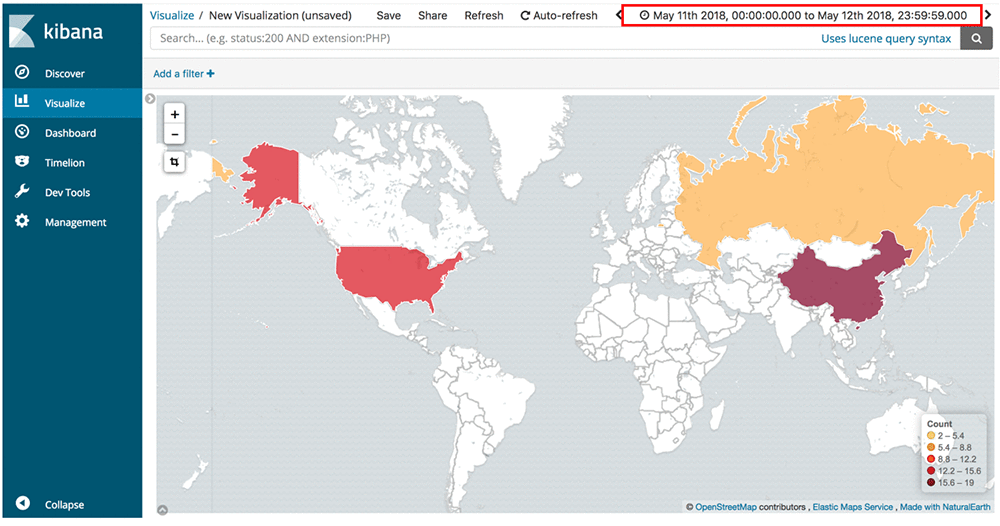
Choose Visualize in Kibana’s left navigation panel. Choose Create a Visualization + to create a new visualization and then select the Region Map under Maps. In this case, you want to see which countries are the ones where the attacks are originating. Choose the * index pattern.
In the Options panel, under Layer Settings, ensure that the Join field is selected to Country Name.
In the Data panel, follow these steps:
- Under Metrics, choose Count as the type of aggregation. This gives you total number of attack vectors that have originated from a specific country.
- Under Buckets:
- For shape field, select Terms under the Aggregation.
- For Field, select action.portProbeAction.portProbeDetails.0.remoteIpDetails.country.countryName.keyword as the field as shown below.

- For Order By select metric: Count.
- For Order choose Descending and size as 5.
- Choose Apply Changes, as shown below, which will plot those values on the map.

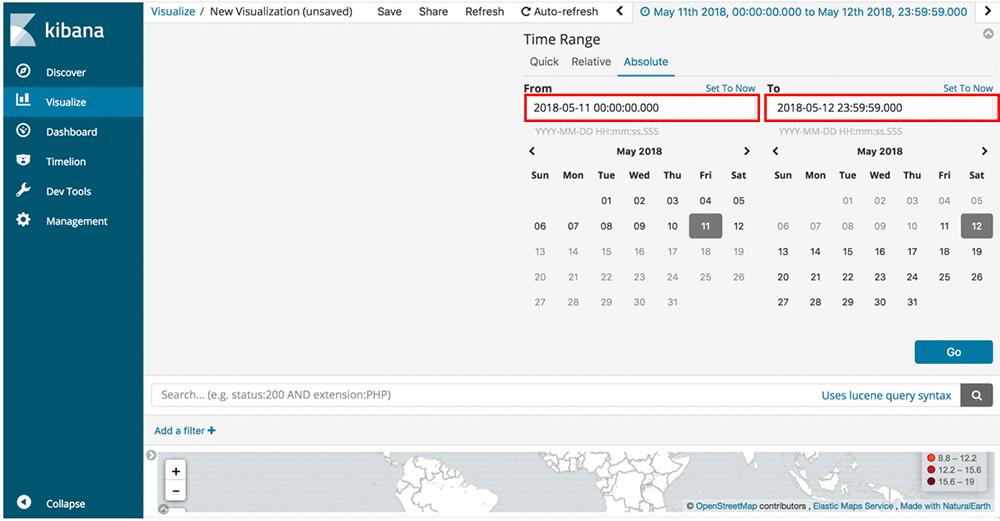
Select the time frame for which you want the logs to be taken into consideration in plotting the country values. This can be helpful to get insights into how the attacks are evolving over time as shown below.

After the changes are applied, the map is plotted. Choose Save and Save the visualization as Attack By Country.

In a similar manner, you can create another visualizations based on types of attack. An example is shown below.

Creating the GuardDuty findings dashboard
To create the dashboard in Kibana, do the following:
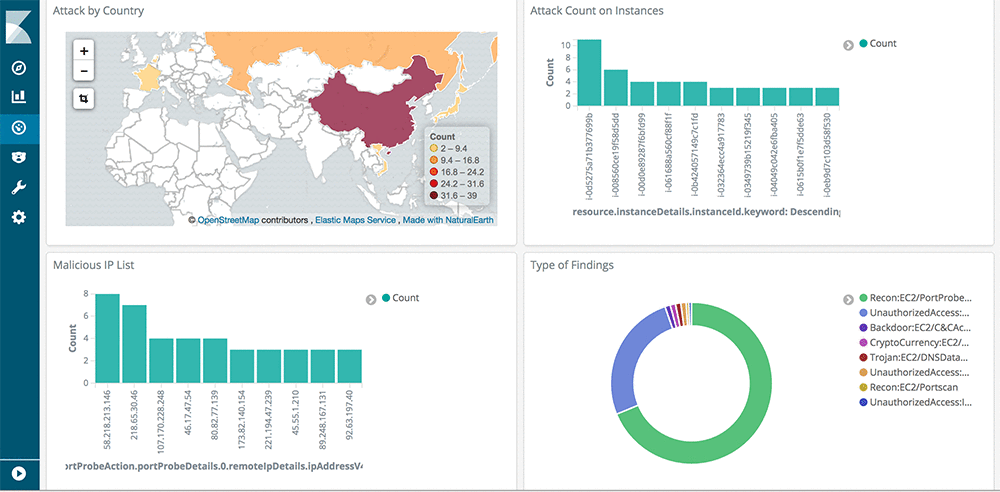
- Choose Dashboard in the left navigation panel. Choose the + sign to create new Dashboard. Choose Add in the top navigation bar, and choose the two visualizations you just created. This will add them to the Dashboard.
- Choose Save in the top navigation bar and give it a name. Choose Save again to save it.
On my dashboard as shown below, I added a couple of maps, pie charts, vertical bars to give quick insight into threat vectors happening on the account.

Conclusion
In this blog post, you saw how to use Amazon ES for aggregation, search, and analysis of GuardDuty findings. The solution helps to provide insights into potentially unauthorized and malicious activity within your AWS environment. With this information, you can decide when to take action on events that happen across any of your accounts.
If you have comments about this blog post, submit them in the “Comments” section below.
About the Author
 Rohan Raizada is a Solutions Architect for Amazon Web Services. He works with enterprises of all sizes with their cloud adoption to build scalable and secure solutions using AWS. During his free time, he likes to spend time with family and go cycling outdoors.