AWS Partner Network (APN) Blog
How to Send CloudHSM Audit Logs to Splunk and Monitor Critical Events on the HSM
By Lanre Ogunmola, Security Engineer at AWS
By Eduardo Suzuki, Sr. Cloud Support Engineer at AWS
 One common question we hear from customers is, “How do I visualize CloudHSM audits logs and generate meaningful insights?”
In this post, we’re going to show you how to send audits logs generated from CloudHSM into Splunk. We’ll also create a dashboard in Splunk that visualizes critical metrics, such as failed crypto officer login attempts, cryptographic key generation, and deletion events.
AWS CloudHSM is a cloud-based hardware security module (HSM) that enables you to easily generate, store, import, export, and manage your cryptographic keys.
It also permits hash functions to compute message digests and hash-based message authentication codes (HMACs), as well as cryptographically sign data and verify signatures on Amazon Web Services (AWS) using FIPS 140-2 Level 3 validated HSMs.
CloudHSM also provides audit logging functionality for all management commands executed on your HSM appliances. Audit logging is enabled by default and are generated on each of your HSMs, and then delivered by CloudHSM to Amazon CloudWatch on your behalf.
Examples of an event captured by audit logs include key generation, user login, key export, and user or key deletion.
This post walks through using AWS services to create a pipeline that sends HSM audit logs into Splunk. You’ll also learn how to interpret the audit events and gain specific data insights that enable you to flag critical events taking place on the CloudHSM appliance. This can include failed crypto user/officer logins, and generation and deletion of cryptographic keys material from the HSM.
Splunk is an AWS Partner Network (APN) Select Technology Partner with multiple AWS Competencies in areas like Data & Analytics, DevOps, and Security. Splunk software and cloud services enable customers to search, monitor, analyze, and visualize machine-generated big data from websites, applications, servers, networks, IoT, and mobile devices.
Splunk Dashboard Visualizing CloudHSM Audit Events
In Figure 1 below, you see a Splunk dashboard with the total number of audit events sent from the CloudHSM appliance into Splunk, the number of failed login attempts, a breakdown of commands executed on the HSM, and numbers of critical events like cryptographic key material deletion.
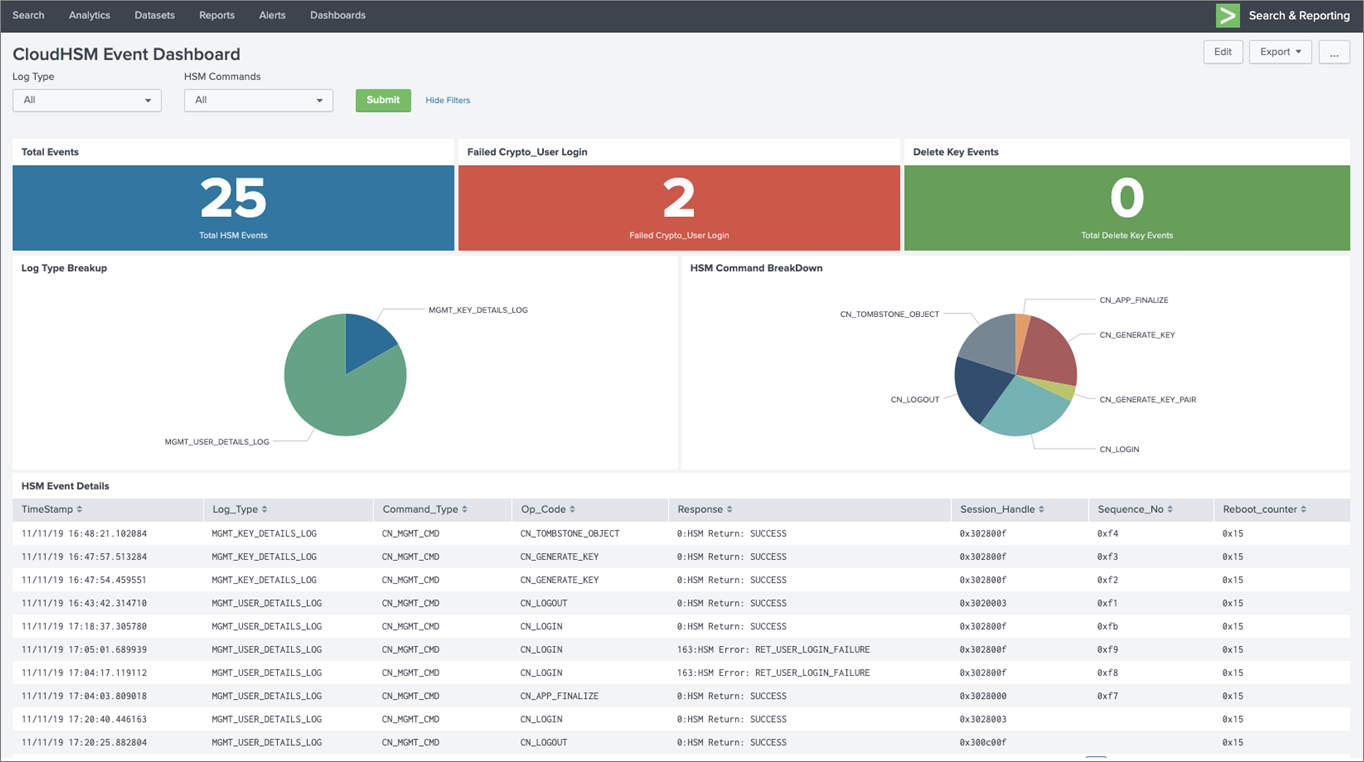
Figure 1 – CloudHSM audit events visualization using Splunk.
We will be using the following AWS services and Splunk HEC to create the pipeline that sends the HSM audit logs into Splunk:
- AWS CloudHSM: Hardware security modules on AWS that process cryptographic operations and provide secure storage for cryptographic keys. Audit logs are sent by CloudHSM to CloudWatch Logs.
- AWS Lambda: Executes your code only when needed and scales automatically, from a few requests per day to thousands per second. You can use Lambda to run your code in response to events, such as changes to data in an Amazon Simple Storage Service (Amazon S3) bucket or data input into CloudWatch Logs.
- Amazon CloudWatch Logs: Allows you to collect and store logs from your resources, applications, and services in near real-time. CloudHSM collects audit logs from all the HSMs in the cluster and posts them to CloudWatch Logs.
- Splunk HEC Cluster: Splunk has built a rich portfolio of components to access data from various applications, index huge files, and parse them to make sense out of data. Splunk developed HTTP Event Collector (HEC), which lets you send data and application events to the Splunk clusters over HTTP and secure HTTPS protocols.
Solution Overview
The referenced architecture in Figure 2 below illustrates how audit logs from the CloudHSM appliance are streamed into Splunk (Enterprise or Cloud).
This includes native delivery of audit logs from CloudHSM to CloudWatch, and a Lambda function that receives the events from CloudWatch and sends it to Splunk HEC.
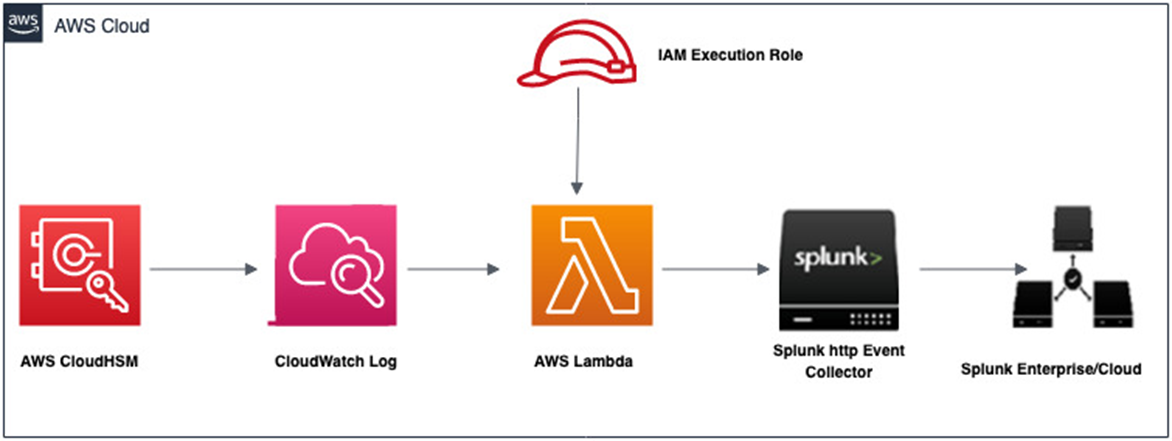
Figure 2 – Sending CloudHSM audit events to Splunk.
Here’s how the process works:
- CloudHSM collects the audit logs from the HSM appliance and posts them to CloudWatch Logs in your account.
- Audit log events are streamed into a Lambda function, which delivers the logs to the Splunk HEC.
- When data reaches Splunk, it’s ready for querying and visualization using dashboards.
Prerequisites
Visit the Getting Started with AWS CloudHSM Guide for help completing the prerequisites:
- Create a CloudHSM cluster.
- Launch an Amazon Elastic Compute Cloud (Amazon EC2) instance.
- Create an HSM.
- Initialize the CloudHSM cluster.
- Install and configure the AWS CloudHSM Client.
Deployment Steps
In this section, we’ll walk through the deployment steps to send audit events from CloudWatch Logs to Splunk and transform these events into meaningful visualized data.
- Create and configure your blueprint Lambda function.
- Configure the CloudWatch Log Group to stream HSM audit logs to your Lambda blueprint function.
- Create a Splunk dashboard to ingest and visualize audit logs.
- Trigger HSM audit events by performing key and user management operations
- Search for the HSM audit log event in Splunk and review the dashboard.
Step 1: Create and configure your blueprint Lambda function
- Sign in to the AWS Lambda Console.
- Choose Create a Function under the Get Started section.
- On the Create Function page, choose Blueprints and enter splunk-cloudwatch-logs-processor in Filter to get blueprints that process CloudWatch Logs to Splunk using the HEC.
- Select the blueprint function and click Configure.
- Provide a friendly function name and select a Lambda execution role.
- Make sure the proper permissions are applied for the AWS Identity and Access Management (IAM) role to be able to push Lambda logs into CloudWatch.
The documentation shows you how to create a role for this process, and here’s an example of the permissions policy:
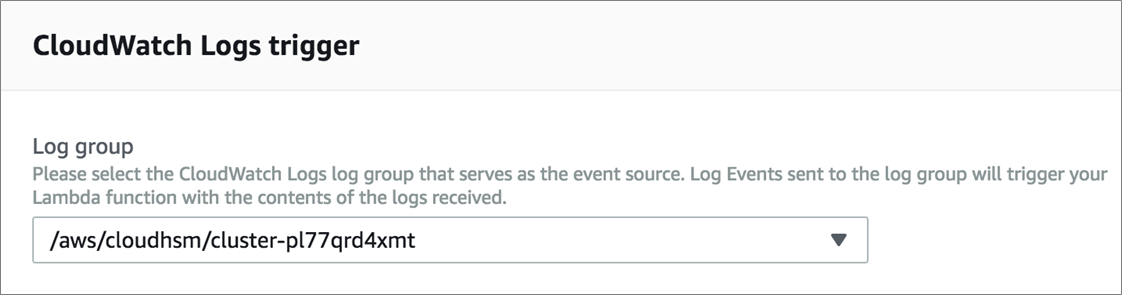
- In the CloudWatch Logs Trigger section, select the CloudWatch log group, which is the name of the cluster in your account, and provide a friendly filter name.
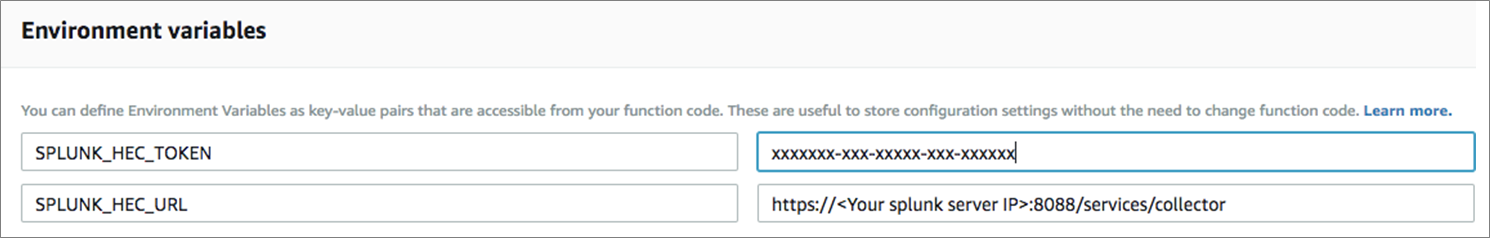
- The environment variables requires your Splunk HEC token and HEC URL. You can create an HEC token from Splunk web:
- Go to the Settings menu, choose Data Inputs, and select HTTP Event Collector.
- Choose Global Settings, ensure All Tokens is enabled, and then choose Save.
- Select New Token to create a new HEC endpoint and token.
- Provide the HEC token and HEC URL in the Lambda environment variable and click Create Function.
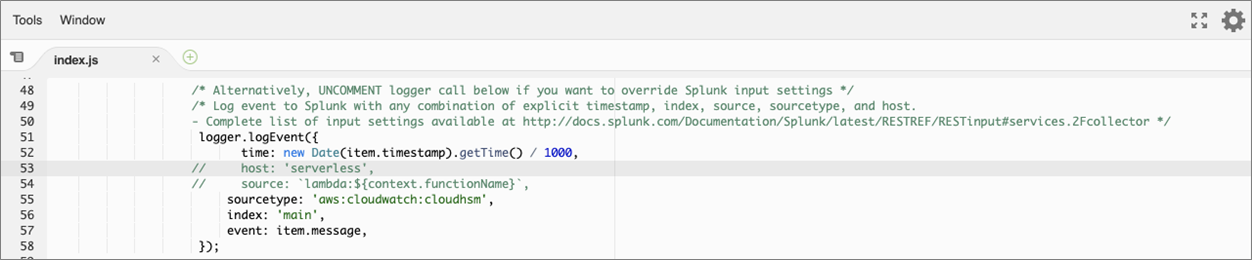
- Edit your newly-created Lambda function, and uncomment the source code as shown below.
- Provide a friendly sourcetype to override the default httpevent, uncomment time, index, event, and save.
- For demonstration purposes, we will be specifying aws:cloudwatch:cloudhsm. Note the source type specified here is what will be used in your search query in Splunk.
Step 2: Configure CloudWatch Log Group to stream HSM audit logs to Lambda
- Open the Amazon CloudWatch Console, and in the navigation pane choose Logs.
- Select the log group for your cluster. The log group name is /aws/cloudhsm/<cluster ID>.
- Click Action, and select Stream to AWS Lambda.
- Select your Lambda function created in Step 1 and click Next.
- For Log Format, select Others from the drop-down and then click Next.
- Click Start Streaming to finish.
Step 3: Create a Splunk dashboard to ingest and visualize HSM audit logs
- Create the Splunk dashboard by importing the XML file containing dashboard definitions. To do this, download the Splunk dashboard and visualizations definition XML file.
- On the Splunk Console, choose Create New Dashboard.
- Provide a Title and Description, and then click Create Dashboard.
- From the Edit Dashboard page, select Source.
- Clear the content in the display pane below and paste the content of the XML definition file you downloaded from Step 1, and click Save.
Step 4: Perform operations on HSM to trigger audit logs
You can interact with your HSM appliance using the cloudhsm_mgmt_util, key_mgmt_util, or any of the Software Developer Kit (SDK) libraries. We will use key_mgmt_util to perform cryptographic operations on the HSM.
Start by connecting to your client instance and ensure the cloudhsm-client is running. If you aren’t sure, run the start command:
Amazon Linux
$ sudo start cloudhsm-client
Windows
C:\Program Files\Amazon\CloudHSM> net.exe start AWSCloudHSMClient
Now, launch the key_mgmt_util by running this command:
$ /opt/cloudhsm/bin/key_mgmt_util
When you see the prompt, log in as a CU to create your key, replacing <USERNAME> and <PASSWORD> with an actual CU user’s username and password:
Command: loginHSM -u CU -s <USERNAME> -p <PASSWORD>
To create the key for this example, we’re going to use the key_mgmt_util to generate a symmetric key. Here’s an example:
genSymKey -t 31 -s 32 -l aes256
In the example command:
- genSymKey creates the Symmetric key.
- -t chooses the key type, which in this case is AES.
- -s states the key size, which in this case is 32 bytes.
- -l creates a label to easily recognize the key by.
Next, follow the steps below to use the CloudHSM Java library to perform operations on the HSM:
- Install the AWS CloudHSM Java library.
- Perform basic login, generate AES key, encrypt, and delete key operations using our basic functionality test.
- You can also use our sample Java code provided in Github.
Step 5: Search for HSM event in Splunk and review the dashboard
- Confirm audit logs events were streamed into Splunk. Open a search bar and execute the query:
index=main sourcetype="aws:cloudwatch:cloudhsm"
Below, you see the audit events gets displayed in Splunk when a search with sourcetype aws:cloudwatch:cloudhsm is executed.
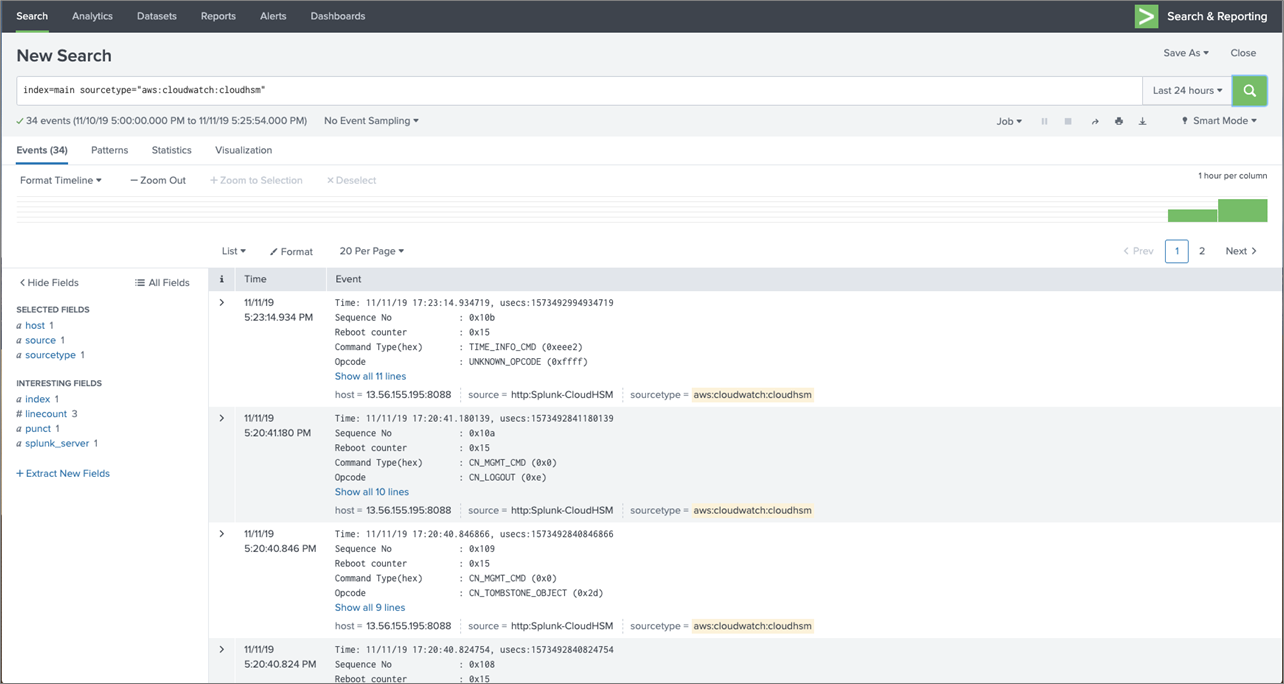
Figure 3 – Filtering events by log types.
Dashboard in Action
In this section, we’ll show you how to navigate the dashboard and filter events based on log types: MGMT_KEY_DETAIL_LOG (cryptographic operation) and MGMT_USER_DETAIL_LOG (user management operations).
- From the Splunk Console, select Dashboards on the top bar.
- Select the CloudHSM Event Dashboard from the list.

Figure 4 – Filtering events by log types.
- From the Log Type, select MGMT_USER_DETAILS_LOG and click Submit to view only the user operations. Log type MGMT_USER_DETAILS_LOG captures user related events such as login, logout, password change, delete, or create user operations.
- On the dashboard, to view only the events for HSM Command, select a command from the drop-down CN_GENERATE_KEY and click Submit to view event for symmetric keys generated. CN_GENERATE_KEY is an event recorded when asymmetric key is created on the HSM.
To learn more, see the documentation on Interpreting HSM Audit Logs.
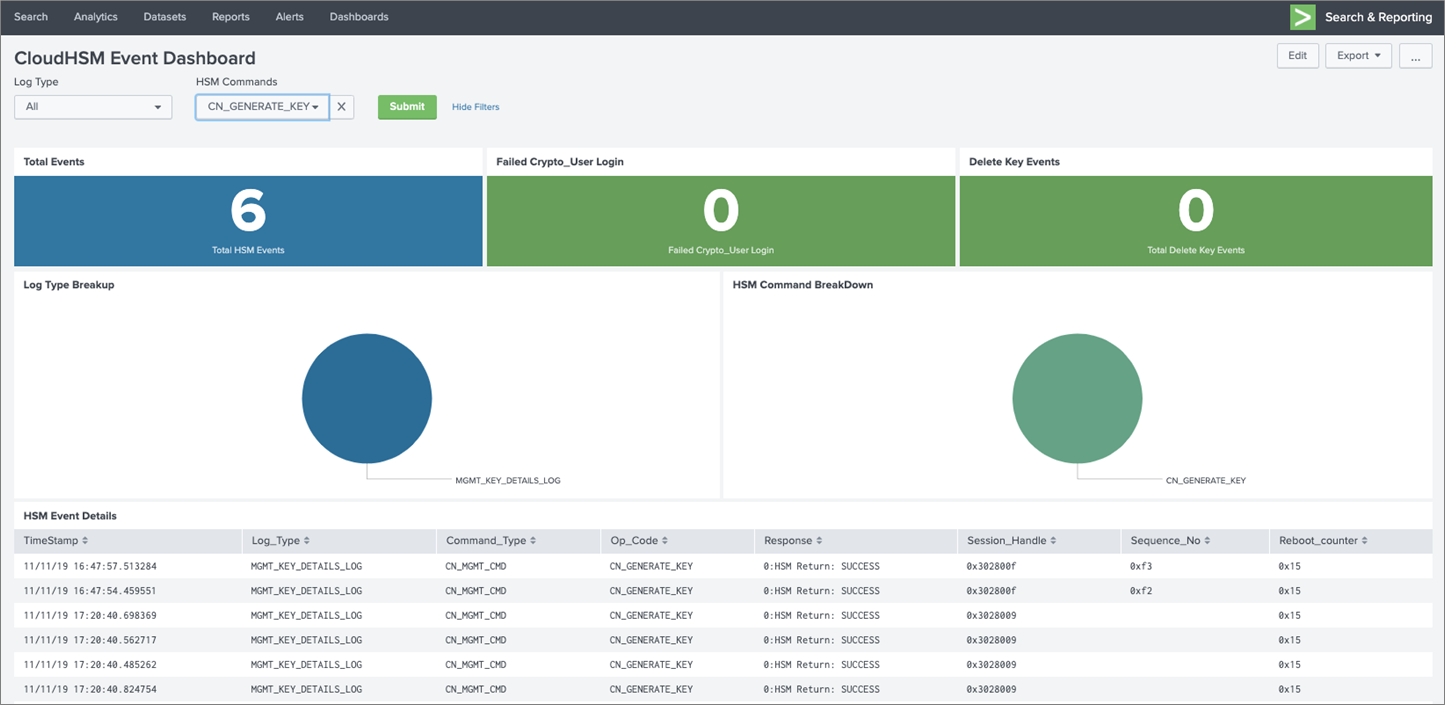
Figure 5 – Splunk dashboard filter by HSM commands.
If you click on any of the CN_GENERATE_KEY events, a more detailed view will be displayed with additional fields that capture useful information. For example:
- Opcode identifies the management command that’s being recorded CN_GENERATE_KEY.
- Sequence No identifies an event in the log stream and indicates the order in which it was recorded.
- Priv/Secret key handle refers to the logical identifier of the symmetric key generated.
- Response field records the response to the management command, the values can either be SUCCESS and ERROR.
Summary
In this post, we have demonstrated how to interpret and visualize audit events sent from AWS CloudHSM into Splunk using an Amazon CloudWatch Log Group, blueprint AWS Lambda function, and Splunk HTTP Event Collector (HEC).
Amazon CloudHSM helps customers meet corporate, contractual, and regulatory compliance requirements for data security by using dedicated Hardware Security Module (HSM) instances within the AWS Cloud.
Using this solution, organizations can analyze audit logs generated from CloudHSM to gain visibility into critical activities taking place within the CloudHSM appliance, and build visualizations and dashboards for security or operational requirement.
Next Steps
You can set up your CloudHSM Cluster, get a free trial of Splunk Enterprise, and send audit events into Splunk.
Learn more about AWS CloudHSM, and if you have questions please post them on the CloudHSM Service Forum.
.

.
Splunk – APN Partner Spotlight
Splunk is an AWS Competency Partner. Its software and cloud services enable customers to search, monitor, analyze, and visualize machine-generated big data from websites, applications, servers, networks, IoT, and mobile devices.
Contact Splunk | Solution Overview | AWS Marketplace
*Already worked with Splunk? Rate this Partner
*To review an APN Partner, you must be an AWS customer that has worked with them directly on a project.