AWS Partner Network (APN) Blog
SaaS Cost Attribution: How to Align Technology with Business
By Roi Ravhon, Co-Founder and CEO – Finout
By Oren Reuveni, Principal Solutions Architect – AWS SaaS Factory
 |
A key challenge that software-as-a-service (SaaS) providers face is understanding the cost profile of their SaaS environment and customers within it.
Measuring the cost of each tenant in the system, understanding cost-effectiveness of product features, and accurately metering the margin in a SaaS solution are examples of abilities that are critical for success of a SaaS solution.
These are central measures of refining the pricing model, the solution’s architecture (in terms of cost), and influencing an organization’s strategy.
The most important point here, perhaps, is that these abilities enable SaaS providers to discuss cost in a clear and data-driven manner.
In our experience, gaining visibility into tenant activity and resource usage in such environments allows SaaS providers to make informed business and technical decisions, evolve their products, and prioritize their roadmap. To enable in-depth visibility, SaaS providers need to attribute the usage of infrastructure resources to individual tenants (either partially or completely), and generate insights out of this data.
In this post, we will review challenges in gaining detailed cost-related visibility into a multi-tenant SaaS product, discuss possible methods for how to solve them, and explain the value of this visibility into SaaS environments.
Cost Attribution in SaaS Environments
Understanding the cost attribution of a multi-tenant SaaS solution can be challenging. The solution’s architecture and different product features are usually built on top of multiple services and resources that serve multiple tenants, each of which can have its own pricing model.
A typical example in an Amazon Web Services (AWS) environment is a SaaS solution that stores raw tenant data on Amazon Simple Storage Service (Amazon S3), and uses Amazon DynamoDB to manage user profile data along with a container cluster as the compute power that generates reports for the users.
The fact multi-tenant SaaS solutions use shared (pooled) environments to serve multiple tenants adds a unique challenge for implementing this ability.
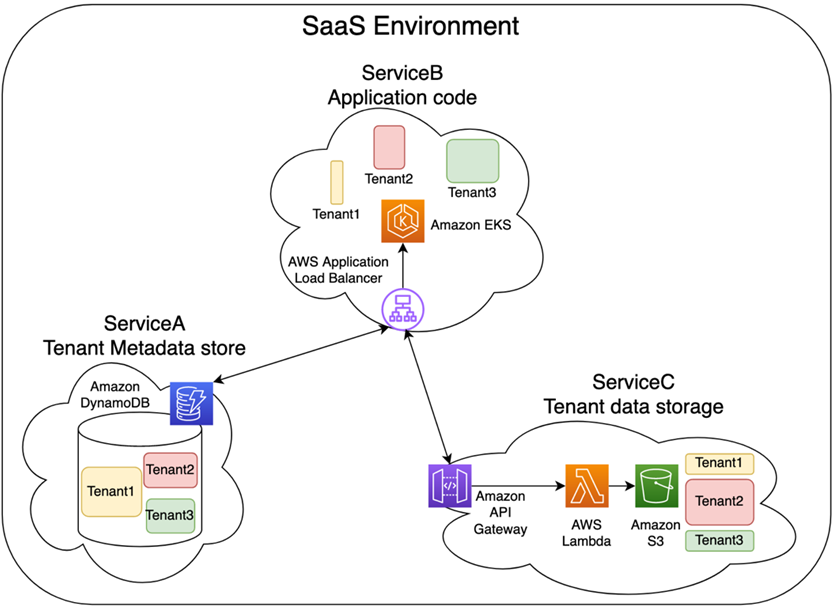
Figure 1 – Typical SaaS solution architecture.
The level of visibility is key for optimal cost optimization and management. The less granular, less accurate view a SaaS provider has of individual tenant consumption, the less value they will get out of their cost metrics.
Visibility which is not granular enough (for example, not being able to track the interaction of individual tenants such as the amount of data of each tenant in S3) can cause significant gaps. Decisions may be made based on estimations rather than data, and product usage metering is based on approximation.
The customer pricing model could be based on estimations, such as current visibility). This situation impacts a SaaS provider’s effectiveness in terms of operation and prevents having a detailed cost analysis and optimization abilities. The result is limited ability to determine cost elements in an accurate manner.
Gaining Visibility into Tenant Consumption Patterns
When operating a multi-tenant solution, SaaS providers want to meter the amount of resource consumption and usage pattern of each tenant (and sometimes even of individual users within a tenant). This helps calculate the cost per tenant, identify trends and overheads in the system (for tenants and tiers for example), and create the optimal pricing model for their solution.
According to the AWS Well-Architected SaaS Lens, the most basic practice for metering tenant consumption is to approximate tenant consumption from tenant activity. While this is a good starting point, it allows SaaS providers to understand and optimize the solution cost and pricing model only to a limited accuracy.
To create a more accurate profile of tenant consumption, SaaS providers need to invest in creating a more granular strategy.
The next step is building a richer view of tenant consumption, which helps SaaS providers meter component usage and attribute it to each tenant in the environment. This creates a detailed estimate of the tenant’s resource consumption. It also provides insight regarding the usage pattern of each tenant, and the actual usage and utilization of each product feature, which can directly affect cost related decisions and pricing models.
As stated in the What is a Unit Metric? blog post, calculating the unit cost is the way to understand how much a SaaS provider pays for each “unit of production.” A unit of production can be the price of each product unit a company is manufacturing, such as a seat, event, transaction, stream, or report.
By using this method, SaaS providers can acquire impactful insights about the usage patterns in their solution, measure it against this price, and make sure they can better understand their costs while sustaining a healthy and steady gross margin.
That said, in real-life scenarios, when using multiple services—either within AWS and outside of it—the unit price may be inaccurate.
While a SaaS provider can think the resource price for a given month is steady, there can be a decrease in database usage, for example, which is slightly higher than an increase in the amount of data streaming. Yet, the stream cost is increasing at a non-proportional rate to unit price. Months can pass until they figure out that “creeping cost.”
To solve for this, SaaS providers need to create better granularity and distinguish between each resource, such as database and stream separate unit costs.
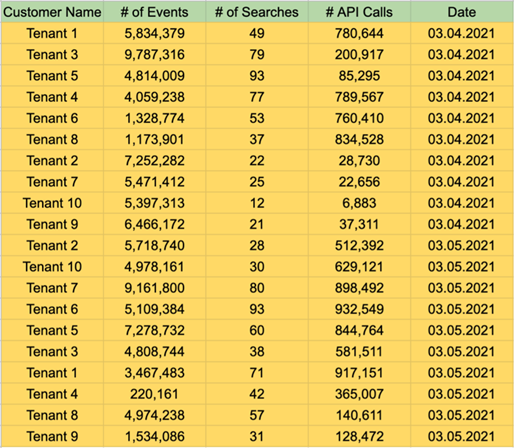
Figure 2 – Define KPIs and measuring units.
Attributing Tenant Costs
To create the connection between tenant consumption and resource usage, SaaS providers need a mechanism that correlates tenant consumption with infrastructure costs. Examples of how to achieve that are:
- Building this mechanism on your own. SaaS providers can build the mechanism that correlates the data, and then leverage business intelligence (BI) tools such as Tableau in order to analyze it and generate insights.
- Leveraging AWS Application Cost Profiler to facilitate this process. This tool collects tenant metadata and reports hourly breakdown of cost per tenant on a daily and monthly basis.
- Using an AWS Partner solution such as Finout: a SaaS solution that integrates with AWS, data warehouses, and observability platforms. Finout combines business metrics with your cost, slicing it up to customers, features, and unit metrics.
When fine-grained visibility is available, it allows SaaS providers to use tenant consumption insights to shape operational and architectural efficiency in terms of cost. Measuring each unit and service in a multi-tenant environment with the correspondence to a key performance indicator (KPI) that it’s attributed to helps achieve clearer visibility of how the provider’s cost is distributed.
Understanding how each tenant in the system is behaving, and then connecting this behavior to infrastructure costs, gets us closer to true cloud cost accountability.
For SaaS providers, however, this isn’t always enough. SaaS solutions need to be able to answer more advanced questions, such as:
- Is this feature profitable?
- Which customer segments are the best for us?
- What is my engineering team’s productivity for this build pipeline?
- Who are the most active/inactive or most resource demanding users within a tenant?
This issue is because fast-paced companies have three cost-related axes that are being changed constantly with the risk of not being discovered in a timely manner:
Axis 1 – Developers
Each developer or platform (infrastructure) engineer can, with one code commit or feature toggle in the AWS Management Console, break the company’s target margin, without even knowing.
Examples for such changes include changing the configuration of a scheduled task to run three times a day instead of two; toggling “Infrequent Access” on an Amazon S3 bucket; or adding five milliseconds of validations on each request.
R&D has significant responsibility on business sustainability and not just on new features and availability.
Axis 2 – Customers
Not all customers were created equal, and not all customers maintain their usage patterns. A SaaS solution can host customers with 99% margin and customers with 20%. This may be OK, but it’s important to be aware and act in accordance with the data.
While these margin differences are not directly related to measuring infrastructure cost, they directly affect cost-related considerations. For example, as a result of these insights the SaaS provider may want to target specific customer segments, make architecture changes in order to improve these metrics, or retire a feature that’s being used by 2% of customers but attributes 20% of the cost.
SaaS providers need to monitor customers’ activity patterns constantly. Customers can (and will) change their behavior and use features in ways that can cause them to move from 90% to 20% margins over a short period of time.
Axis 3 – AWS
A cloud-based environment offers multiple services and abilities. It enables SaaS providers to use different resources for different needs.
For example, while the free tier environment can use resources which provide basic performance, premium tiers can enjoy resources with higher performance. Pricing can change, Reserved Instances can end, and new services that may help optimizing the SaaS solution surface constantly.
SaaS providers should monitor the “floor of the SaaS plant” to make sure it’s as efficient as possible. Using the right AWS services and abilities can make the difference between a good or bad margin target.
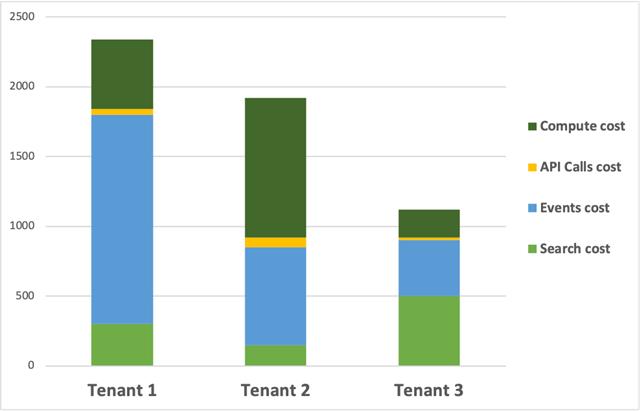
Figure 3 – Cost attribution.
Benefits and Organizational Impact
So far, we have discussed relevant considerations and practices of cost attribution. Let’s dive deeper into how this can influence business decisions and why business and technical teams should care about this data.
Getting an accurate cost breakdown is key to understanding the way customers of a SaaS solution consume resources in its environment. Each resource should have a KPI associated with it, and whenever there are discrepancies the discussion about them can be as targeted as an arrow and data driven. For example, “The S3 cost of bucket X in region Y is 20% more than it should have for the amount of KPIs produced, starting Monday at 11:00 am.”
Once the SaaS provider achieves sufficient visibility, they can start using it within the organization to build a more cost-effective SaaS solution. A clearer dialog is now possible, and getting to the platform team with KPI data is actionable and less frustrating.
This is also a good way to reduce friction between the finance and R&D teams. SaaS providers no longer need to estimate a budget that R&D is not the only one controlling. For example, the finance team can claim that based on its projections, the AWS bill next quarter should increase by 15%.
By having this dialog within the organization, SaaS providers can accurately determine the best pricing model for the solution, understand how product feature usage affects resource consumption and the cost of the solution, and plan business and technical motions in a cost-aware manner.
Another benefit of having these insights at hand is being able to discuss budgets and coordinate between business units in the organization.
For example, if the marketing team has a goal to get 50% more leads into the application’s free tier, it may result in R&D having to spend more money supporting additional free tier tenants. This action may overrun their budget and interfere with their own objectives—an implication that should be examined.
Since the SaaS provider now has better visibility into SaaS elements such as individual tenants and tiers, setting budgets and forecasting revenue and cost based on unit economics price can help the finance team regain control of the spend, form better organizational alignment and budget planning, and make platform teams feel more comfortable building a better and more stable product.
A practical example for that can be reflecting the value of each tier in the system. Since the platform team can commit to “$1.23 for GB we are storing in the free tier infrastructure,” or “$4.2 for 1M events in both free and premium tiers,” the finance team can quickly measure return on investment (RO)I for each component, feature, and tenant in the system.
Note that once the SaaS provider has access to cost-per-tenant insights, they can be used to ask broader questions about how that cost relates to other activity trends, such as feature usage data and higher resolutions of visibility into the way of usage.
Conclusion
SaaS companies need to understand their cost structure in order to understand their business.
For many, the cloud cost is the biggest part of their Cost of Goods Sold (COGS), and leaving it as a “black box” means SaaS providers are blind when it comes to making data-driven decisions about critical aspects of the business.
Breaking down the cost to different unit metrics, customers, features, segments, and business units is a requirement for any modern SaaS business.
About Finout
Finout is an AWS Partner and self-service, zero-code, cloud cost observability platform that combines business metrics with infrastructure cost, slicing it up to customers, features, and unit metrics.
Finout’s platform integrates with AWS, data warehouses, and observability platforms to correlate and analyze cost data in one place, and to make sure each dollar is accounted for.
About AWS SaaS Factory
AWS SaaS Factory helps organizations at any stage of the SaaS journey. Whether looking to build new products, migrate existing applications, or optimize SaaS solutions on AWS, we can help. Visit the AWS SaaS Factory Insights Hub to discover more technical and business content and best practices.
SaaS builders are encouraged to reach out to their account representative to inquire about engagement models and to work with the AWS SaaS Factory team.
Sign up to stay informed about the latest SaaS on AWS news, resources, and events.