AWS Partner Network (APN) Blog
Monitoring VMware Cloud on AWS Workloads with Amazon OpenSearch Service
By Drew Rutledge, Specialist Solutions Architect at AWS
 |
VMware Cloud on AWS is a jointly engineered solution by VMware and Amazon Web Services (AWS) that brings VMware’s Software-Defined Data Center (SDDC) technologies such as vSphere, NSX, vSAN, and more to the AWS global infrastructure.
Amazon OpenSearch Service makes it easy for you to perform interactive log analytics, real-time application monitoring, website search, and more. Amazon OpenSearch Service is an open source, distributed search and analytics suite derived from Elasticsearch.
When deploying production workloads, it’s important to have visibility into the health of these workloads in order proactively address issues that may arise. These issues could relate to inaccessibility, operating system (OS) instability, application misconfiguration, or any number of other possibilities.
One common way organizations monitor and troubleshoot their production workloads is by monitoring application and server logs; this can include web server logs, Linux syslog, and Windows event logs, for example.
The combination of OpenSearch (an open-source tool for searching and analyzing data) and OpenSearch Dashboards (an open-source user interface for visualizing data derived from Kibana 7.10) creates a powerful mechanism for aggregating, monitoring, and visualizing application and server health.
Amazon OpenSearch Service, when combined with Amazon Kinesis Data Firehose and AWS Lambda, can create a managed, end-to-end log aggregation and workload monitoring solution for workloads, including those running in VMware Cloud on AWS.
In this post, I will discuss the benefits of this monitoring solution, as well as provide ideas on how to get started utilizing it. Let’s first visualize what the solution looks like at a high level.
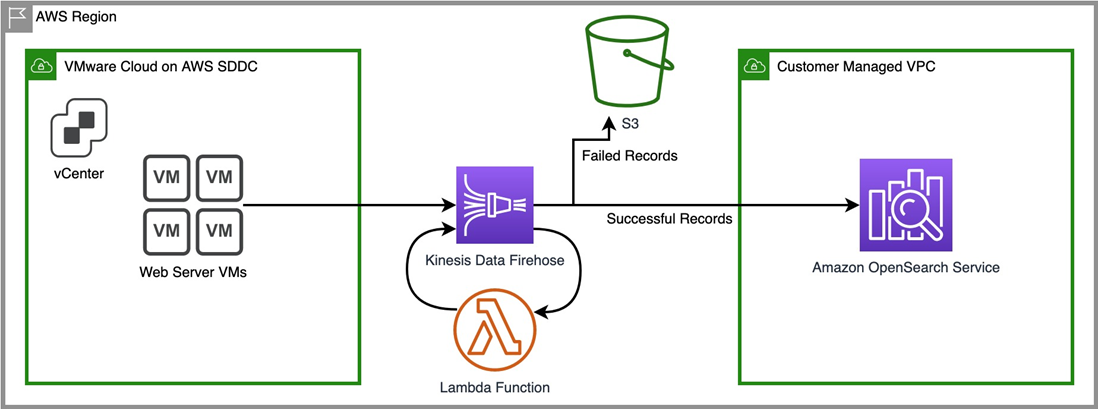
Figure 1 – High-level solution design diagram.
In this architectural diagram, depicted is our fleet of web server virtual machines (VMs) that are hosted inside our VMware Cloud on AWS SDDC. We want to capture their web server access logs, in this case Apache httpd, which will allow us to monitor metrics like HTTP response codes, page views over time, or hits by particular IPs.
Our VMs forward their traffic to Amazon Kinesis Data Firehose by way of the Kinesis Agent, a standalone Java application installed on the VMs that offers an easy way to send data to Kinesis. Once that data is in our Firehose delivery stream, a Lambda function is triggered to convert the raw log output to a JSON format that OpenSearch can parse.
A successfully reformatted log output is then forwarded to Amazon OpenSearch Service. If for some reason log output fails to be reformatted or fails to reach OpenSearch, it is forwarded to an Amazon Simple Storage Service (Amazon S3) bucket so that no log entries go missing.
Topology Breakdown
Now, let’s discuss the components of this architecture in a little more detail, starting with VMware Cloud on AWS.
The Software-Defined Data Center resides in a VMware-managed Amazon Virtual Private Cloud (VPC) that is hosted in a VMware-owned AWS account dedicated solely to an individual customer. During setup and configuration, this account is connected to a VPC on our customer-owned account using Elastic Network Interfaces (ENIs).
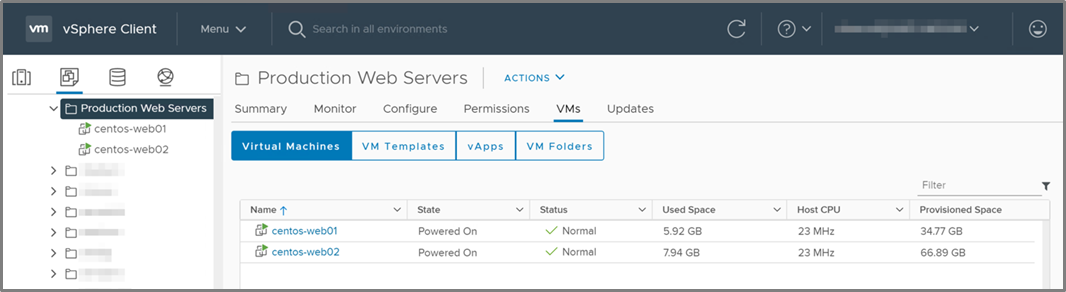
Figure 2 – VMware vSphere client displaying web server VMs.
In our VMware Cloud on AWS environment, the vCenter console shows our two web server VMs, centos-web01 and centos-web02, sitting in the “Production Web Servers” folder, as shown in Figure 2.
We want to monitor their health, as well as track how they are being utilized. In the event of an issue, we also want to be able to look at the logs easily to help with root-cause analysis.
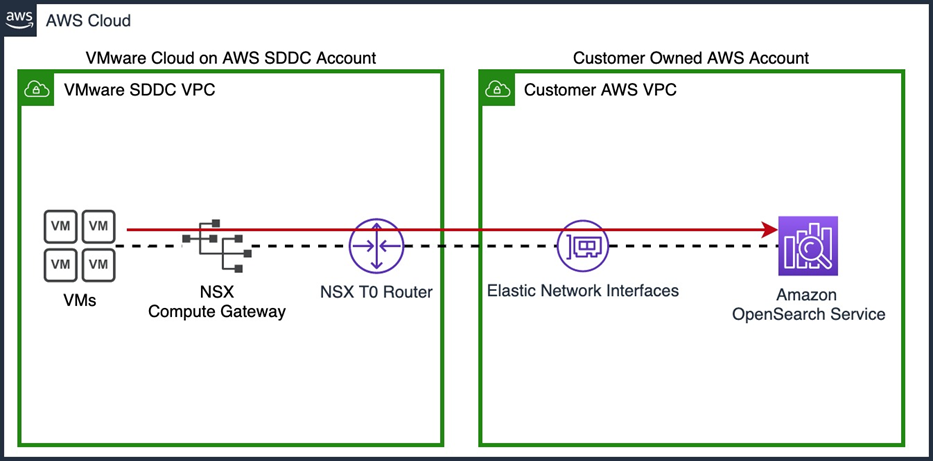
Figure 3 – VMs have direct access to native AWS services via ENIs.
VMware Cloud on AWS gives us the ability to communicate directly with any native AWS services we may want to use by leveraging multiple ENIs to communicate between the VMware-managed SDDC and our own customer-managed VPC, as shown in Figure 3. This traffic flows directly between the SDDC and our VPC, never having to reach outside of the ENI connection between the two environments.
The nature of this ENI connectivity gives us high bandwidth, low latency, and secure connectivity between our VMware Cloud hosted VMs and our native AWS resources. Leveraging this native connectivity allows us to build this log aggregation solution, as well as any future integrations we may want to utilize with our VMs.
Traditionally, we might use something like Logstash in order to send our logs to Elasticsearch. This combination of Elasticsearch, Logstash, and Kibana is commonly referred to as the “ELK stack.” You can choose to deploy and manage the ELK stack yourself with Apache 2.0 licensed versions of Elasticsearch and Kibana (up until version 7.10.2), or self-manage an open-source alternative to the ELK stack with OpenSearch, OpenSearch Dashboards, and Logstash.
Using this architecture, customers have to manage multiple servers and processes. Instead, customers can use a simpler alternative in AWS: Amazon Kinesis. In this case, we’ll leverage Kinesis Data Firehose, which allows us to capture our log data, transform it using a Lambda function, and deliver it to OpenSearch reliably and easily. This service is fully managed, so we won’t have to maintain any infrastructure, and it will scale as our needs grow.
In this specific circumstance, our VMs will send log data to Kinesis Data Firehose via the Kinesis Agent, and then use a pre-built Lambda function to transform them into JSON before being delivered to OpenSearch. This allows OpenSearch to parse our logs, allowing us to sort, filter, and report on different fields like timestamps, HTTP response codes, event severity, and more.
While there are a number of pre-built Lambda functions able to parse the logs of common applications like httpd, you can also write your own Lambda function to parse the logs of your own applications as well.
On the VMs themselves, we have configured the Kinesis Agent to send the logs to our delivery stream. The setup of this is very simple. For our Linux VMs, this is just a matter of downloading the agent via yum and starting the service:
Install
sudo yum install –y https://s3.amazonaws.com/streaming-data-agent/aws-kinesis-agent-latest.amzn1.noarch.rpm
Execution
sudo service aws-kinesis-agent start
If you wanted to do this with Windows VMs instead, the process would be very similar. In that case, we’d install the Kinesis Agent via an MSI file, and then edit the configuration file in a manner much like the Linux version. For more information on the process for installing the Kinesis Agent on Windows, refer to the documentation.
The setup is as simple as editing a configuration file to point the agent at our delivery stream, and defining the path to the logs we want to capture. The agent’s configuration file can be found at /etc/aws-kinesis-agent/agent.json.
For more information on configuration, refer to the documentation. For our purposes, the main fields we’ll need to configure are:
firehose.endpoint– This points the agent to the Kinesis Firehose endpoint.assumeRoleARN– This is the Amazon Resource Name (ARN) of the AWS Identity and Access Management (IAM) role we have defined for the agent.awsAccessKeyId– The AWS Access Key ID configured to allow the agent to access AWS resources.awsSecretAccessKey– The Secret Access Key corresponding to the AWS Access Key ID.filePattern– The directory that contains the logs we want to send via the agent.deliveryStream– The name of the Kinesis Delivery Stream we have configured.
If our Lambda function invocation fails because of a network timeout or because we’ve reached the Lambda invocation limit, Kinesis Data Firehose will retry the invocation three times by default.
If at that point the invocation doesn’t succeed, Kinesis Data Firehose will skip that batch of records. The skipped records are treated as unsuccessfully processed records, and will be shipped to a secure S3 bucket as a backup measure. We can also configure all of our records to be sent to S3 if we prefer.
When setting a solution like this one up, it’s important to follow AWS security best practices to make sure your S3 buckets are properly secured, as well as making sure your IAM roles and security groups are set up properly to prevent unauthorized access. Follow this guide to learn how to create an IAM role to delegate access to AWS services.
Once we have all of our data successfully streaming into OpenSearch, we need to create some visualizations to really get the most out of it. When we first log into the OpenSearch Dashboards user interface (UI), in the “Discover” tab, we see our raw log data starting to stream in. It looks similar to what’s displayed in Figure 4.
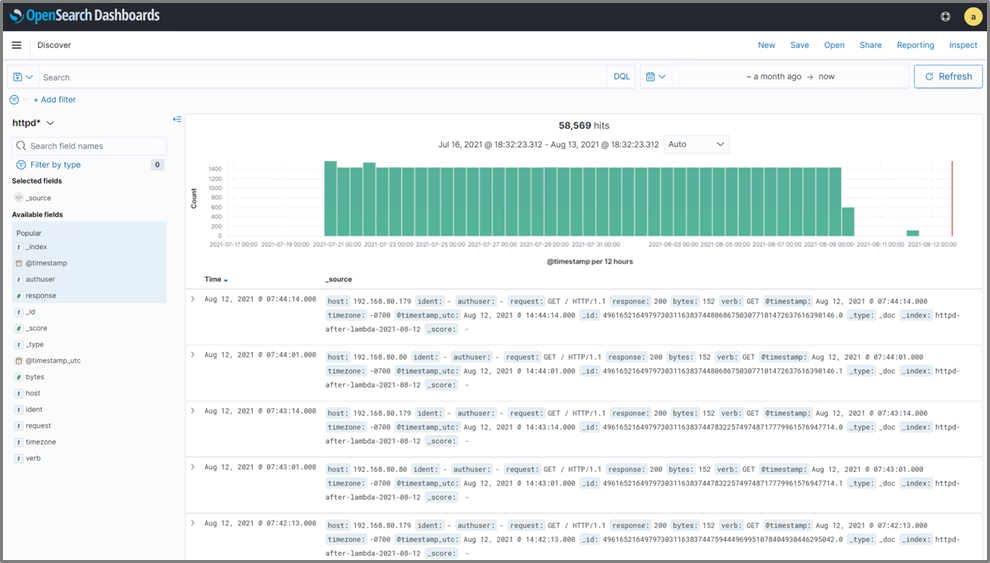
Figure 4 – The “Discover” page shows the raw log data that has been received from Kinesis.
Right away, we can see that different fields we might like to track are being highlighted, such as host, response, and timestamp. While seeing the raw log output is beneficial and can help us in troubleshooting, the true benefit of OpenSearch and OpenSearch Dashboards is visualization.
To create some visualizations, we can go to the “Visualizations” menu in OpenSearch Dashboards, which can be accessed by clicking the “Visualize” button on the home page. After clicking “Create Visualization,” we have the ability to choose from a number of visualization types.
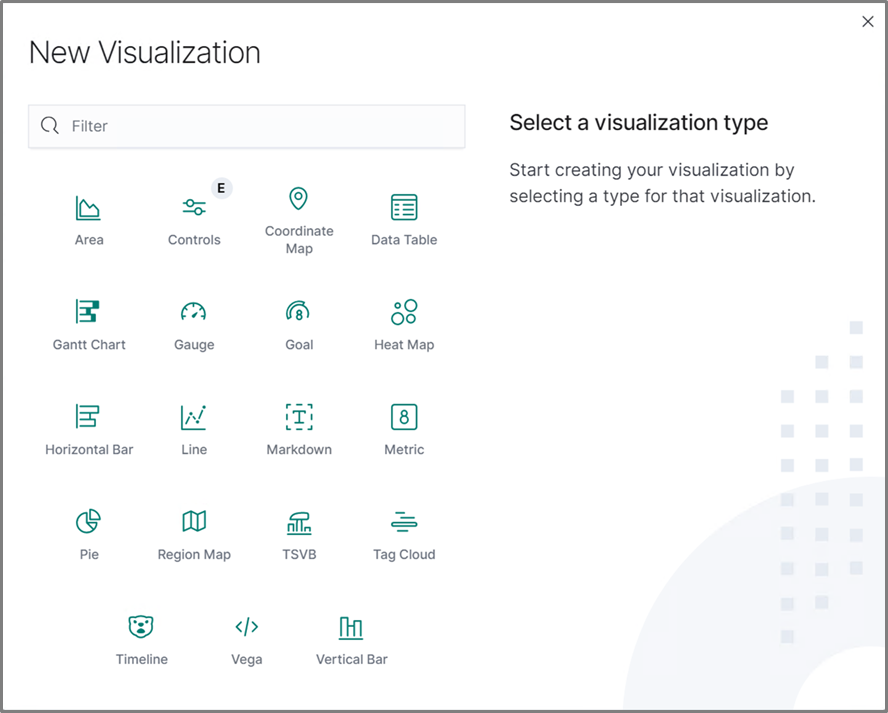
Figure 5 – “New Visualization” menu displaying the various visualization types available.
As displayed above, we have a number of options depending on what data we’re trying to visualize. For example, we can create a line graph to visualize data that occurs over time (leveraging the timestamps in the logs), or utilize a pie chart to illustrate percentages. When setting this up for your own purposes, it’s worth experimenting to see what types of visualizations may make the most sense for your data.
To start with, we’re going to create a pie chart to illustrate the percentage of different HTTP response codes our website serves. This allows us to quickly determine if we need to investigate a potential issue further due to pages not being found, or multiple denied logins.
While editing our pie chart, we can set parameters on what data we want the chart to source from, as well as decide how we want the chart to look. We can hit the refresh button at any time to get an idea of what the chart will end up looking like. Once we have the chart set up, we can save it.
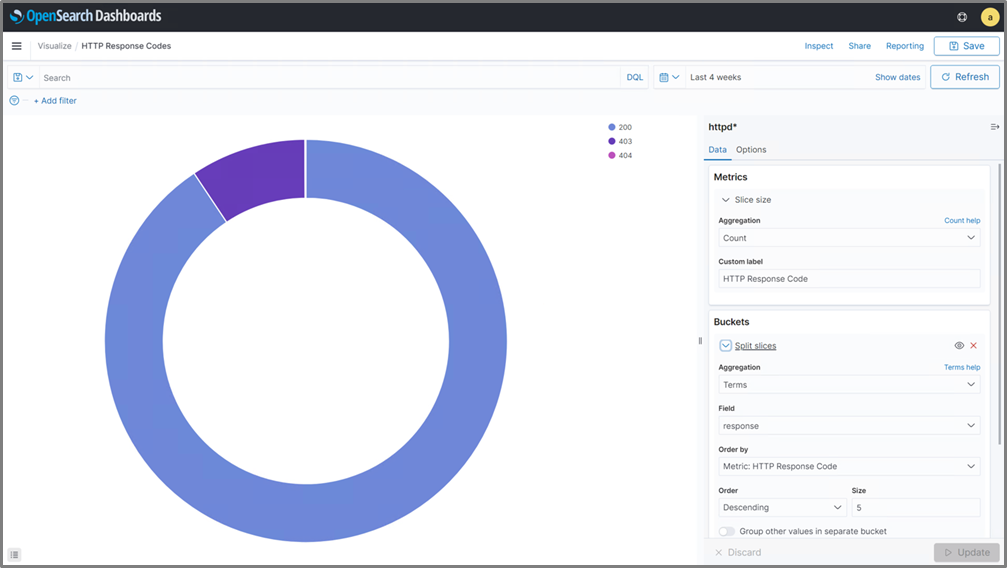
Figure 6 – Creating a visualization of HTTP response codes for our web servers.
After creating a couple of other charts (one for page views over time, and one for hits by source IP) we can aggregate them all into a single dashboard, as shown in Figure 7. This allows us to keep an eye on all of the various metrics we want to track all in one place.
This type of dashboard can be ideal to have up and running perpetually on a large screen in our network operations center, so we’ll be able to quickly glance at the status of our web server environment at any time.
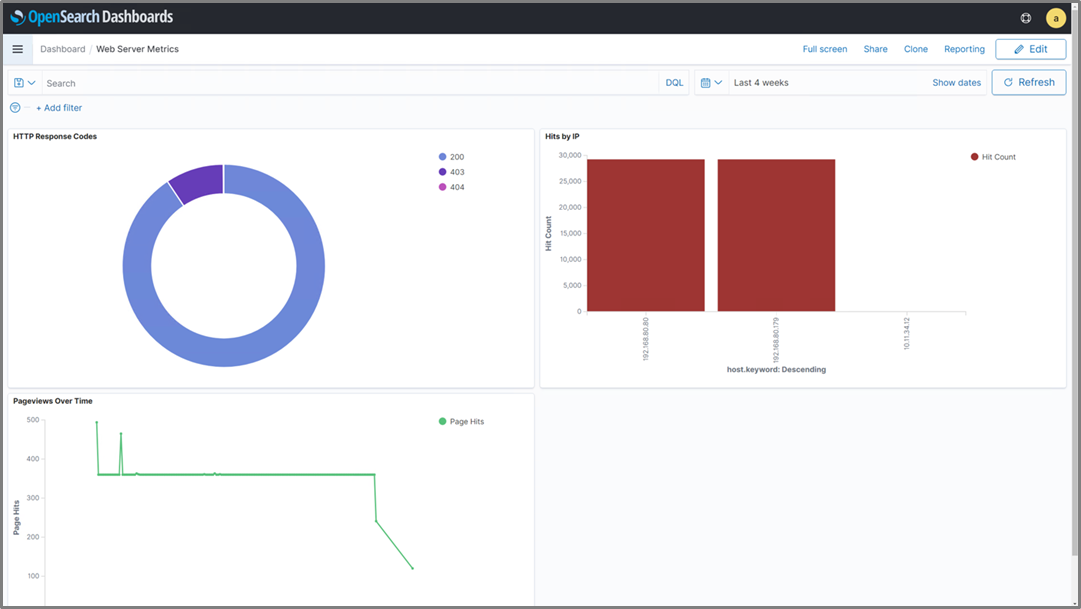
Figure 7 – OpenSearch Dashboards displaying all of the various visualizations we’ve created.
While this is just one example, this solution has the ability to aggregate log data from near-infinite use cases. Visibility into what your workloads are doing is critical to maintaining service continuity, so solutions like this one can be an important piece of a larger puzzle to provide users the best experience possible when interacting with your environment.
It’s also worth noting this solution can be implemented in much the same way for your on-premises workloads, or workloads hosted in Amazon Elastic Compute Cloud (Amazon EC2), giving you this insight wherever your workloads may be located.
Summary
VMware Cloud on AWS can easily integrate with any AWS native service. In situations where you want to aggregate and visualize virtual machine log data, a combination of Amazon Kinesis Data Firehose and Amazon OpenSearch Service provides a cost-efficient, managed, secure, and scalable solution to meet these needs.
To learn more about how VMware Cloud on AWS works, take a look at these resources, which include reference architectures, video overviews, solution briefs, and more.
Please connect with us for more information or to inquire about implementing solutions like this within your environments.