AWS Partner Network (APN) Blog
Subscribe and Ingest AWS Data Exchange Data into Databricks and Visualize it with Amazon QuickSight
By Venkatavaradhan Viswanathan, Sr. Solutions Architect – AWS
By Igor Alekseev, Sr. Partner Solutions Architect – AWS
By Ioannis Papadopoulos, Cloud Technologist – Databricks
 |
| Databricks |
 |
Modern enterprise customers use AWS Marketplace datasets along with their business and operational data to create meaningful and deeper insights to improve their customer experience.
In this post, we discuss how to consume datasets from AWS Data Exchange (ADX) to transform and store data in Databricks Lakehouse Platform using Delta Live Tables (DLTs) and visualize it in Amazon QuickSight.
AWS Data Exchange makes it easy for Amazon Web Services (AWS) customers to find, subscribe to, and use third-party data from qualified data providers in the AWS Cloud. Anyone with an AWS account can be an ADX subscriber. Learn more about subscribing to data products on AWS Data Exchange.
In addition, anyone with or without an AWS account can find and use publicly available datasets that are part of the Open Data on AWS program. Learn more about using Open Data on AWS datasets.
Databricks is an AWS Data and Analytics Competency Partner and AWS Marketplace Seller that allows customers to manage all of their data, analytics, and artificial intelligence (AI) on one platform. The leading Databricks Lakehouse Platform combines the best of data warehouses and data lakes to offer end-to-end services like data ingestion, data engineering, machine learning (ML), and business analytics.
Databricks Delta Live Tables
Databricks Delta Live Tables make it easy to build and manage reliable batch and streaming data pipelines that deliver high-quality data on the Databricks Lakehouse Platform.
DLT helps data engineering teams simplify ETL (extract, transform, load) development and management with declarative pipeline development, automatic data testing, and deep visibility for monitoring and recovery.
DLT is a framework for building reliable, maintainable, and testable data processing pipelines. You define the transformations to perform on your data, and Delta Live Tables manage task orchestration, cluster management, monitoring, data quality, and error handling.
Amazon QuickSight is a fully managed cloud-based service that powers data-driven organizations with unified business intelligence (BI) at hyperscale. With QuickSight, all users can meet varying analytic needs from the same source of truth through modern interactive dashboards, paginated reports, embedded analytics, and natural language queries.
In a single data dashboard, QuickSight can include data from AWS, third parties, big data sources, spreadsheets, software-as-a-service (SaaS) applications, business-to-business (B2B) applications, and more. It provides enterprise-grade security, global availability, and built-in redundancy, with scaling from 10 users to 10,000, all with no infrastructure to deploy or manage.
Solution Architecture
Before we can derive insights from AWS Data Exchange datasets, we need to perform a series of configuration steps. These steps are easy to implement with the combination of ADX, Databricks, and QuickSight.
The solution shown in the diagram below requires little code to write and offers scheduling and workflow orchestration out of the box.

Figure 1 – Solution architecture.
The diagram above shows how, once subscribed to by customer, ADX delivers the data into an Amazon Simple Storage Service (Amazon S3) bucket on a continuous basis. Once it arrives in the bucket, Databricks Auto Loader can transform data and write to an ACID-compliant petabyte-scale data storage called Delta Lake.
Delta Live Tables provide a declarative approach to accomplish this task, and QuickSight connects to Databricks’ cluster via Databricks JDBC Driver to visualize the data.
Here, we use a test dataset from ADX called “AWS Data Exchange Heartbeat (Test product).” This data product contains a single dataset that publishes a new revision approximately every 10 minutes. Each revision contains two assets: an Epoch asset and a Manifest asset.
The Epoch asset is a JSON file containing the list of each UNIX Epoch second that has elapsed since the previous revision. The Manifest asset contains metadata about the revision and the Epoch asset. We’ll configure this data to arrive in partitioned manner in the Destination configuration page.
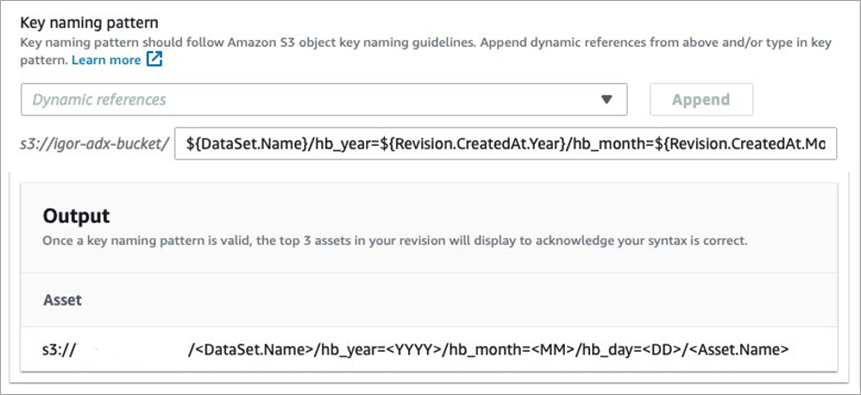
Figure 2 – ADX Destination configuration.
The figure above shows how to configure ADX to deliver the data sets to your S3 bucket with the user-defined settings. We use a Hive-compatible partition naming scheme in which the data paths contain key value pairs connected by equal signs: hb_month=10/hb_day=17/. This partition scheme is natively supported by Spark, allowing for faster queries.
To load the data from ADX into Databricks, we use DLT. Instead of defining data pipelines using a series of separate Apache Spark tasks, Delta Live Tables manage how data is transformed based on a target schema we define for each processing step.
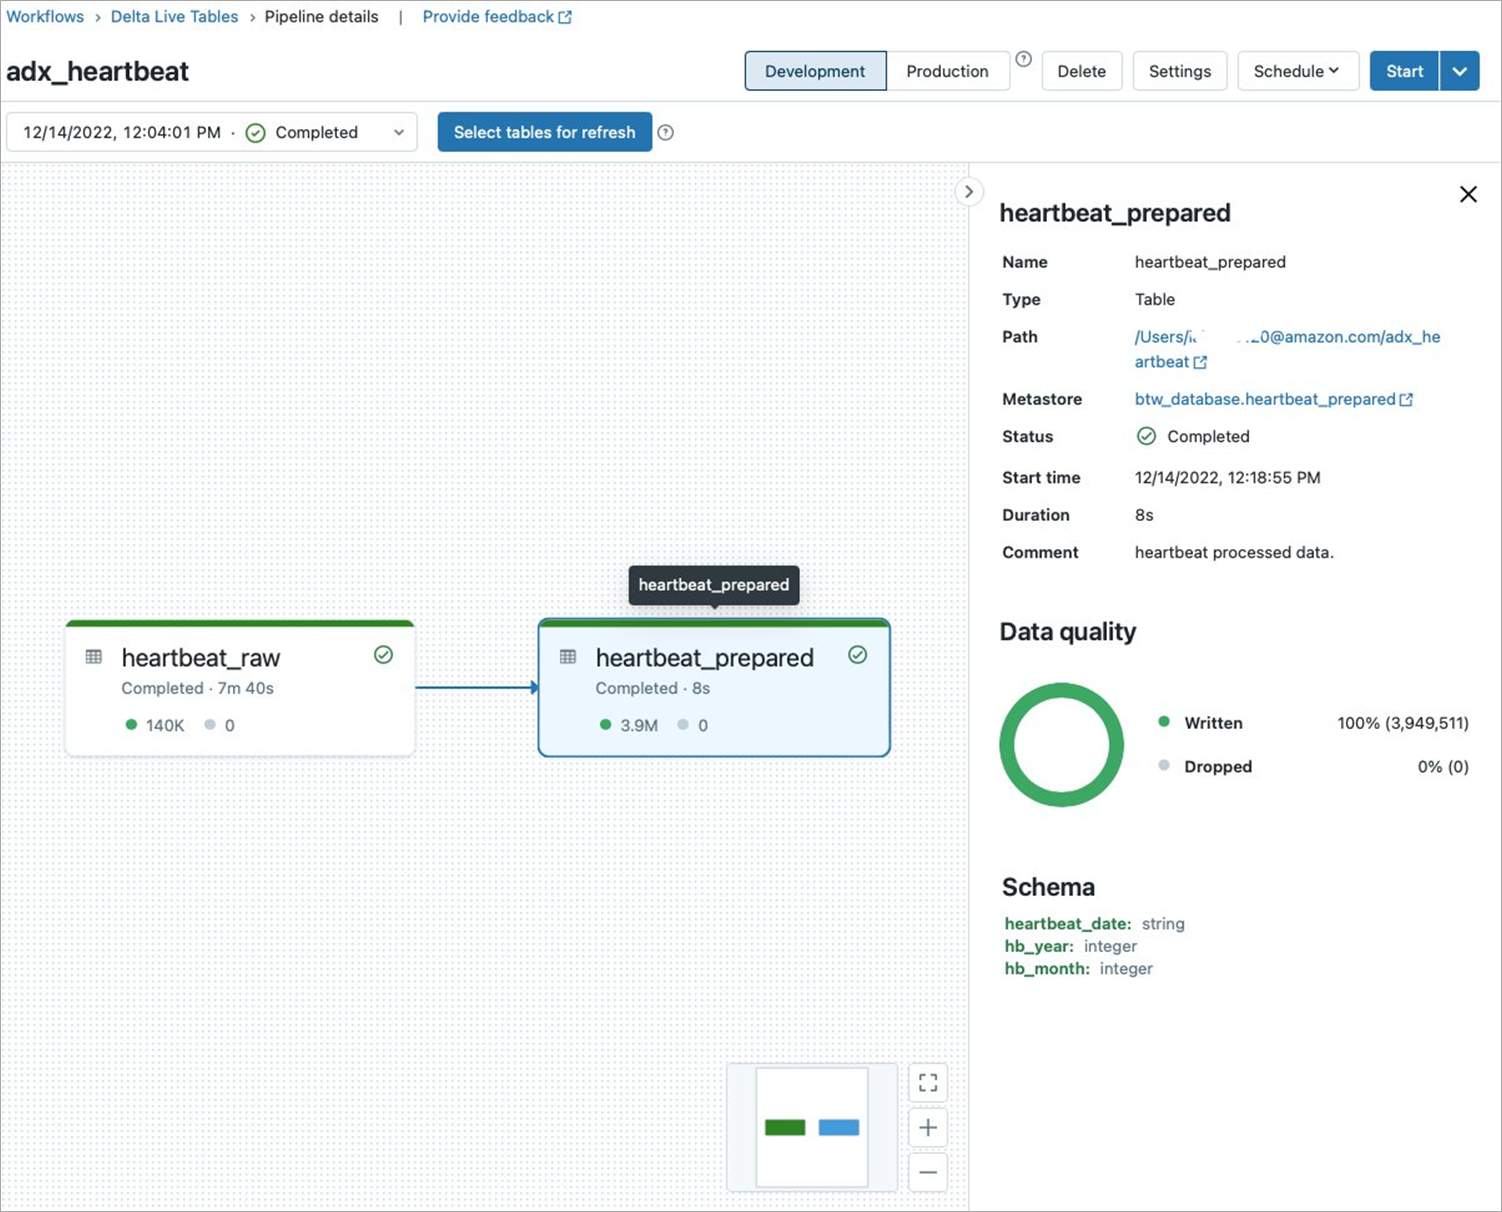
Figure 3 – DLT pipeline code example.
DLT Pipeline Code Example Notebook
The following code example provides the complete code block for data ingestion and transformation using Delta Live Table:
The example above shows a data ingestion and transformation pipeline. Lines 7-20 define the Bronze table specifying S3 location and partition columns. Note the partition columns in the Bronze table need to match the configuration for partitioning scheme shown in Figure 2.
Lines 22-32 define the Silver table. Note that we chose to repartition the data by month and year instead of more granular scheme that included day in the Bronze table.
Now that the data provisioned is in AWS Data Exchange and available in Databricks, we can leverage the QuickSight integration with Databricks to create a report. Start by configuring Databricks as a source in QuickSight. You can follow the high-level instructions below or refer to the documentation for additional information.
Get Connection Details for a Cluster
To establish connections to many external data sources, developer tools, or technology partners, you must provide connection details for your cluster. To retrieve connection details Databricks, perform the following:
- Log in to your Databricks workspace.
- Click on Compute in the sidebar and choose a cluster to connect to.
- Navigate to Advanced Options.
- Click on the JDBC/ODBC tab and copy the connection details.
For more details refer, to Databricks documentation.
Before you start, obtain the cluster URL from the Databricks cluster configuration page in the JDBC/ODBC tab.
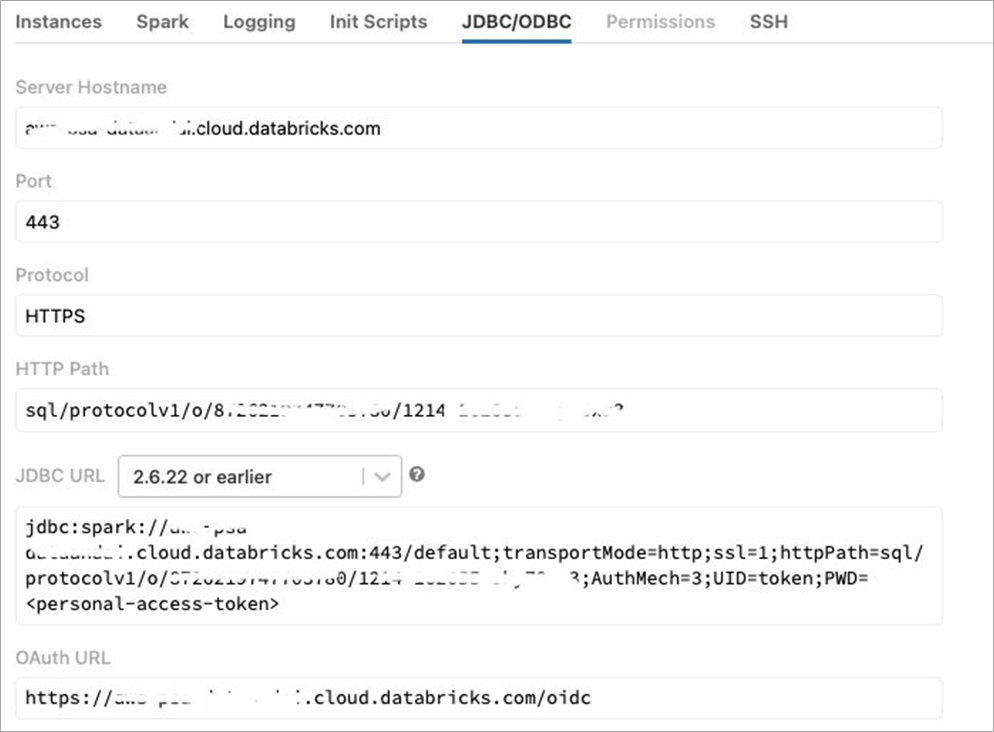
Figure 4 – JDBC/ODBC connection details.
Connect and Visualize in QuickSight
Once you copy the connectivity details from the above step, please follow the steps to set up the connection in QuickSight.
Use the following procedure to edit a database data source:
- From the QuickSight start page, choose Datasets at left, and then choose New dataset.
- Choose the Databricks data source card.
Please refer to the documentation on using Databricks in QuickSight for detailed instruction.
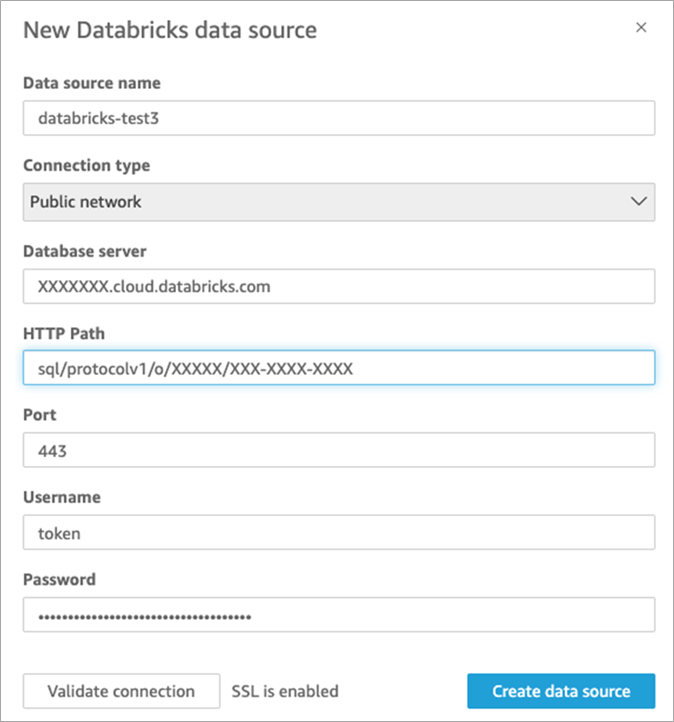
Figure 5 – Amazon QuickSight – Databricks as a source.
After you have an existing data source connection for Databricks data, you can create Databricks datasets to use for analysis.
Once you select the catalog, schema, and table, click Select to finish dataset creation.

Figure 6 – Amazon QuickSight – Finish dataset creation.
In order to visualize the data, QuickSight offers two options: “Import to SPICE for quicker analytics” or “Directly query your data.” Databricks supports both these options.
In our example, select Directly query your data and then click on Visualize.
In this next screen shot, select Interactive sheet with the default layout and click on Create button.
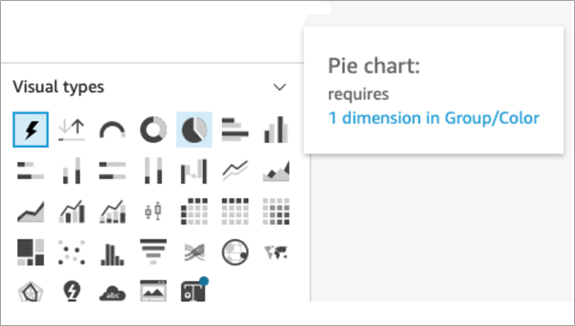
Figure 7 – Amazon QuickSight – Select Visual types.
QuickSight provides various visual types. Select Pie chart from the Visual Type.

Figure 8 – Amazon QuickSight visualization.
Conclusion
In this post, we showed how to subscribe, ingest, and transform a dataset from AWS Data Exchange. We ingested and transformed the data using Databricks Lakehouse Platform using Delta Live Tables. Finally, we consumed the dataset by creating a report with a visualization in Amazon QuickSight.
To explore further, you can discover more datasets in AWS Data Exchange and provision Databricks in AWS Marketplace.
.

.
Databricks – AWS Partner Spotlight
Databricks is an AWS Data and Analytics Competency Partner that allows customers to manage all of their data, analytics, and artificial intelligence (AI) on one platform.
Contact Databricks | Partner Overview | AWS Marketplace | Case Studies