AWS Partner Network (APN) Blog
When to Use a Graph Database Like Neo4j on AWS
By Ben Lackey, Director Global Cloud Channel Architecture – Neo4j
By Antony Prasad Thevaraj, Sr. Partner Solutions Architect – AWS
 |
| Neo4j |
 |
Graph databases are useful for solving problems related to connected data. Common use cases include know your customer (KYC), supply chain optimization, predicting drug interactions, and anti-money laundering (AML).
Graph databases represent data as nodes and enable organizations to uncover relationships between data that’s not possible with other approaches.
In this post, we’ll introduce four types of databases and the most common applications for each. We’ll also cover how different industries use graph databases and how they work as part of an Amazon Web Services (AWS) architecture.
Neo4j is an AWS Partner and AWS Marketplace Seller which defined the graph database space and open-source standards. Neo4j holds the AWS Data and Analytics Competency.
Types of Databases
Since the introduction of the first databases in the 1960s, the ecosystem has grown enormously. Some databases are optimized for storing particular kinds of data, others for particular kinds of queries. There are databases designed for scale, resilience, and so on.
To make sense of all this, there are a number of proposed taxonomies of databases. Wikipedia gives a fairly exhaustive list, enumerating 24 different kinds of databases. AWS gives a great summary of databases as well.
| Database type | Relational | Document | In-Memory | Graph |
| Samples use cases | Traditional applications, ERP, CRM, ecommerce | Content management, catalogs, user profiles | Caching, session management, gaming leaderboards, geospatial applications | Fraud detection, social networking, recommendation engines |
In-memory databases have the simplest data structures, as they forgo much of what SQL and similar query languages offer for speed and simplicity. They are great for caching and related use cases but less so for complex data models.
Both relational and document databases emphasize modeling the data itself. Relational databases model related tables made up of rows and columns, while document databases take a different approach with JSON blobs that form hierarchies which can be modeled as trees.
Graph databases grew out of an area of mathematics called graph theory and differ from the above approaches by putting emphasis not just on data but on the relationships between data points. These are graphs, not in the sense of pie or bar charts, but rather in the mathematical sense of nodes and edges connecting them. Note that “edges” are sometimes referred to as relationships.
You might think of your data as discrete points that could be represented like this:

Figure 1 – Data represented as discrete points.
The value of graph databases stems from storing not just the data, but the relationships between parts of that data. The representation of our points above in a graph database might look something like this:
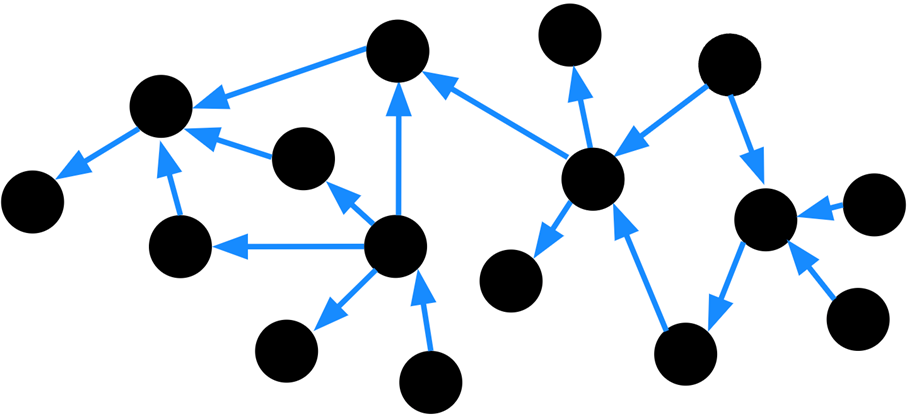
Figure 2 – Graph made up of discrete data points connected by relationships.
Suddenly, a deeper structure is revealed. From there, we can start asking questions about the graph. For instance, how is it connected? Alternatively, how might one traverse the graph?
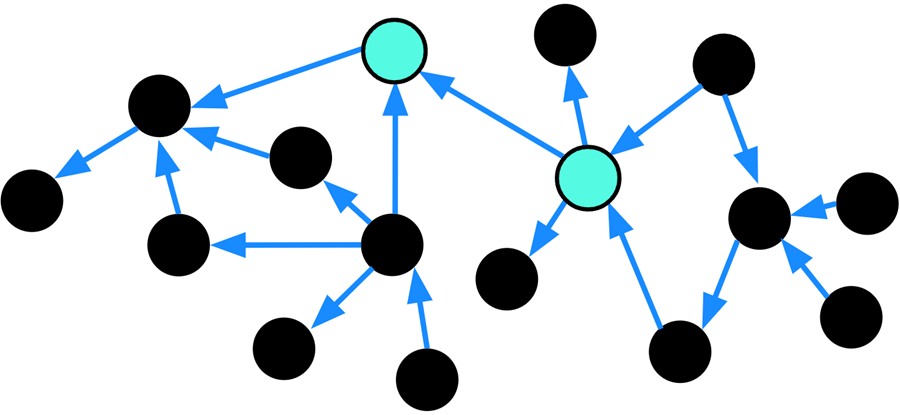
Figure 3 – Node centrality in that graph, with central nodes colored teal.
In doing so, we notice that two nodes are important. They have high centrality, connecting one side of the graph to another. Two examples of central nodes in real-world use cases are:
- Fraud detection: A fraudulent actor transferring lots of money between accounts. That actor makes more transfers to a greater number of accounts than a benign user.
- Supply chain: A critical part of the supply chain where backups cause delays across the enterprise. For instance, a major port like Singapore or San Francisco where storms could potentially disrupt a business worldwide.
When to Use a Graph Database
Graph databases can be thought of as solving the three classes of problems shown in the table below:
| Problem | Description | Visual Example |
| Journey questions | What is the journey or lineage from left to right, or from right to left? |  |
| Matching across entities | Everything we know about an entity or cohort analysis. |  |
| Graph algorithms | Similarity, community detection, centrality, pathfinding, link prediction. |  |
The first two examples can be thought of as different flavors of one another. A journey or lineage question is essentially a one-dimensional trace from the beginning to end, or vice versa. As an example, we might trace the origin of your coffee back to the farm where it was grown.
The second example, matching across entities, is essentially a multi-dimensional version of the journey question. This pattern relies on the ability of graph databases to query a graph, allowing users to understand how one part of the graph relates to another. This helps identify weak links in supply chains or influential individuals in social networks.
Graph algorithms build on the first two examples, with statistical methods and AI/ML that can extract value from the graph. This sort of recommendation provides a link prediction problem that graph databases excel at.
Industry Verticals
Graph databases are fundamentally a horizontal solution that can be used to solve a wide array of problems across a variety of industries, including financial services, manufacturing, healthcare and life sciences, and more.
Neo4j has been working to help customers leverage graphs since 2007, allowing them to develop deep expertise in industry use cases and business problems.
Financial Services
Graph databases are used extensively in the financial services industry for use cases including risk and compliance, fraud detection, and Customer 360.
- Risk management and compliance: A global broker deal needed to comply with regulations put in place to strengthen systems for risk data aggregation and internal risk reporting in the wake of the 2007 global financial crisis. Specifically, UBS sought compliance with the Basel Committee on Banking Supervision issued standard 239 (BCBS 239). Data lineage involves tracking the entire lifecycle of information—its origin, evolution, and movement through the organization. Learn more in Neo4j’s UBS case study.
- Master data management: A global private bank group focused on data, reporting, and analytics group is re-engineering data flows to support its business strategy focusing on global clients and enabling rapid innovation. The platform’s data repositories—including the design and development of CPB central master data repository representing the complexity of clients, accounts, internal employees, and other critical demographic entities—describe the bank’s relationship to clients and their wealth. Learn more in Neo4j’s Citi case study.
- Fraud detection: Simple fraud is straightforward to detect with yesterday’s traditional, discrete technologies, but today’s fraudsters use sophisticated strategies that require connected link analysis and complex pattern matching. Neo4j graph technology makes such connected data analysis simple and efficient, reducing expensive false positives and adapting to new criminal patterns as they emerge. Learn more about fraud detection with graphs.
Manufacturing
- Logistics optimization: Caterpillar employed Neo4j for graph data structures to create a logical form of knowledge. This NoSQL alternative to relational databases allowed them to build ontologies and perform deduction. To get from natural language to graph query results, the team created data architecture that ingests text via an open-source NLP toolkit, which uses Python to combine sentences into strings, correct boundaries, and omit “garbage” in the text. Data is also imported from SAP ERP systems, as well as non-SAP ERP systems. Learn more in the Caterpillar case study.
- Supply chain analysis: The heart of Boston Scientific’s graph data model consists of three nodes representing a finished product, a part, and a failure—with relationships that trace failures to parts and connect those to finished products. This simple model effectively represents a complex medical device composed of dozens of parts, manufactured from raw materials. Learn more in Neo4j’s Boston Scientific case study.
Healthcare and Life Sciences
- Clinical trial management: With Neo4j at its core, Novo Nordisk StudyBuilder acts as a hub for all of the information that must be collected for a clinical trial. The application functions as a library for data points that are shared between studies, and as a catalog for describing the details of the study. Learn more in Neo4j’s Novo Nordisk case study.
- Drug discovery: The Novartis team wanted to link genes, diseases, and compounds in a triangular pattern. The team decided to create a knowledge graph stored in Neo4j, and devised a processing pipeline for ingesting the latest medical research. Learn more in Neo4j’s Novartis case study.
Graph Databases as Part of an AWS Architecture
The technical architectures behind these use cases all share common themes. Neo4j Enterprise Edition is at the core, providing three key components:
- Neo4j Graph Database: Leading graph database.
- Neo4j Graph Data Science: Collection of 50+ algorithms that operate on graphs.
- Neo4j Bloom: Business intelligence tool designed specifically for understanding graphs.
That core connects to a wider ecosystem through drivers and connectors, as shown below.
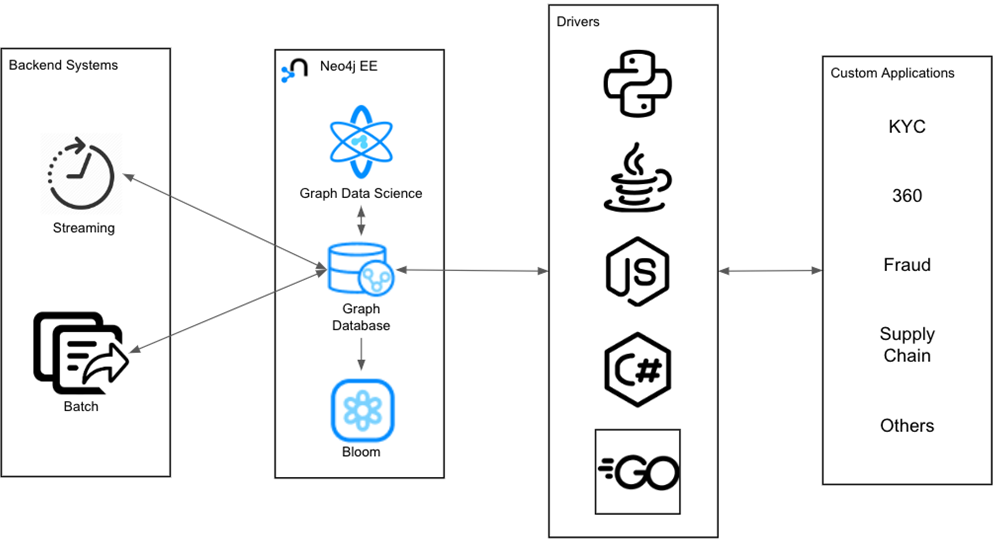
Figure 4 – Application architecture based on Neo4j.
This common architecture is capable of solving problems in Customer 360, fraud detection, supply chain, KYC, and other areas. Digging into the streaming component of the architecture and making it specific to AWS, the most common implementation is shown next.
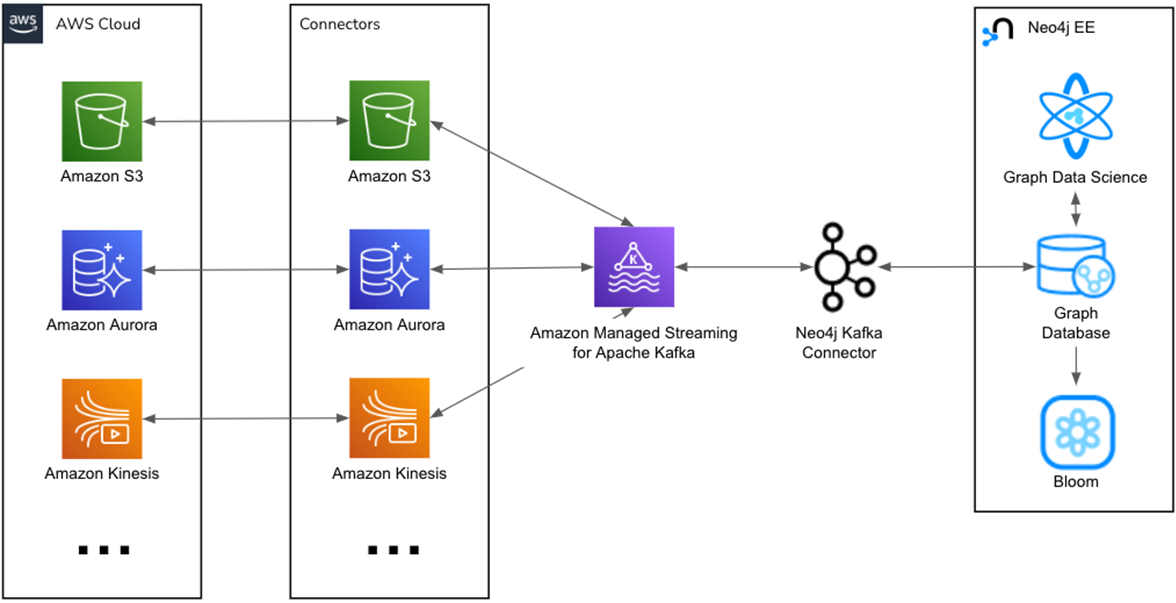
Figure 5 – Neo4j streaming architecture.
Using the Kafka Connect Neo4j Connector, the graph database is able to connect to Amazon Managed Streaming for Apache Kafka (Amazon MSK). From there, myriad MSK connectors can be used to connect to systems including Amazon Simple Storage Service (Amazon S3), Amazon Aurora, and Amazon Kinesis.
In a similar way, you can dig into the architecture for the batch component of a Neo4j application on AWS, as shown below.
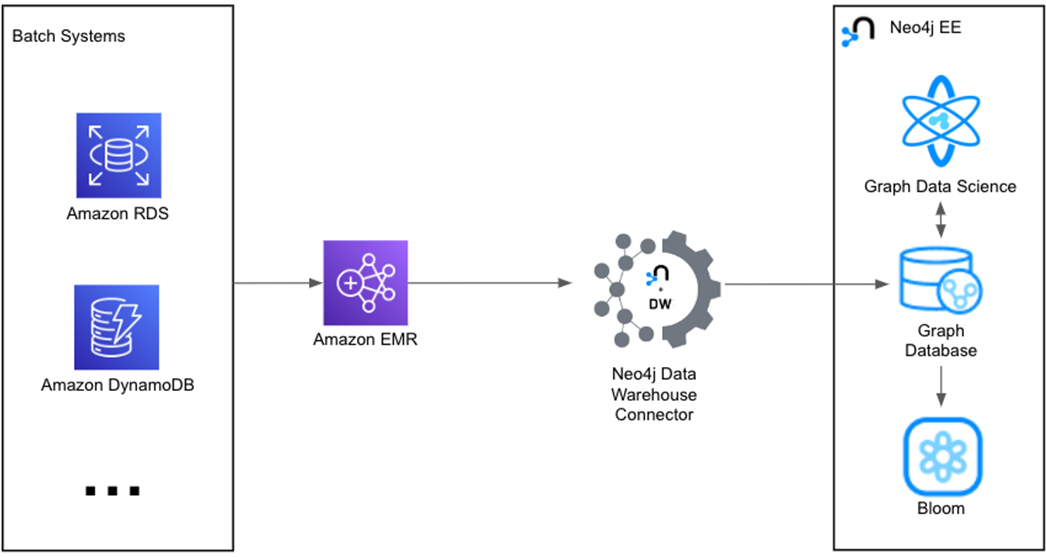
Figure 6 – Neo4j batch architecture.
The Neo4j Data Warehouse Connector enables connectivity to Amazon EMR clusters running Apache Spark. That transformation layer lets you integrate to Amazon Relational Database Service (Amazon RDS), Amazon DynamoDB, Amazon Redshift, and other systems.
An emerging area is the use of graph technology in conjunction with tabular machine learning techniques, and a typical architecture on AWS is shown next.

Figure 7 – Feature engineering with Neo4j and Amazon SageMaker.
Amazon SageMaker provides rich implementations of supervised algorithms for tabular data. Those can be used in conjunction with Neo4j Graph Data Science to improve accuracy with features engineered based on the connections in data. Learn more about that in this AWS blog post.
The newest innovation in the graph ML space is related to large language models (LLMs). The pattern below has recently emerged.
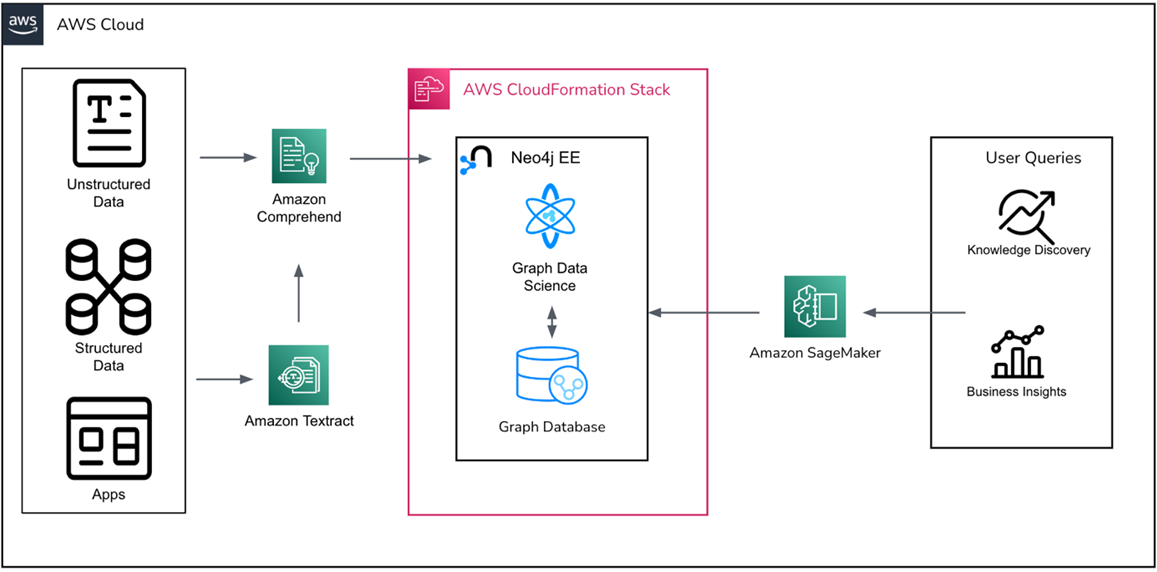
Figure 8 – Knowledge graphs for domain-specific LLMs.
In this model, data is processed from a variety of systems using AWS services such as Amazon Textract and Amazon Comprehend. Data is then written to Neo4j to form a knowledge graph.
Users interact with an LLM directly, entering natural language queries. The LLM transforms those into the graph query language, Cypher, and uses it to query the graph. This allows LLMs to make use of domain-specific knowledge graphs, making them more adept at answering questions than generic approaches. Neo4j has helped customers with use cases related to customer service and employee upskilling with this approach.
Summary
When should you use a graph database like Neo4j on AWS? In this post, we reviewed how the answer spans a wide variety of use cases including fraud detection, master data management, Customer 360, logistics, supply chain, drug discovery, and clinical trial management.
These use cases are relevant across most industries, including financial services, manufacturing, and healthcare and life sciences.
The common thread is connected data, as graph databases are extremely useful for extracting value from the connections in your data. On AWS, there are common architectures that enable this and Neo4j interoperates with AWS services including Amazon MSK, Amazon EMR, and Amazon SageMaker. This allows you to quickly get value from the data already in your systems on AWS.
The Neo4j Enterprise Edition in AWS Marketplace provides a click-to-deploy to get started. You can also read more about Neo4j and AWS, and if you’d like to discuss a use case, dataset, or architecture, reach out to ecosystem@neo4j.com with any questions.
.

.
Neo4j – AWS Partner Spotlight
Neo4j is an AWS Data and Analytics Competency Partner that enables organizations to unlock the business value of connections, influences, and relationships in data.