AWS Compute Blog
Building serverless applications with streaming data: Part 1
February 12, 2024: Amazon Kinesis Data Firehose has been renamed to Amazon Data Firehose. Read the AWS What’s New post to learn more.
Streaming data presents a unique set of design and architectural challenges for developers. By definition, streaming data is not bounded, having no clear beginning or end. It can be generated by millions of separate producers, such as Internet of Things (IoT) devices or mobile applications. Additionally, streaming data applications must frequently process and analyze this data with minimal latency.
There are several general goals of streaming data workloads. The first is to capture the messages durably and persist these in an ordered queue. Next, the system must process and aggregate the records, keeping up with the pace of new messages arriving. Finally, the application loads the results into other downstream systems for analysis or further processing.
Each of these tasks can be major challenges for traditional, server-based architectures. To ingest the constant stream of messages, you must successfully scale clusters of brokers, and transport and store the data. Whether your compute pipeline is running on EC2 instances or physical services, you must scale those fleets depending upon traffic. There are also data and networking management considerations that require specialized knowledge.
In this series, I show how you can build a streaming data backend by using a serverless approach. I provide a complete example application that you can deploy to your AWS account. I introduce key streaming concepts and how to handle these in a serverless workload:
- Part 1: Deploy the application, test the workflow, and review the architecture.
- Part 2: Comparing options for ingesting streaming data into Amazon Kinesis Data Streams and optimizing shard capacity.
- Part 3: Using Amazon Kinesis Data Firehose for transforming, aggregating, and loading streaming data in data stores.
- Part 4: Combining Kinesis with Amazon DynamoDB to support queries for streaming data.
- Part 5: Monitoring and troubleshooting capacity issues in Alleycat, and how to monitor streaming applications more generally.
The code uses the AWS Serverless Application Model (AWS SAM), enabling you to deploy the application more easily in your own AWS account. This walkthrough creates some resources covered in the AWS Free Tier but others incur cost, so each section describes the expected cost.
To set up the example, visit the GitHub repo and follow the instructions in the README.md file.
Introducing “Alleycat” – The 5-minute bike racing competition
Alleycat is a home fitness system that allows users to compete in an intense series of 5-minute virtual bicycle races. Up to 1,000 racers at a time take the saddle and push the limits of cadence and resistance to set personal records and rank on leaderboards.
The Alleycat software connects the stationary exercise bike with a backend application that processes the data from thousands of remote devices. The Alleycat frontend allows users to configure their races and view real-time leaderboard and historical rankings:

- Before starting, racers select an identity and one of several different classes, which represent different courses with graduating difficulty levels.
- The Leaderboard section shows all-time rankings for the biking class selected.
- In Race Results, racers can see the historical rankings for completed races.
- In Realtime rankings, there are two display options:
- In “All time”, the racer can compare their race output to the all-time rankings during the current second in the race. This allows a racer to see their performance as if everyone was racing at the same time as the current race.
- In “Here now’, the racer sees all competitors who are racing around the same time.
Each class is a continuous series of 5-minute races and participants are automatically bucketed into a virtual race based upon their start time. Because of the staggered start times, each 5-minute race has up to 9 minutes and 59 seconds of data collection:

During the race, the bike’s display shows calculated metrics and global leaderboard rankings across 40,000 customers. For historical leaderboard rankings, this means that the second-by-second display must show rider data for the current second. Each rider’s bike shows the leaderboard for the current second, even though other competitors may have finished the race.
How racing data is logically aggregated
During the race, the bike emits messages every second containing important device metrics. These are JSON-formatted collections of attributes representing point-in-time data:
{
   "event":"update",
   "deviceTimestamp":1620051628707,
   "second":13,
   "raceId":5400172,
   "name":"Adell",
   "racerId":8,
   "classId":3,
   "cadence":74.2,
   "resistance":74
}
The backend application continuously receives these messages from different racers in different races. It must collect and aggregate the data to summarize race statistics and publish back to the exercise bike’s frontend application:
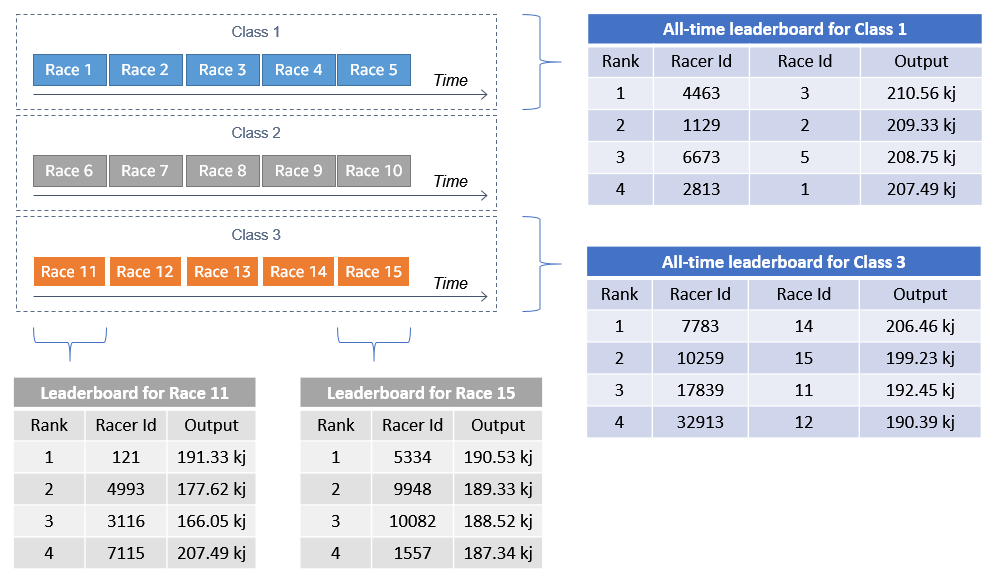
There are two types of leaderboard in the application:
- Leaderboards for current races, showing the relative performance of racers who compete around the same time.
- All-time leaderboards, showing the top rankings for classes over all races.
Architecture overview
The main AWS services used in Alleycat are Amazon Kinesis, AWS Lambda, Amazon DynamoDB, and AWS IoT Core:
- Kinesis is a fully managed service that handles many of the underlying data collection and processing tasks. Kinesis Data Streams is a highly scalable service that can significantly simplify the ingestion and processing of streaming data. Kinesis Data Firehose is a low-administration tool that can ingest and load streaming data into data stores such as Amazon S3.
- Lambda works with Kinesis to enable custom processing of batches of messages. The combination of the two services allow you to build flexible data-processing microservices to process gigabytes of incoming data in near-real time.
- DynamoDB is a highly performant NoSQL database that can scale to support write-heavy workloads. In streaming applications, DynamoDB tables can provide storage for processed results and index-based queries.
- AWS IoT Core enables publish-subscribe capabilities for large numbers of client applications. Clients can send data to the backend using the AWS IoT Device SDK. After processing, the backend can publish aggregation and status messages to AWS IoT Core, which fans out the messages to clients using topics.
The example application has the following backend architecture. Each section supports a different type of data functionality used by the frontend application:

There are five distinct functional areas for this application that correspond to the major topics in this blog series:
- Ingestion layer: the physical bike is an IoT device, which sends racing data to an IoT topic. An IoT rule routes this data to Kinesis Data Streams.
- Near-real time data: for per-record calculations and per-race aggregations, a Lambda function uses calculate data aggregates before saving these to a DynamoDB table. A DynamoDB stream invokes a Lambda function to publish these aggregates back to the frontend via an IoT topic.
- Historical data: Kinesis Data Firehose aggregates incoming records and stores historical datasets in Amazon S3. This provides the frontend with second-by-second data for all-time best performance by racer.
- Reference/query data: a Lambda function consumer publishes data to a DynamoDB table to support frontend queries. This provides leaderboard information, per-racer best performance information, and second-by-second data per race.
- Frontend application: this example application uses a web frontend to simulate an application running on a physical exercise bike. The end user can start races, view current race information, and historical data.
Deploying the application
In the GitHub repository, there are detailed deployment instructions for each section of the example application. The repo contains separate directories for the frontend, ingestion layer, and each Kinesis consumer solution shown in the reference architecture.
Note that there are costs associated with deploying and running this example application. The main services used for streaming data, such as Kinesis Data Streams and Kinesis Data Firehose, do not have an allowance in AWS Free Tier. Additionally, depending upon the simulator settings you choose, testing this application may generate a large amount of data.
Real-time configuration and DynamoDB table
To deploy the base resources used by the other AWS SAM applications, navigate to the README file. Follow the deployment instructions in steps 1-3. Note the outputs of the two deployment stacks, since these are used as parameter inputs in the other AWS SAM templates.
Streaming solution templates
There are three AWS SAM templates referenced in step 4. Each template corresponds to a specific piece of functionality covered in the blog series and can be deployed independently.
Frontend application
The frontend application allows you to start a single race and view race results and historical records. This is a Vue.js application that runs in a browser. Follow step 5 in the README instructions in the frontend directory to install the application on your local machine. You must provide the outputs from the AWS SAM templates in the application’s configuration.
To launch the frontend application:
- Change to the frontend directory.
- Run
npm run serveto start the development server. After building the modules in the project, the terminal shows the local URL where the application is running:
- Open a web browser and navigate to http://localhost:8080 to see the application.
- Open the developer console in your browser (for Google Chrome, Mozilla Firefox and Microsoft Edge, press F12 on the keyboard). This shows console logging and can help you understand the flow of data in the application.

1. The application panel.
2. The browser’s developer console.

Simulator application
The simulator generates data for up to 1,000 racers for a single race. It creates data for testing the streaming solutions and provides competitors for when you use the frontend to start a race. Follow the deployment instructions in step 6 of the README file and then start the simulator from the command line. Note that using a higher number of racers creates more messages, resulting in a higher cost of running the application.
Testing the application
To configure a single-competitor race, choose a racer ID in the slider and select a class from the dropdown. Choose Start Race and the frontend starts sending messages to the backend application. You can see these in the Messages panel at the bottom of the screen:

As the series explores more complex issues of aggregating data from a large number of users, I recommend using the simulator to generate sample data for multiple racers.
Conclusion
In this post, I introduce the Alleycat racing application for processing streaming data. I explain the virtual racing logic and provide an overview of the application architecture. I summarize the deployment process for the different parts of the solution and show how to test the frontend once the deployment is complete.
Part 2 compares options for ingesting streaming data into Amazon Kinesis Data Streams and optimizing shard capacity.
For more serverless learning resources, visit Serverless Land.