AWS Contact Center
Building a serverless contact center wallboard for Amazon Connect
One of the most common requests in the contact center space is for a wallboard – a real-time dashboard of information relevant to the staff or management who work there. Normally this is displayed on a large screen in the contact center. Data on the wallboard generally come from the contact center service, but you might want to display information from other sources as well. Many customers choose to have several different wallboard formats displayed in different places around the office, even on the screen of each agent. This is particularly useful if the agents are working remotely. Each agent can have a view of information specific to them as well as relevant to the entire contact center, allowing them to adjust their workflow to deal with the demands placed on the team.
In this post, you see how to design a serverless application that can be used as a wallboard for Amazon Connect. It gathers data about agent events, real-time Amazon Connect statistics, and historical Amazon Connect statistics, then renders that into a predetermined format in a browser. Multiple wallboard formats are supported concurrently using the same dataset, and the system can be extended to allow data to be added from any other relevant source.
This blog post describes how to create the wallboard environment. The components are:
- An Amazon DynamoDB table that stores the configuration information for each wallboard you define, as well as the non-real-time data that is collected from other external sources (such as the number of waiting emails) that you may want to display.
- A file that describes each wallboard. A Python script takes the file and puts the configuration for the wallboard into the DynamoDB table.
- An AWS Lambda function that consumes agent events as they are published by Amazon Connect to Amazon Kinesis Data Streams. This allows you to display an agent’s current status on the wallboard.
- A Lambda function that polls the Amazon Connect historical metrics API periodically to retrieve data of interest.
- A Lambda function that renders the wallboard on demand when queried via Amazon API Gateway. It returns an HTML table that can be displayed by the browser that calls the endpoint. This function also polls the Amazon Connect real-time metrics API for appropriate data.
The prerequisites you need are as follows:
- An AWS account.
- An Amazon Connect instance set up to receive or make calls.
The following diagram shows the various components:

Now, let’s look at each piece individually. In order, we have:
- Wallboard definition
- Displaying real-time and historical data
- Creating and using calculations
- Using thresholds to change display colors
- Displaying agent status
- Showing all agents
- Wallboard import
- Agent event handling
- Retrieving historical data
- Wallboard rendering
Initial setup
To set up the entire environment as shown above, launch this serverless wallboard CloudFormation template in the region of your choice. The CloudFormation template will only successfully deploy in regions where Amazon Connect is available. You can see which regions AWS services are available in using on our website.
To deploy the template, follow these instructions:
- Provide a stack name: for example “ConnectWallboard”.
- Provide the Amazon Resource Name (ARN) of the Kinesis Data Streams stream that is collecting agent events. The process for configuring the agent event data delivery is shown in the Amazon Connect agent event streams documentation.
- Choose Next.
- On the “Configure stack options” screen choose Next.
- On the “Review” screen choose I acknowledge that AWS CloudFormation might create IAM resources. and then Create stack.
One of the outputs from the template is the API Gateway URL – this is what you call in order to retrieve the wallboard for display.
You can find the rest of the code for this blog post in the same serverless wallboard GitHub repo.
The API Gateway that has been created for you does not include authentication. If you require your API Gateway calls to be authenticated, ensure that you configure API Gateway appropriately.
Wallboard definition
Information displayed in each cell on the wallboard can be one of the following:
- Static text. The text and background color of each cell can be set individually for each cell. If not set, a default color is used.
- Numeric data, such as number of contacts in queue or the number of agents online.
- A numeric value that is the result of a calculation using other numeric data.
- Individual agent status.
- A combination of static text and a numeric value or agent status.
Thresholds can be set for each numeric value – a warning level and an alert level. This may be for values greater than the norm; for example, when wait times exceed service level agreements (SLAs) or for values lower than expected (for example, when there are fewer than a certain number of agents logged in). Threshold colors can be set for any cell regardless of whether the numeric value for the threshold is displayed there. This allows you to change the color of any other cell that you might also want to highlight.
Information can be drawn from multiple queues and Amazon Connect instances, giving you the ability to create a wallboard that spans the entire contact center.
Displaying real-time and historical data
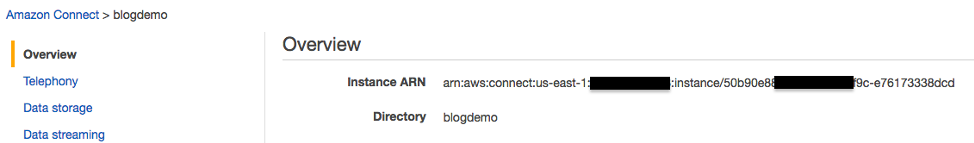
To collect real-time or historical data from Amazon Connect you need to specify the Amazon Connect ARN, the queue ARN, and the metric required.
You can find the Amazon Connect ARN in the console by viewing the Amazon Connect instance details:
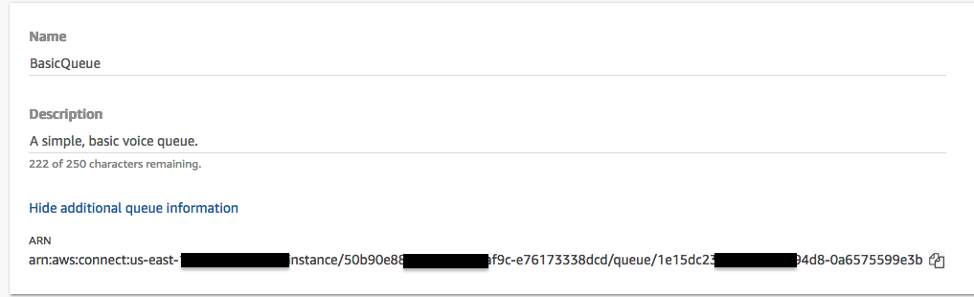
You can find the queue ARN in the console by logging into the instance as an administrator, editing the queue, and choosing “Show additional queue information”.
For real-time data, the Lambda function that is rendering the wallboard is responsible for polling the Connect real-time data API. In order to limit the number of times the API is potentially called (as there may be many wallboard instances) there is a timer in the code (by default set to five seconds) which caches data. You can modify the “RealtimeTimeout” variable in the Lambda rendering function to change the API call frequency.
Historical data is collected each minute by a separate Lambda function – in this case, “historical” means day-of aggregate data. The data is stored in the DynamoDB table for consumption by the Lambda function that renders the wallboard table.
Consider the following example for a single queue in one Amazon Connect instance:
| Agents Available | Contacts in Queue | Longest Waiting | Contacts Handled Today | Abandoned Calls | Average Handle Time |
| 5 | 3 | 45 | 300 | 4 | 129 |
For this particular wallboard, you need to create a file that describes it that you import into the DynamoDB table using the tool described below. The definition file shown here creates a six-column, two-row wallboard with some static text and a mix of real-time and historical metrics.
When you are referencing data sources that are sourced from your Amazon Connect instance, you must provide a reference to it. Generally, most data is identified by part of the Amazon Connect instance ARN and part of the queue ARN. In the example below you see “xxxxxxxx-xxxx-xxxx-xxxx-xxxxxxxxxxxx” (which is part of the Amazon Connect ARN) and “yyyyyyyy-yyyy-yyyy-yyyy-yyyyyyyyyyyy” (which is part of the queue ARN).
In the AWS Management Console, each Amazon Connect ARN looks like:
arn:aws:connect:<region>:<account>:instance/<Connect unique identifier>
and each queue ARN looks like:
arn:aws:connect:<region>:<account>:instance/<Connect unique identifier>/queue/<Queue unique identifier>
The wallboard definition file only requires you to use the “Connect unique identifier” component – that becomes the “xxxxxxxx-xxxx-xxxx-xxxx-xxxxxxxxxxxx” below and “Queue unique identifier” – that becomes the “yyyyyyyy-yyyy-yyyy-yyyy-yyyyyyyyyyyy”.
In this file, we have the following information:
- WallboardTemplateFormatVersion: Right now this is version 1 of this template file. The import script doesn’t check for this, but some forward planning can be useful.
- Description: This is for the humans to read, as is every other “Description” field in this file. It won’t be imported into the database, but it makes things easier for the people involved. This can be omitted without harming anything.
- Identifier: This is a mandatory field – it is the label for this particular wallboard definition. When we render the wallboard, we need to use this label. You may import multiple different wallboard definitions (they all coexist happily in the DynamoDB table) as long as you use a different identifier. Each wallboard uses the same data but can display it in a different way. This allows you to have a main display on the wall but have many smaller dashboards displayed on each agent desktop that are customized to their particular function.
- TextColor: This is the default text color for the wallboard and is an optional field. If not specified, the color is inherited from the HTML page you embed the wallboard in or your style sheet. (See the render section for details.)
- BackgroundColor: Ditto as for “TextColor” above.
- TextSize: See “TextColor” above.
- Sources: In this section, we define where we want to collect data from.
- Source: This is the name of the source we’re creating. We reference this when putting this data into the wallboard that the user sees.
- Description: As above, optional but handy for human beings.
- Reference: This contains the Amazon Connect instance ARN, the queue ARN and the metric required, all separated by colons. The list of available real-time metrics is shown in the Amazon Connect documentation. The list of available historical metrics is here. While real-time metrics are retrieved automatically, historical metrics are retrieved by a Lambda function as explained in the section below.
- Rows and Cells: Here we define what goes in the wallboard table. We do this by creating an entry for each cell that is displayed. Each row and cell must be numbered appropriately and have the following fields defined:
- Text: This is static text that is displayed in the cell.
- Reference: This points to the data source that was created in the earlier section.
- BackgroundColor: The background color for this individual cell.
- Color: The text color for this individual cell.
- TextSize: The text size for this individual cell.
Calculations
You can take the output of a numeric data point (as defined above), perform simple calculations on them and display the result on your wallboard. A wallboard configuration file to do this might look like this:
In this example, we collect some data from the real-time metrics. (The data can be sourced from anywhere, including historical metrics or even injected into the DynamoDB table by a Lambda function you make.) Next we perform some basic calculations on them, and then display the results in some cells with some text.
The calculation that multiplies the agents available isn’t a “real” metric, but it proves that you can perform just about any simple mathematical calculation you need. All outputs from calculations are integers.
This example also shows data being retrieved from two different queues.
Using thresholds
You may want to change the background color of cells based on whether a particular value has crossed a warning or alert threshold. Once you configure a threshold for a specific value, you can apply the display of that threshold to any cell whether it holds that value or not. This allows you to turn an entire row yellow when a specific value crosses the warning threshold.
An example of how to configure thresholds is as follows:
In this example, the threshold “AgentThreshold” goes into warning (yellow) when the number of agents available drops below 10 and into alert (red) when it is below five. Similarly, the “CallThreshold” goes into warning when the number of calls waiting goes above 20 and into alert when above 30.
From there, the individual cells reference a specific threshold that controls the color of that cell. If the cell has a background color specified (either individually or via the default), then that is overridden by the threshold color. The cell does not have to hold the value that is used by that threshold. This would allow you to highlight a whole row of cells when just a single threshold is crossed.
In “normal” operation this example wallboard looks as follows:
| Agents Available
40 |
Contacts in Queue
5 |
If the available agents were to drop to eight, and the calls waiting increase to 35 the wallboard would, then display:
| Agents Available
8 |
Contacts in Queue
35 |
Displaying agent status
Let’s assume we have a small contact center and want to show the status of six agents on the wallboard. The layout looks like this:
| Alice | Bob | Carlos |
| Dave | Erin | Eve |
Naturally, we want something there to show the status of each agent (perhaps a label showing their actual status and a color so it’s easy to see from a distance). For now, let’s work with this as a starting point. A YAML definition file for this particular wallboard looks like this:
In this file, we include the following:
- AgentStates: Here we define each possible agent status and the accompanying background color. By default, in an Amazon Connect deployment there are only two states defined (“Available” and “Offline”), but you can add more. If you do this, remember to add them into the definition otherwise there won’t be a color associated with them. If you have a state that isn’t defined here, the background color is whatever the default is for this wallboard. The color for each state should be a valid HTML color name because it gets directly inserted into the HTML during the render process.
- Rows and Cells: As above, we’re defining the structure of the visible wallboard here.
- Description: Again, optional and just for humans to read.
- Text: For an agent state, it makes sense to put the agent name here, but in reality it can be anything at all. You might want to use nicknames instead of real names. The field itself is optional, but for our purposes it wouldn’t really be handy to have nothing there at all. When the wallboard is rendered, the actual agent state appears below the agent’s name.
- Reference: This field is mandatory and must contain the login name for the agent exactly as it is defined in the directory that the agents log into. So, if the login name for Alice is “alice” that’s what goes here. If her login name is “alice.brown” then that must go here instead.
As the agent status changes, the colors in the cells change to reflect the current status of that agent.
Listing all agents
One of the challenges in listing agent states in the preceding example is that the list is static. Every time you add an agent to Amazon Connect, you must change the wallboard configuration. And there’s also the potential problem of having agents displayed on the wallboard who aren’t active right now because they’re not logged into the system. You might want to not display them to save space for active agents.
To create a display where the agent names are filled in dynamically, you can use “=activeagents” or “=allagents” as the data reference. Your YAML definition file might look like this:
This wallboard has six cells and the details of the first six “active” agents (any agent who isn’t in a “Logout” state) appears in alphabetical order. Now no “Text” field is required. Because the agent details are dynamic, they are automatically pulled from the “First name” and “Last name” attributes in the directory. Make sure those are filled in.
Instead of “=activeagents” you can also use “=allagents”, which shows agents in any state including “Logout”. If you have more agents than cells, then the overflow agents are ignored and not displayed. If you have more cells than agents, you have blank cells.
Wallboard import
Now that you’ve got a wallboard definition file, it must be imported. Download wallboard-import.py, which takes your definition file and saves it in the DynamoDB table. To run this, you need to have a Python interpreter installed and have the boto3 AWS SDK for Python installed.
Then run the script to import your definition file:
./wallboard-import.py <wallboard definition filename>
If you change your wallboard definition template, you can run the import a second time. It replaces the existing values in the table.
By default, the table name is “ConnectWallboard”, however you may alter this by setting the environment variable “WallboardTable” to the name of the DynamoDB table you’re using.
You need the appropriate IAM permissions in your account as per the following IAM policy. This is so the import script can write to the DynamoDB table.
If you’re using a different table name, be sure to change “ConnectWallboard” in this policy. You need to replace “111122223333” with your AWS account number and the region name (“us-east-1”) if you’re running in a different AWS region.
If you have multiple wallboards you want to display that reference the same Amazon Connect instance, you can import several definition files to coexist in the DynamoDB table.
Wallboard rendering
The Lambda function that renders the webpage puts together all the disparate pieces of data and returns them as a single consumable (in this case an HTML table). When triggered, it performs the following tasks:
- Given the wallboard name (passed to the function from API Gateway) it reads the configuration from the DynamoDB table.
- Because wallboard definitions rarely change, it only checks for updated configuration every 300 seconds. This is controlled by the “ConfigTimeout” variable at the top of the function or the “ConfigTimeout” environment variable. This means that any changes you make to a wallboard definition make take up to five minutes to appear.
- The DynamoDB table name can be changed by specifying it in the “WallboardTable” environment variable.
- It reads the existing data from the DynamoDB table. This includes agent states and any other numeric data that have been stored in the table by other processes.
- Real-time statistics are retrieved from the Amazon Connect API. The “RealtimeTimeout” variable controls how often this happens. By default new data is fetched if data has not been retrieved from the API in the last five seconds.
- The output table is rendered based on the complete set of data. During the render process, any calculations required are also performed. Any thresholds are checked, and the appropriate background colors are set for the cells that reference that threshold.
The output from the Lambda function is a raw HTML table, not a complete HTML page. The intention is that the front-end page calls API Gateway and inserts the table into the target page for display.
Wallboard testing
From a command prompt, you are able to use wget or curl to test everything as follows. You can find the URL you must call in the outputs of the CloudFormation template you used earlier.
$ curl https://xxxxxxxxxx.execute-api.us-east-1.amazonaws.com/wallboard
<div class="error">No wallboard name specified</div>
This call deliberately failed because it didn’t specify which wallboard to load, so the Lambda function returned an error message.
$ curl https://xxxxxxxxxx.execute-api.us-east-1.amazonaws.com/wallboard?Wallboard=foo
<div class="error">Wallboard foo not found</div>
Another deliberate fail because a wallboard named “foo” isn’t defined.
$ curl https://xxxxxxxxxx.execute-api.us-east-1.amazonaws.com/wallboard?Wallboard=agents
<table class="ConnectWallboardagents" style="border: 1px solid black; border-collapse: collapse; margin-left: auto; margin-right: auto; color: black; background: white; font-size: 20; font-family: sans-serif;" class="wallboard-agents">
<tr>
<td label="R1C1" class="R1C1" style="border: 1px solid black; padding: 5px; background: green;"><div class="text">Alice</div><div class="data">Available</div></td>
<td label="R1C2" class="R1C2" style="border: 1px solid black; padding: 5px;"><div class="text">Bob</div></td>
<td label="R1C3" class="R1C3" style="border: 1px solid black; padding: 5px;"><div class="text">Carlos</div></td>
</tr>
<tr>
<td label="R2C1" class="R2C1" style="border: 1px solid black; padding: 5px;"><div class="text">Dave</div></td>
<td label="R2C2" class="R2C2" style="border: 1px solid black; padding: 5px;"><div class="text">Erin</div></td>
<td label="R2C3" class="R2C3" style="border: 1px solid black; padding: 5px;"><div class="text">Eve</div></td>
</tr>
</table>
The third call works and returns a raw HTML table that can be rendered by a browser.
The intention is that you have a webpage that queries API Gateway and inserts the table that has been returned into your page. To make getting started easier, download this serverless wallboard simple HTML example. You need to edit it to ensure that the API Gateway invoke URL is correct, including the stage name and wallboard identifier. The invoke URL is the same as what you used in the test above. A refresh interval is defined in milliseconds and specifies how often to query API Gateway for new data.
Some things to note about the returned HTML:
- The label for the wallboard table is always “ConnectWallboardIdentifier” where “Identifier” is what you specified in the wallboard definition file. The CSS class is “wallboard-Identifier”. This makes it possible for you to apply styles to the table as a whole based on the originating page.
- Each table cell has a unique class: “R<RowNumber>C<CellNumber>”. You can use this to apply individual styles to a cell. The label for the cell is the same just in case there is some programmatic need.
- Static text in each cell has a class of “text”, and dynamic data (such as the agent state) will have a class of “data”.
Conclusion
In this post I’ve shown you how to create a flexible wallboard for Amazon Connect using serverless technologies such as Lambda, API Gateway, Kinesis Data Streams and DynamoDB. You can use this to create multiple wallboards to display in your organization using a single table, API Gateway instance, and the same Lambda functions.