AWS for Games Blog
Detect anomalies in games with Amazon Lookout for Metrics and the Game Analytics Pipeline Solution
Game analytics can be a powerful tool to help studios throughout the development cycle. Insights driven from game data can help you to create more engaging, personalized experiences for players and more efficiently monetize games. it can also help with fraud investigations, as well as performance monitoring and error reporting.
Anomaly detection is commonly used by data analysts to identify outliers and deviations in data. In games, anomalies are unexpected changes in telemetry or transactional data. These anomalies can indicate all kinds of issues, from a technical glitch in the game or underlying infrastructure, to an untapped marketing opportunity to increase in-app purchases and player engagement. Studios are gathering more game data than ever before, but to use it successfully, detecting unexpected changes and responding to findings immediately is essential. A delayed response can lead to missed opportunities, the loss of customer trust, and ultimately revenue.
Anomaly detection supports all kinds of business functions in game development. LiveOps teams can track metrics around game health such as player churn, active users, and win rates to assess overall player engagement and satisfaction. Site reliability engineers can track operational infrastructure metrics such as latency, CPU utilization, and error rates to ensure a smooth and seamless user experience. Marketing teams can also track metrics like user acquisition in response to campaigns and revenue generated by in-app purchases.
Traditional methods used to detect anomalies come with several challenges. Anomaly detection technology stacks are complex to manage and scale, needing a dedicated team with the knowledge, resources, and time to operating them. Rule-based detection methods don’t typically handle seasonality and significant fluctuation well, resulting in alert fatigue and missed anomalies. Anomaly detection isn’t usually real time. This means detection is only caused by downstream results, such as increased bug or abuse reports. Data engineers also take time working backward from multiple sources in order to trace a single root cause. Without immediately actionable results, developers can’t make informed changes based on those anomalies, ultimately resulting in lower player retention and engagement.
To better enable teams to address these traditional challenges, AWS recently introduced Amazon Lookout for Metrics, a service that uses machine learning (ML) to detect unexpected changes in metrics, helping you to proactively monitor the health of your game, diagnose issues, and find opportunities quickly – with no ML experience required. Here is an example of a Lookout for Metrics insight:
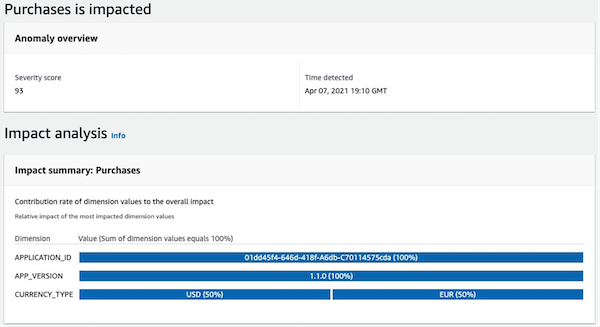
In this insight, Lookout for Metrics detected an anomaly for the purchases metric across the application_id, app_version, and currency_type dimensions. It found that for application 01dd45f4-646d-418f-A6db-C70114575cda and version 1.1.0 on 4/07 at 19:05 GMT, payments made with USD and EUR dropped significantly. Lookout for Metrics determined that this is an anomaly with a 93 severity score. This strongly indicates that an anomaly exists, based on comparisons with historical and other data. Instead of having to create rigid business rules to determine alarming revenue drops, Lookout for Metrics used the historical data to generate a model to identify the anomaly.
Lookout for Metrics overview
Lookout for Metrics uses ML to automatically monitor the metrics most relevant to businesses with greater speed and accuracy. It also simplifies the steps to diagnose the root cause of anomalies, like unexpected dips in player logins, in-app purchase transaction failure increases, and rises in new user sign-ups.
Lookout for Metrics goes much further than simple anomaly detection. It also allows developers to set up autonomous monitoring for important metrics to detect anomalies and identify their root cause in just a few steps. This is accomplished with the same technology used by Amazon internally to detect anomalies in its metrics—all with no ML experience required.
Lookout for Metrics monitors and identifies anomalies in your data through a resource called a Detector. Detectors utilize ML to find data patterns, and distinguish between expected variations in data and legitimate anomalies. Lookout for Metrics reviews data from your datasource, a service or resource providing time-series data for analysis. The detector generates a copy of the metrics from your Datasource at specified intervals (ranging from five minutes to one day) and stores them in a Dataset. After giving your detector a datasource, choose fields to be the dataset’s Measures—the primary fields that the detector monitors. You can also configure up to five additional fields as Dimensions. Dimensions are secondary fields that create subgroups of measures based on their value. Each measure and dimension combination is called a Metric. For example, you can choose a field named “availability” as a measure. If you don’t choose a dimension, then the detector monitors the availability across all records. If you choose a field named “country” for a dimension, then the detector monitors the availability in each country as a separate metric: “availability in Canada”, ”availability in Italy”, and so on. Finally, to send notifications or initiate a processing workflow when a detector identifies an anomaly, you can create an Alert. Alerts can target an Amazon SNS topic to distribute anomaly detection notifications or an AWS Lambda function to launch an automated processing job.
Solution walkthrough
Let’s walk through the steps for setting up a Lookout for Metrics Detector using the data ingested and processed by the Game Analytics Pipeline Solution. The Game Analytics Pipeline solution helps game developers launch a scalable serverless data pipeline to ingest, store, and analyze telemetry data generated from games and services. Here, you will utilize the metrics generated by the Kinesis Data Analytics application and stored in a custom CloudWatch metrics namespace. You will create a Lookout for Metrics detector and utilize the custom namespace as the dataset in which anomalies are being detected. Finally, after live data has been assessed by the detector, various anomalies can be identified by the detector in an interactive dashboard.
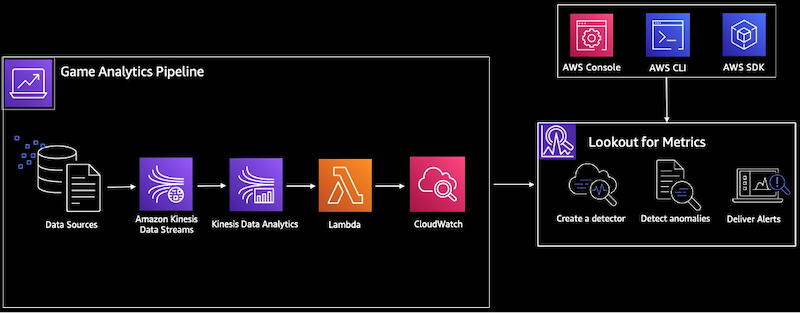
Here is an architecture diagram for the infrastructure deployed in this tutorial:
Requirements
Ensure you have access to the following before starting this tutorial:
1. An AWS account
2. The Game Analytics Pipeline solution deployed in your AWS account. Follow steps 1 and 2 in the Implementation Guide for more information.
This tutorial walks through an example anomaly generated from sample game events. The flow of events are:
- Random event generation from a python script provided by the Game Analytics Pipeline solution.
- Events are sent to Amazon Kinesis Data Streams, then to the real-time component of the Game Analytics Pipeline, consisting of Amazon Kinesis Data Analytics, AWS Lambda, and then AWS CloudWatch.
- The CloudWatch dimensions from the Game Analytics Pipeline can be viewed from the CloudWatch dashboard generated by the solution, but they will also send data to an Amazon Lookout for Metrics detector, a resource that monitors a dataset and identifies anomalies.
- The CloudWatch dimensions will be set as a dataset source for the detector, and the detector can poll incoming data in a set interval for anomalous activity.
- Optionally, you can also set the data in the Amazon S3 data lake component of the Game Analytics Pipeline as a dataset source, and then detect anomalies from your historical data.
First, ensure that you are in a region supported by Amazon Lookout for Metrics, details can be found in this FAQ page. Change the region by selecting a different region on the top right navigation bar.
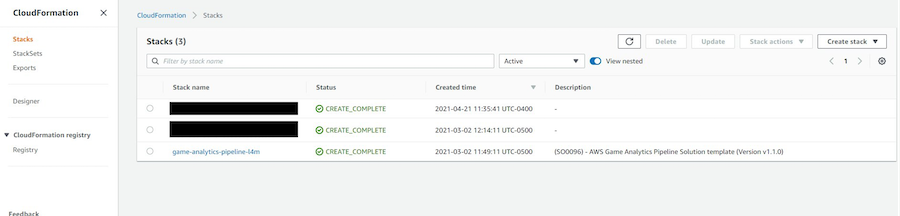
Confirm that the selected region is the same as the region in which you deployed the Game Analytics Pipeline. Do this by going to the CloudFormation console and verifying that you can see the Game Analytics Pipeline CloudFormation stack.
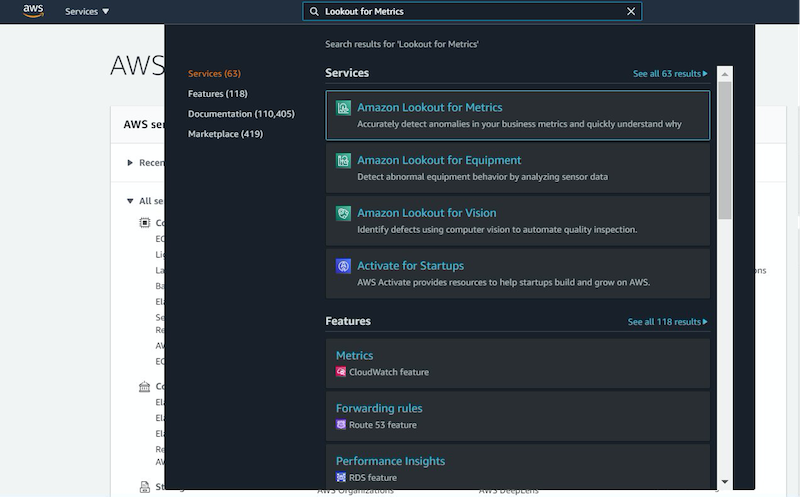
Go to the Amazon Lookout for Metrics console. Do this by entering “Lookout for Metrics” in the product search bar on the AWS Console.
Select “Create detector” on the right side to get started.
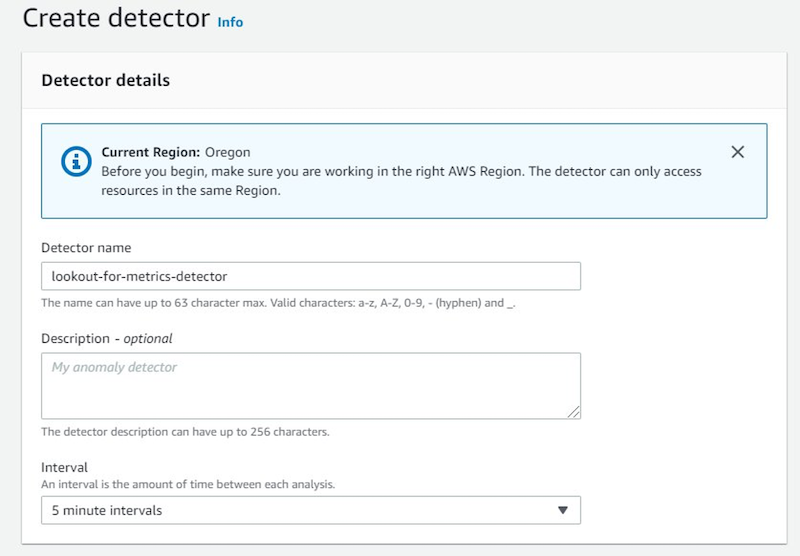
Enter a name for the detector, select 5 minutes for the interval, leave the remaining settings as default (no encryption or tags), and then select “Create” at the bottom.
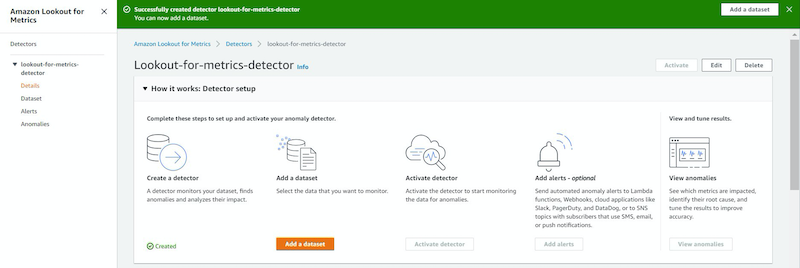
You should be taken to the detector’s detail page, which shows setup steps, high level configuration information, as well as metrics on data validation and logs on the detector. Select “Add a dataset” below.
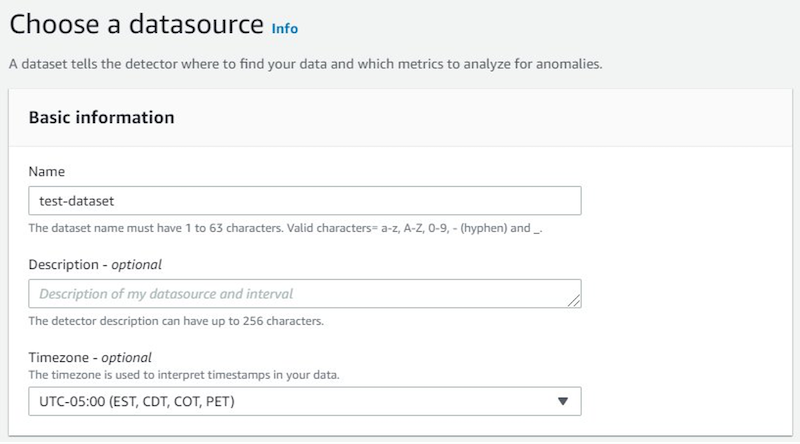
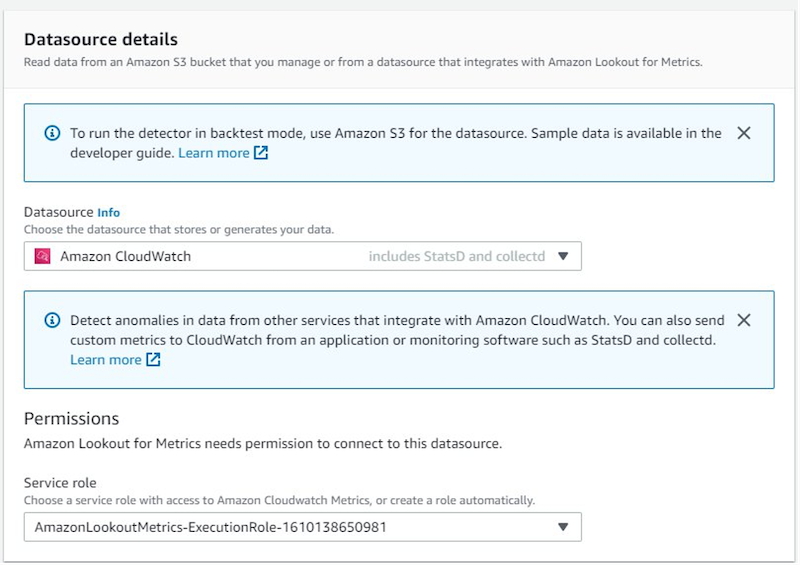
Under Basic information, enter a name for the dataset. Under Timezone, select the time zone in which you would like the data to be presented—likely your local time zone. Below, in Datasource details, select “Amazon CloudWatch” as the Datasource. For Service Role, select the dropdown and select “Create a Role”, and create on the confirmation screen. Leave everything else as default, and select “Next” below.
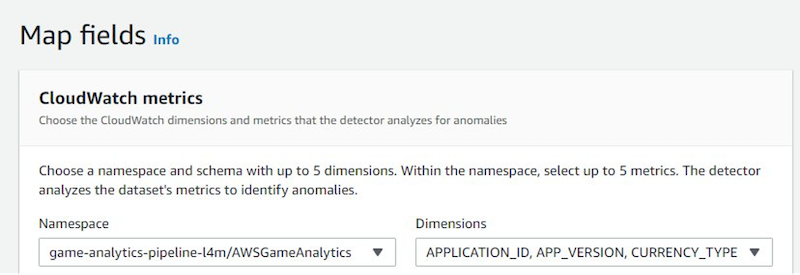
Next, select the CloudWatch namespace generated by the Game Analytics Pipeline solution. It should start with the same CloudFormation stack name, followed by AWSGameAnalytics after the separator. Then, under Dimensions, select “APPLICATION_ID, APP_VERSION, CURRENCY_TYPE”. Feel free to select others after running through the walkthrough.
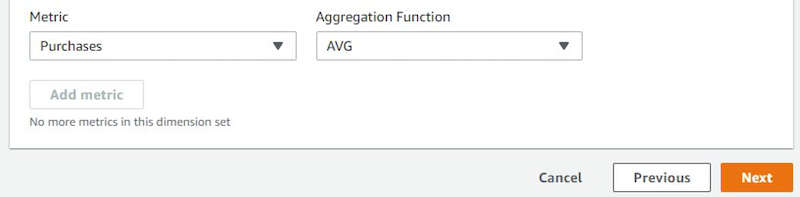
New options should pop up called Metric and Aggregation Function. For Metric, select “Purchases”, and for Aggregation Function, select “AVG”. Feel free to select SUM after running through the walkthrough. Select “Next” at the bottom.
Verify your settings and select “Save dataset” at the bottom.
You will be taken back to the detector’s detail page, with an updated status in the dataset section. Select “Activate” on the top right to activate the detector and look for anomalies. It can take between several minutes to hours to provision, and in rare cases, depending on configuration and data, up to 1-2 days.
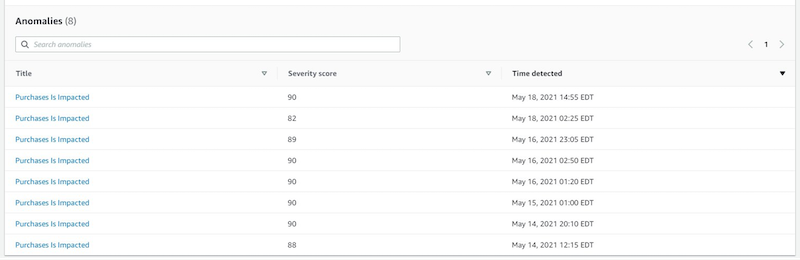
After the detector is activated, browse detected anomalies by selecting “Anomalies” on the left-hand navigation bar.

Below you will see a list of anomalies. Select one for a more detailed view of the anomaly data.
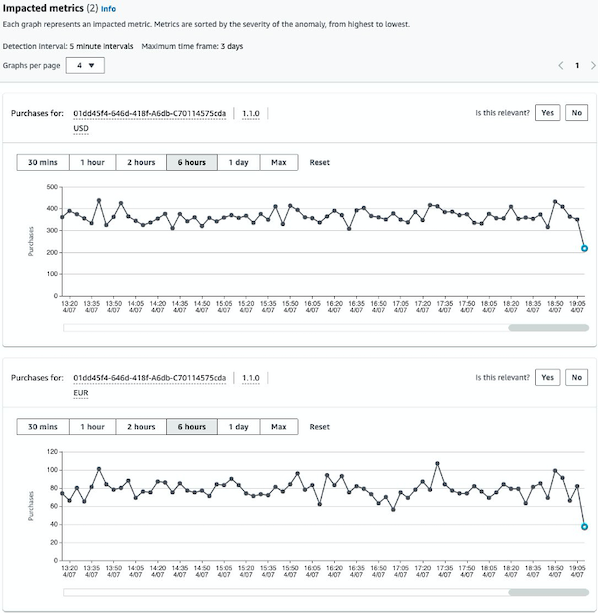
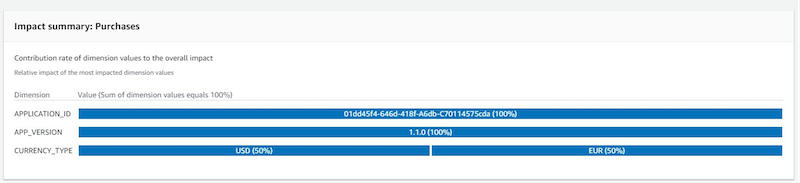
View the Impact summary, dimensions, and a graph of the metrics.

If you have multiple dimension values, such as the one below, then you will see multiple graphs stacked that show each dimension value’s graph.
You can also add optional alerting. To do so, in the left-hand navigation bar select “Details” under the detector to go back to the detail page, and then select “Add alerts”.

Enter an Alert name, Amazon SNS as the channel, and then select “Create a Topic” to go to the SNS console.
Follow the steps in the documentation below to create a sample topic and subscription, and then go back and select the created topic for the Lookout for Metrics alerting:
- https://docs.aws.amazon.com/sns/latest/dg/sns-create-topic.html
- https://docs.aws.amazon.com/sns/latest/dg/sns-create-subscribe-endpoint-to-topic.html
Now, select “Add alert”.
To dive deeper and learn more, head over to the Game Analytics Pipeline Implementation Guide and Developer Guide for detailed instructions on how to query and visualize data ingested by the game analytics pipeline. Also check out our blog ‘generate custom game events from Unity integrated with the Game Analytics Pipeline‘ for guides on ingesting custom game data with code examples. You can also read this blog post on Lookout for Metrics, dive deep into the Lookout for Metrics documentation, or contact us to enable your next project.