AWS for Industries
A Modern and Simple Approach to Address CSP’s Network Performance Analytics Challenges Using AWS
Communication service providers (CSPs) are looking for an agile network analytics solution allowing them to gain insight of their network performance while their networks evolve. Network elements are constantly introduced and upgraded to new software releases, introducing new services that provide additional data points to integrate into their network analytics solution. CSPs want to have flexibility and agility to gain insight with minimum effort while the performance dataset evolves with new services introduced.
Details provided in this post help to address CSP’s concerns that are inherent to a legacy on-premises approach. A serverless network analytics cloud-based architecture using AWS enables CSPs to:
- Gain insight on performance data associated with new network services with limited effort.
- Eliminate performance data duplication.
- Easily and cost effectively introduce machine learning (ML).
- Reduce network complexity.
- Reduce total cost of ownership (TCO).
Solution Characteristics
For a network analytics solution to provide value, it should align with network characteristics. It should complement the behavior of the network while providing an easy way to address challenges inherent to operating a mobility network.
A mobility network is comprised of numerous network functions (NFx) that are categorized as RAN, Transport, and Core. A CSP would capture performance data specific to the health of a given NFx in addition to characterizing its network performance. Each NFx has a dataset specific to itself, often aligned to 3GPP standards and network equipment providers (NEPs) specific innovations. That dataset evolves with time in conjunction with 3GPP releases and innovations from CSPs’ selected NEPs. A CSP’s network analytics solution should allow for automatic discovery of their NFx datasets.
This vast ecosystem of NFx presents a challenge to CSPs in determining how a given performance indicator from one function can impact a performance indicator on another function. For example, a CSP might experience performance degradation on a gNB. Such degradation can be the results of the gNB’s health state or of an AMF performance issue. A CSP’s network analytics solution should help to identify which components have the most negative impact to their overall network performances.
CSPs should have the ability to characterize the performance of their end customers. User equipment (UE) provides an additional measurement. The network characterization of the UEs events provides an additional vector of information for CSPs to handle. A CSP’s network analytics solution should be able to ingest a large amount of information in a scalable manner. There’s much more data points to analyze during network busy hours than when most users are sleeping at night.
CSPs should have the ability to make sense of all the data that is being ingested from many sources and in a variable format. NFx generating data and constantly being upgraded, UEs generating traffic and network events, variability of the environment impacting network performance, and much more. A CSP’s network analytics solution should simplify navigating through large amount of data by supporting data enrichment, data de-duplication, and learning from past events.
CSPs face data duplication challenges with legacy architecture. The same information is often case used by numerous disparate systems. NFx data is kept across the operation stacks through different paths. As such, network analytics solutions should leverage the concept of data lake to minimize/eliminate data duplication. The approach described in this blog enables operators to easily establish data governance to optimize their data utilization and minimize duplication.
Architecture
Components to a network analytics solution can be divided in four categories: ingestion, storage, processing and analysis, and consumption. CSPs are looking for a network analytics solution that can ingest massive amount of data from many disparate sources, store that data in an efficient and low-cost manner, process and analyze that data in a fast and responsive manner, and offer various methods of consumption for CSPs’ users and internal tools.
CSPs can build on top of this architecture to establish a correlation engine and add network configuration data to their data lake, increasing the performance and radius of insights of their network analytics solution.
 Figure 1: Network Analytics Architecture on AWS.
Ingestion
CSPs can leverage AWS Transfer for SFTP to periodically collect data from NFx where the collection period is aligned with NFx performance data generation and availability.
CSPs can leverage Amazon Kinesis and/or Amazon Managed Streaming for Kafka to inject real-time performance data such as events driven messages (for example, UE attach). Amazon Kinesis supports real-time data streaming where data collected is available in milliseconds to enable real-time analytics use cases. This is critical to support 5G applications that are latency sensitive and requires real-time analysis of their networks.
CSPs can leverage AWS Services such as Amazon EC2, Amazon EKS, and Amazon ECS to run a custom collection engine.
Storage
A network analytics solution should have flexible, scalable, and performant storage. CSPs can leverage Amazon Simple Storage Service (Amazon S3) for their network analytics needs. Amazon S3 enables CSPs to manage data and access controls, query-in-place for analytics, and provide a wide range of cost-effective storage classes. Amazon S3 provides an optimal foundation for a CSP’s data lake.
AWS Lake Formation is a service providing CSPs with an effective, simple way to secure their data lake. CSPs can use one single data lake for their data, whether it is untransformed network performance data or enriched performance data. CSPs can govern access to the data by allowing read from an operations team to a given table while allowing a development team with the ability to alter it. Data Lakes provide CSPs with the ability to reduce data duplication by governing what can be consumed and how it can be consumed and providing one view point of CSP’s performance (and configuration) data.
Processing and Analysis
AWS Glue Crawler crawls into your data lake to identify the format and create the tables (or updates) in your Data Catalog. It creates the structure that allows you to query your data. For example, if an operator has a new NFx for which ingestion is initiated and data loaded into the Amazon S3 buckets for NFx, CSPs can define the AWS Glue Crawler that will go through the NFx performance data and identify its metadata. Crawlers can identify gNBs’ data such as counters, measurements object, and time, allowing operators to have a representation of easily queryable data. Operators can choose to initiate the performance data model discovery manually or create a schedule to automatically run their defined crawlers. CSPs can have a gNB crawler run every night to capture changes to the performance schema that occurs when an operator introduces a new software release, enables a new service, or a new measurement.
Once the AWS Glue Catalog is built using the AWS Glue Crawler, CSPs have the ability to easily query their data using Amazon Athena. Amazon Athena is a serverless interactive query service that allows you to analyze data in Amazon S3. CSPs can access their network data on the fly and perform complex SQL queries. Amazon Athena makes it easy for anyone with SQL skills to quickly analyze large-scale datasets.
Amazon EMR can be leveraged to process the vast amount of network data. Amazon EMR makes it easy for operator to set up, to operate, and to scale their big data environment by automating time-consuming tasks like provisioning capacity and tuning clusters.
CSPs can also leverage AWS serverless services for this. For example, performance data that follows 3GPP TS 32.43x standard comes in an XML format that is difficult to parse and read. CSPs can leverage AWS Lambda as described in the blog post Build a cloud-native network performance analytics solution on AWS for wireless service providers. CSPs can leverage Amazon Kinesis to ingest real-time data and run an AWS Lambda function to transform the ingested data.
CSPs can leverage Amazon Redshift as a data warehouse solution to create specialized views, procedure, and support their network analytics needs. AWS Glue ETL jobs can be leveraged to create the database schema in Amazon Redshift and copy data from Amazon S3 to Amazon Redshift. Similarly, CSPs can leverage a Zero-Administration Amazon Redshift Database Loader to automatically load data into Amazon Redshift using an AWS Lambda function to copy the data to Amazon Redshift based on the event initiated by the data being ingested. This considerably simplifies the network analytics resource utilization ensuring only required compute resources are used rather than today’s legacy architecture requiring dimensioning for peak data ingestion.
Consumption
Amazon QuickSight provides CSPs with a scalable, serverless, embeddable, and a machine learning-powered business intelligence (BI) service. QuickSight makes it easy for CSPs to build dashboard showing the performance of their network, sharing that information across engineering and leadership groups, and supports quick integration with machine learning-powered insights. QuickSight reads from Amazon Redshift, from Amazon S3 through Athena, and more, making it a great BI tool to correlate data at various stages of a given analysis path.
AWS services integrate easily with existing CSP’s in-house consumption solutions by providing the tools, APIs, and security necessary. For example, CSPs can perform SQL queries toward Amazon Redshift to feed into their legacy reporting systems using the same SQL queries used in their current set of queries.
Network Insights
We simulate data collection from GNBs of Type A (TS 32.432) where a single granularity period of 15 minutes is used. For this blog post, we limit the analysis to RRC Connection where we emulate an RRC attempt with counter “attRRCconnection” and a successful RRC Connection establishment as “succRRCconnection”.
Amazon Athena
In this example, CSPs are interested in “attRRCconnection” and “succRRCconnection” to calculate an RRC Connection Success percentage KPI. Amazon Athena also simplifies the creation of tables and views from a given query.
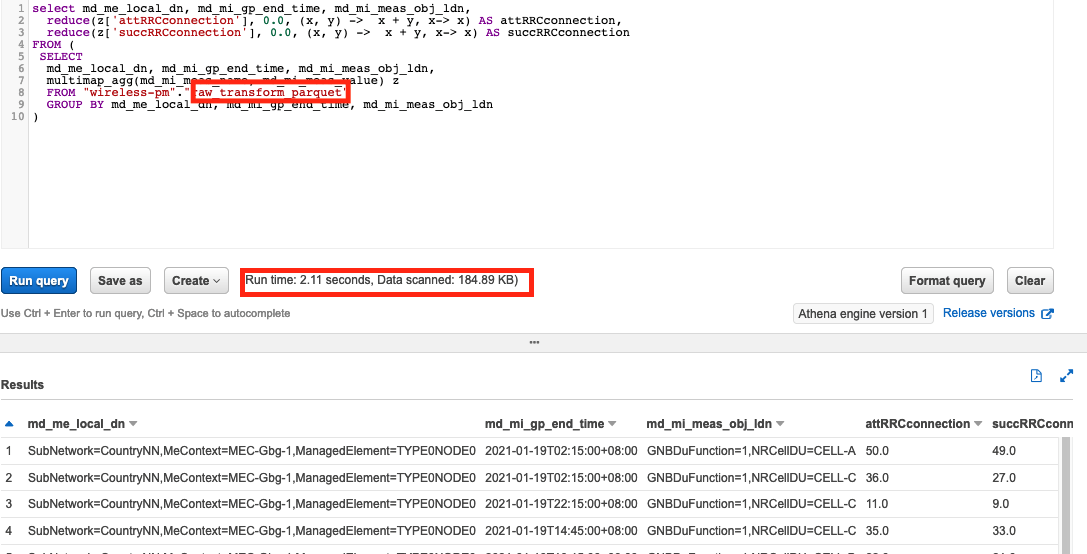 Figure 2: Querying gNB performance data using Amazon Athena.
When running the previous query toward untransformed JSON data, the query runtime is 4.35 seconds. It scanned 8.03MB of data. This is considerably larger, slower, and more expansive than the exact same query ran toward transformed data in Apache Parquet format takes 2.11 seconds and scans 184.89KB. Transforming ingested data into a format facilitating read at scale is recommended, in this case Parquet.
Amazon Redshift
Amazon Redshift can be used to create complex views that transform network data into meaningful network KPIs. This provides CSPs with higher performance for querying their meaningful data. Amazon Redshift also supports scheduling of queries.
 Figure 3: Creating a view using Amazon Redshift query editor.
Currently in preview mode, Amazon Redshift ML provides CSPs to run predictive queries. Amazon Redshift ML leverages Amazon SageMaker, a fully managed machine learning service, using SQL and without CSPs needing to move their data or learn new skills. In this example, CSPs can build a model to predict RRC Percentage using SQL commands. For this example, we simulate a gNodeB that has lower RRC percentage on Mondays where our training data is from February 22-March 7.
Creation of Prediction Model using SQL
The following query demonstrates how ML can be leveraged by creating a prediction model based on the “rrcpercentage” KPI.
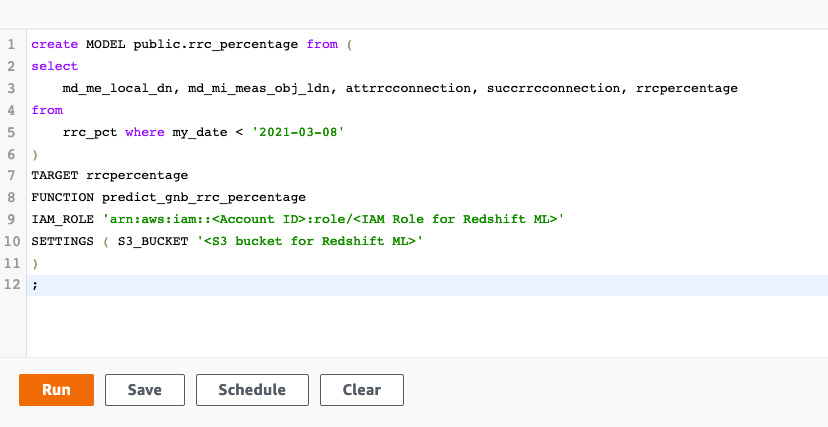 Figure 4: Creating a prediction model leveraging Amazon Redshift ML.
Verify Accuracy of Prediction Model
CSPs engineers can verify the prediction model by running a simple SQL query without prior machine learning experience.
 Figure 5: Verification of prediction model using a simple SQL query.
We can see that the predicted RRC Percentage is aligned with the actual RRC Percentage for our trained data.
 Figure 6: Validation of training model
Prediction
Now that the model is trained, CSPs can run the RRC Percentage training to predict future values. This provides CSPs with the ability to take preventive action to move traffic from one cell to another, fine tunes RF parameters, and more.
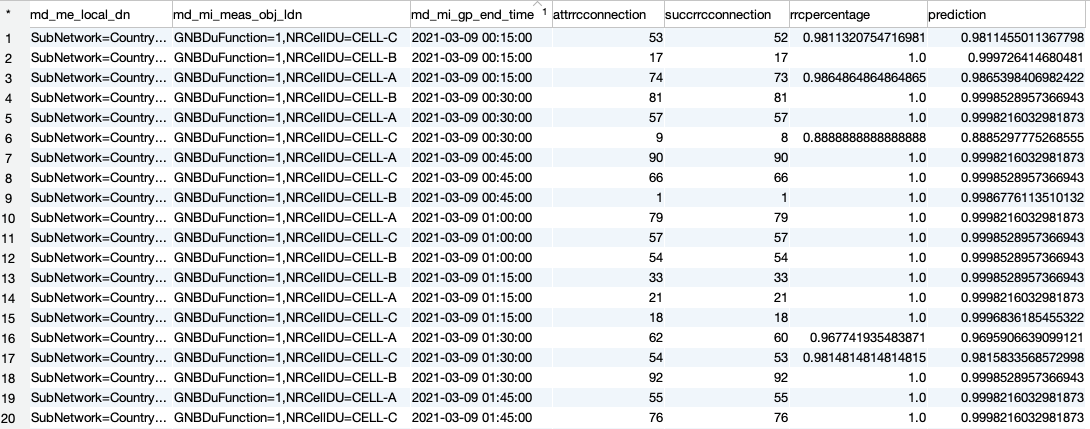 Figure 7: Comparison of prediction versus actual value.
Amazon QuickSight
Engineers can build a variety of graphs, dashboard and insights using Amazon QuickSight. For example, an engineer can be looking at RRC Percentage for a given gNodeB or multiple gNodeBs in a given market to identify anomalies.
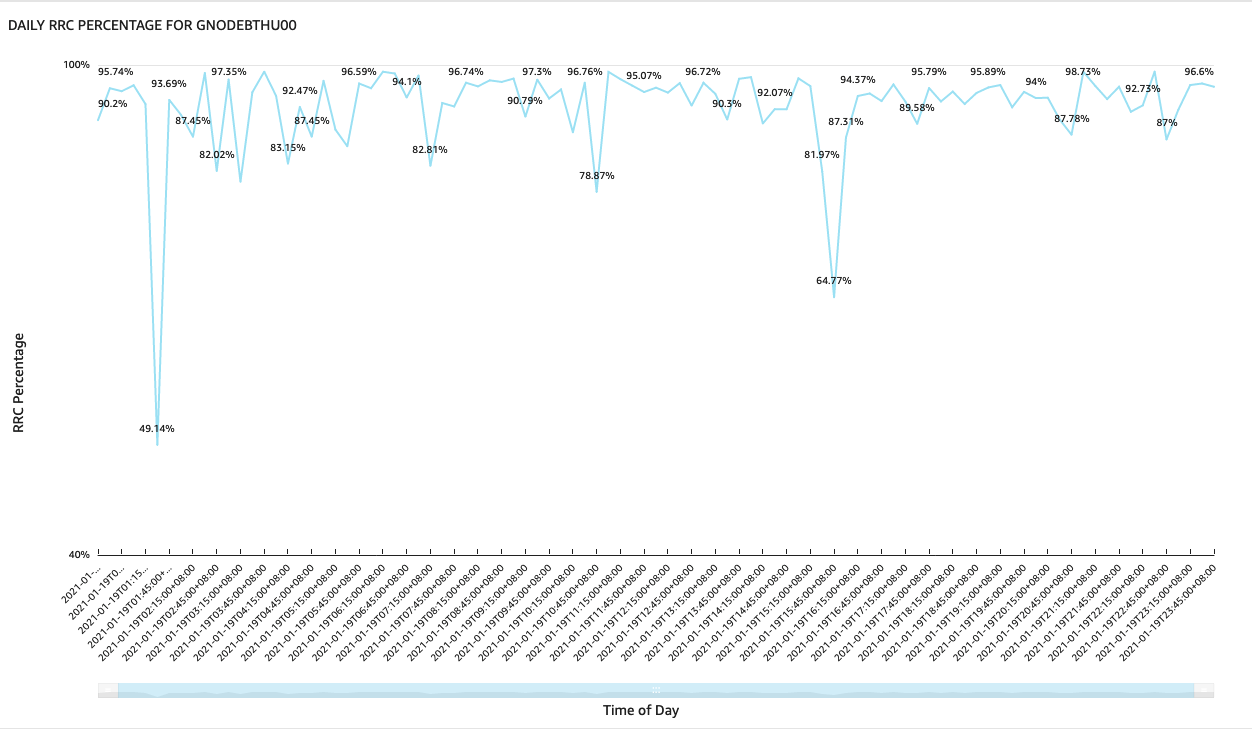 Figure 8: GNB RRC percentage over time.
Engineers can also visualize a KPI in a heatmap format to visually identify when and where a KPI is problematic. Heatmaps provide CSPs with a visual cue of their network performance health.
 Figure 9: Heatmap highlighting GNB cells performance.
CSP engineers can also apply ML insights to their KPIs using Amazon QuickSight ML Insights. The following is an example of identifying anomalies with RRC Percentage showing a drop at 3h45pm where a given gNB had a 60% success rate establishing RRC.
 Figure 10: Identifying anomalies using Amazon QuickSight ML Insights.
Conclusion
AWS services provide CSPs with the ability to build a network analytics solution that meets the needs of their evolving network. Building on AWS enables CSPs to:
- Automatically discover their NFx performance data profiles as they evolve through upgrades and new services introduction
- Identify which NFx negatively impact their network performance
- Ingest a large amount of information in a variable manner
- Simplify navigating through large amount of data
- Support data enrichment and data de-duplication
- Learn from past events and apply machine learning techniques
- Enable 3GPP-Defined 5G Network Data Analytics Function (NWDAF)
- Enable close-loop automation using a panoply of information vectors
To learn more about how telecommunications companies are leveraging AWS Services, visit Telecom on AWS.
Special Acknowledgment
Special acknowledgement goes to Guy Ben Baruch and Naresh Rao.