AWS for M&E Blog
Services and tools for monitoring video workflows on AWS
Congratulations, you’re hosting your video workflows in the cloud. You can now benefit from the redundancy, durability, and integration provided by many AWS cloud services and tools for video workflows. Before you begin basking in the glory, let me ask you: Do you know the end-to-end health of those workflows right now? Are you monitoring and measuring the right metrics to tell you everything is working normally and that your users can watch video? Are you notified if one of your redundancy mechanisms is activated?
This blog post is the first of two detailing tools and techniques for monitoring cloud-based video workflows running on AWS. Start with this post to get a broad introduction of the resources available to you to plan for your monitoring solution. Continue learning with the next installment: Monitoring AWS Media Services Using Amazon CloudWatch Events
Amazon CloudWatch
Amazon CloudWatch makes up the foundation for monitoring both services and custom applications in the AWS Cloud. CloudWatch aggregates monitoring and operational data in the form of logs, metrics, and events. It has the capability to apply filters and queries to historic log data to extract and process numeric or textual information. You can take advantage of dashboards within the service, or you can create integrations with other visualization tools for an end-to-end view of the health of AWS resources running in the cloud and in hybrid environments. The following image is a custom dashboard created in CloudWatch using service-supplied metrics.

You have several options available to send log and metric data to CloudWatch if you are developing a custom application. Your application can subscribe to and be notified when events of interest occur, such as a change in the operational state of an AWS Media Services resource. Most media services from AWS send some type of operational data to CloudWatch. AWS Elemental MediaLive, AWS Elemental MediaPackage, AWS Elemental MediaConnect, AWS Elemental MediaStore, and other services integrate with Amazon CloudWatch through metrics and events. Each service offered by AWS has a different level of CloudWatch integration and support depending on its purpose.
Logs, Metric Filters, and Insights
Amazon CloudWatch Logs provides collection and aggregation of structured and unstructured data sent from your applications. Lambda functions and ECS containers send data to CloudWatch Logs automatically. Applications running on EC2 instances and those running with on-premise hardware can send data to CloudWatch Logs using an SDK or agent depending on the situation.
Logs Streams can be searched by keywords, parsed for numeric or text values, and metric filters can be created to count the number of times a specific pattern or keyword is encountered, such as the word EXCEPTION or ERROR. You can create an alarm from a metric filter to notify you when a threshold count is met or exceeded.
CloudWatch Logs Insights provides a query language for interactive analysis of your log data. You can embed query results and visualizations from Insights into CloudWatch Dashboards that are refreshed automatically.
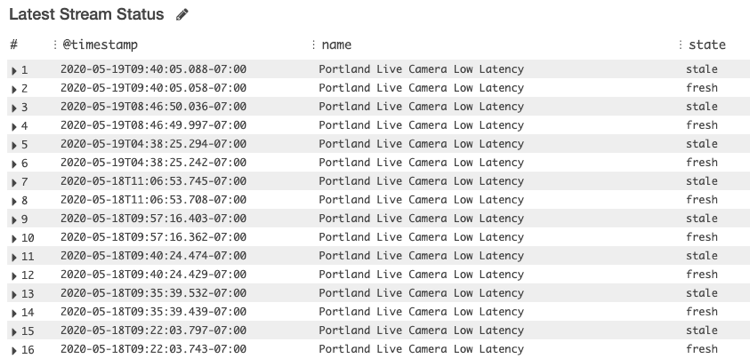
The following image is taken from an Insight query against CloudWatch Logs. Each log entry contains a single JSON object sent from a custom application. The attributes called ‘name’ and ‘state’ were extracted from each log entry using Insights with the timestamp and shown within a compartment in the dashboard.
Metrics and Alarms
CloudWatch metrics and alarms are used to count things and indicate when a threshold of a metric value has been breached. The threshold can be above or below a target value. Many video services, including MediaLive and MediaPackage, automatically send metrics to CloudWatch as they process and deliver video data. The media services you use may record metrics such as incoming and outgoing data rates and time and effort spent on encoding or recovering from problems. Metrics can be visualized into graphs using different calculations and embedded into dashboards for monitoring.
CloudWatch alarms are created from metrics. You can configure alarms for a fixed threshold, such as when a data rate falls below 100 kbps longer than 30 seconds, or for an adaptive threshold that observes the metric value over time and automatically creates a threshold band with high and low values based on data.
When an alarm threshold has been breached, it will change to an ALARM state. When the alarm metric is within the threshold, it will indicate an OK state. Alarm state can be queried, and state changes can take advantage of notification services like Amazon Simple Notification Service (SNS) and CloudWatch Events for fast, customized responses.
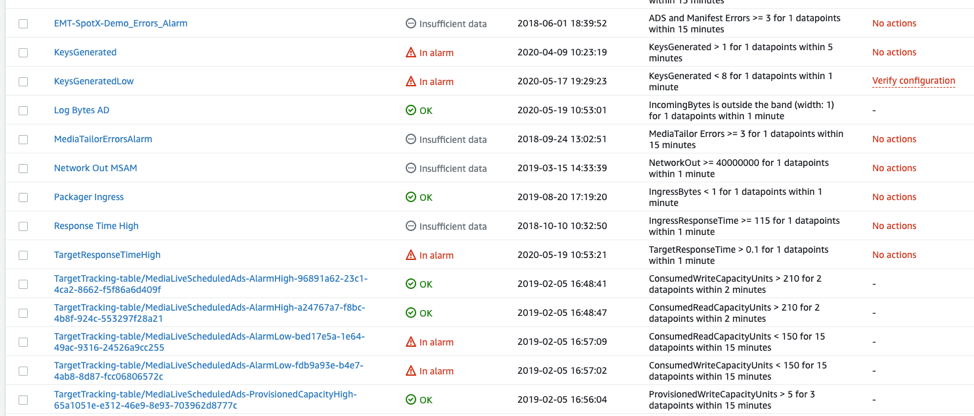
The following image is taken from the CloudWatch Alarms console showing custom alarms, states, and threshold specifications for the metric assigned to the alarm.
CloudWatch Events
CloudWatch events are typically used to signal significant occurrences from cloud services to applications using a publish/subscribe pattern. You can subscribe your application (AWS Lambda, Amazon Simple Queue Service (SQS) queue, etc.) to an event pattern and receive asynchronous notifications when the video channel starts and stops, connectivity is lost, or the input source is switched. These events are published to CloudWatch by an AWS cloud service, such as MediaPackage, and distributed to subscribers through CloudWatch in near real time.
AWS Media Services and Amazon CloudWatch
Video Workflows and CloudWatch Metrics
Most AWS Media Services publish metrics to CloudWatch. A list of available metrics is located in the CloudWatch console under Metrics in the left-side navigator. Look for the service name in the listing, and navigate through the different dimensions until the you find a metric matching the level of detail you need.
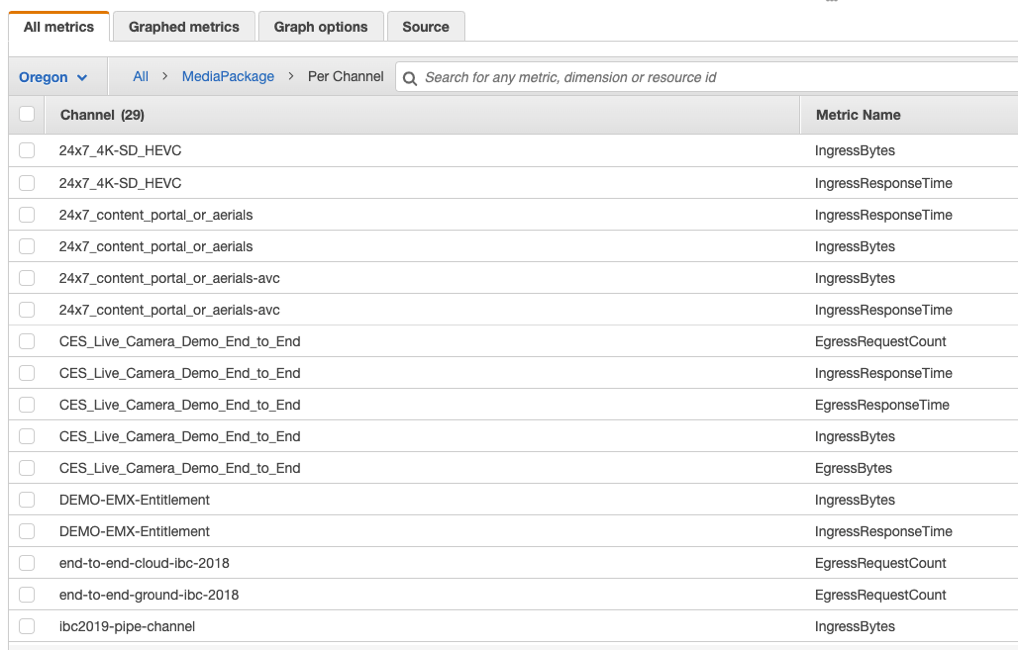
Metrics may be summarized in several ways when they are published by a service. Often you will find metrics named “All …” that apply to all data in the current region or in your AWS account. These types of metrics can provide a broad understanding of how the entire service is operating. The following image shows the categories of metrics published by MediaPackage.
Video Workflows and CloudWatch Events
Each media service that can publish events uses a unique source name as part of the subscription filter and follows a naming convention, such as aws.medialive and aws.mediapackage. You can also specify several criteria in your subscription filter to receive specific events or only events with certain details.
CloudWatch Events and Media Services Alerts, what’s the difference?
CloudWatch Events notify subscribers of a one-time occurrence within the service you are monitoring. Resources like MediaLive Channels and Multiplexes and MediaConnect Flows have the concept of an alert. Alerts track a single instance of a problem or occurrence with the state. CloudWatch Events serve as the communication mechanism for alerts.
You receive an alert from a service just as you would any other CloudWatch Event, but the data included with the event is what makes it a Media Alert. The alert will include a state, such as “set” or “cleared” that indicates whether the alert is still in effect, as well as a human-readable name or description. The alert will include a persistent unique ID, which you can store and track when the alert changes state. Future notifications for an in-progress alert will include the same ID so your code can look up the alert in your application’s storage and act on it.
Alerts are important for video workflows because you can track the beginning and end of a problem. Notifications for alerts can be pushed to subscribers within the AWS Cloud to allow them to act quickly and in a distributed approach if needed.
The following image is a portion of a CloudWatch Event with Media Service Alert data. Notice the alarm_id and alarm_state attributes and the information describing the source of the alert.

This post gave a broad introduction to the AWS tools available for monitoring cloud-based video workflows. Review the follow resources to read more about the tools and services mentioned here. Continue learning with the next installment: Monitoring AWS Media Services Using Amazon CloudWatch Events