Microsoft Workloads on AWS
Comparing performance of new releases of Babelfish and comparing Babelfish performance with SQL Server
In this blog post, I will compare the performance of the newest releases of Babelfish for Aurora PostgreSQL and provide performance and price-performance comparisons between Babelfish and Microsoft SQL Server 2022.
1. Introduction
Babelfish for Aurora PostgreSQL is a capability of Amazon Aurora PostgreSQL-Compatible Edition that enables Aurora to understand commands from applications written for Microsoft SQL Server. By allowing Aurora PostgreSQL to understand Microsoft T-SQL and communicate over SQL Server’s proprietary Tabular Data Stream protocol, Babelfish allows customers to speed up their migrations from SQL Server to open-source database platforms while also lowering migration risks. With minimal to no changes, customers can run applications developed for SQL Server against the Babelfish database migrated from SQL Server.
This year, we introduced several new releases of Babelfish tightly coupled with the new releases of Amazon Aurora PostgreSQL. By using Aurora for PostgreSQL, Babelfish benefits from advanced Aurora storage and reliability features. The two recent releases of Babelfish are Babelfish for Aurora PostgreSQL 3.1 and 3.2 based on Aurora for PostgreSQL releases 15.2 and 15.3, respectively. Each release adds new features, performance improvements, and stability enhancements. A notable feature of these releases is Amazon Aurora I/O-Optimized, a new configuration that provides improved price performance and predictable pricing for customers with I/O-intensive applications.
Babelfish continues to mature and provide additional features and capabilities, and as a result, is increasing the number of compatible SQL Server workloads on Babelfish. More and more AWS customers are planning to or are migrating their SQL Server workloads to Babelfish. To lower the migration risk, the Babelfish Compass tool, available in the babelfish_compass GitHub repository, is being updated with every new release of Babelfish. This tool helps assess the compatibility of your databases with Babelfish and identifies the effect of Babelfish functional improvements on your migration path.
Besides new features and capabilities, existing Babelfish customers are interested in understanding what kind of performance gains might be seen by upgrading to the latest version of Babelfish. Similarly, customers planning on migrating their SQL Server workloads to Babelfish want to know what their performance on SQL Server vs. Babelfish will be. To answer these questions, I ran a series of Babelfish performance tests following the setup outlined in the blog post, Setting up Babelfish for Aurora PostgreSQL for performance testing using HammerDB.
2. Babelfish benchmarking scenarios
In this section, I will review database setup for testing, reasons for selecting specific instance types to deploy SQL Server and Babelfish clusters, and guidance on selecting workload levels. I will also address the selection of performance metrics for comparison and how I identified performance levels for each test configuration.
2.1. Setting up databases for benchmarking
I will use HammerDB 4.4 OLTP workload for both the Babelfish version comparison and Babelfish vs. SQL Server comparison benchmarking, as OLTP workloads are prevalent in SQL Server migrations to AWS. For the OLTP workload tests, I generated a HammerDB database with 10,000 warehouses as outlined in the blog post Benchmarking Transaction Databases. At 100 MB database size per each warehouse, this resulted in a test database of 1TB. This is a slightly larger database than the 8,000 warehouses database I used in the blog post, Babelfish for Aurora PostgreSQL Performance Testing Results, but the results should still be comparable.
2.2. Selecting instance types for testing
From my previous blog post, typical mid-range Babelfish clusters are built using memory-optimized db.r6g and db.r6i Amazon EC2 instances. This provides the best price-performance characteristics. To compare the performance of the new releases of Babelfish, I will run a series of tests using Babelfish clusters based upon these instance families in various configurations.
As SQL Server does not support AWS Graviton-2 processors, to generate SQL Server performance data, I will use SQL Server deployments on Amazon EC2 r6i instances of various sizes comparable to the sizes of the instances used for Babelfish.
2.3. Selecting the number of virtual users for benchmarking
HammerDB virtual users are simulated users that stress test a database. To estimate the maximum performance of a system, it’s good practice to start with a few virtual users and gradually increase the number until the database reaches its maximum performance level. When we increase the number of virtual users, representing the load on the system, the performance metric will grow until it reaches a saturation point, in which growth stops or even declines.
As the database gets closer to the saturation point, the increase in the number of virtual users results in smaller increases of SQL Server performance. Thus, for HammerDB benchmarking series of tests, I set the number of virtual users increasing in a geometric progression. I used the set of 256, 362, 512, and 724 virtual users for smaller instances, expanding it to 256, 362, 512, 724, and 1024 virtual users for larger instances.
Typically, 4 to 5 warehouses per virtual user would be a minimum value to ensure an even distribution of virtual users across provisioned warehouses. Considering that the smallest database in the test set contains 10,000 warehouses, it is safe to set the maximum number of virtual users to 1024.
2.4. Selecting a performance metric
HammerDB reports two performance metrics : Transactions per Minute (TPM) and New Orders per Minute (NOPM). TPM is a legacy metric and depends on how the database system reports transactions. NOPM is a newer metric. HammerDB calculates NOPM based upon the count of records in the new_order table before and after the test run, so NOPM does not depend on how the database system reports transactions. This allows the NOPM metric to be used for the cross-platform comparison while TPM makes sense only for comparing performance within the same platform.
Besides comparing the performance of various releases of Babelfish, I also want to establish performance comparisons between SQL Server and Babelfish. I selected NOPM as a metric to use for performance comparison for the test runs.
2.5. Identifying performance for each test configuration
To get statistically stable results, for each Aurora cluster configuration and SQL Server deployment (see Section 2.2), I ran a series of performance tests at varying levels of workload with the number of virtual users defined in Section 2.3. I repeated each test 3 times and averaged results for the same level of workload.
For each tested configuration, I defined the performance as the maximum performance level reached for each respective scenario. For example, Figure 1 displays results for Babelfish performance testing on an Aurora cluster configured with a db.r6i.8xlarge instance. Each point on this chart is the average of 3 test runs.

Figure 1. Babelfish on r6g.8xlarge performance test results for 10,000 warehouses HammerDB database.
In this scenario, Babelfish reached the best performance at the load level of 512 virtual users for the HammerDB database of 10,000 warehouses. So, I accept the values of NOPM for 512 virtual users as Babelfish performance for this cluster. When using more powerful instances for the cluster, Babelfish and SQL Server may reach maximum performance at the load level corresponding to a higher number of virtual users.
3. Comparing performance of Babelfish versions 3.1 and 3.2 (and 2.4)
Tests were performed using instances of various sizes and processor architectures and the results are grouped by instance size.
3.1. 8xlarge instances
Within this category, I will focus on comparisons between instances in the 8xlarge category grouped by processor architecture. Results of performance testing for this group are shown in Table 1.

Table 1. Performance test results for 8xlarge instances
Based on the data in Table 1, for selected instances, Babelfish 3.2 offers approximately a 3% performance advantage over the previous release.
3.2. 12xlarge instances
Within this category, I will focus on comparison between instances in the 12xlarge category grouped by the processor family. For this set of tests, I can augment the current test results with the results from my blog post, Babelfish for Aurora PostgreSQL Performance Testing Results. I am unable to directly compare performance data because in that blog post I used an 8,000-warehouse HammerDB database, while my current performance data was collected using a 10,000-warehouse database. Using the “Performance versus database size” chart presented in Figure 4 of the original post, it is easy to calculate adjustment coefficients to estimate the results for a 10,000-warehouse database using the original performance data obtained for the 8,000-warehouse database. Calculated adjustment coefficients are in the range of 98 to 99 percent.
Now we can compare the performance results obtained for Babelfish versions 3.1 and 3.2 with the earlier results for Babelfish 2.4. Table 2 captures my current test results together with adjusted results for Babelfish 2.4 from the previous blog post:

Table 2. Performance test results for 12xlarge instances
As shown in Table 2, each subsequent Babelfish release demonstrates better performance. It also appears that Babelfish performance gains are more substantial for Babelfish clusters based on the Graviton-2 processors.
3.3. 16xlarge instances
This group represents test results obtained for Babelfish clusters based upon 16xlarge instances. For Babelfish 2.4, I used adjusted performance data from my previous blog post. Table 3 captures performance test results for this group:

Table 3. Performance test results for 16xlarge instances
As shown in Table 3, newer Babelfish releases provide meaningful performance increases as compared with the older ones.
3.4. Babelfish 3.2 performance and price-performance analysis
Based on the testing, we have established that the best performing release of Babelfish is the 3.2 release. Now let’s focus on comparing performance of the clusters based upon Graviton-2 (R6g) and Intel (R6i) instances. Corresponding performance data is captured in Table 4:

Table 4. Performance comparison – Intel-based versus Graviton-2 instances.
From the performance comparison, Babelfish clusters using Intel-based instances outperform comparatively-sized clusters using instances based on Graviton-2 by 3.5% to 8.5%.
Now let’s see how the difference in performance between the Babelfish clusters of different sizes and underlying Amazon EC2 instances translate into cost per 1,000 NOPM. All Babelfish clusters that were used for performance testing were built using Aurora I/O-Optimized that provides improved price-performance and predictable pricing for customers with I/O-intensive applications.
As all the test databases are approximately 1 TB in size, I used the Aurora I/O-Optimized pricing model with 1.3 TB of storage to get the cost estimates. These estimates are for the us-east-1 Amazon region and are correct at the time of publication. Price-performance data for Babelfish 3.2 clusters used in this testing are presented in Table 5:

Table 5. Babelfish 3.2 price-performance analysis.
It is interesting to note that despite the significant difference in performance, Aurora I/O-Optimized Babelfish clusters offer stable cost per 1,000 NOPM within the same computer architecture. Intel-based clusters offer better Babelfish performance, but with a higher cost per 1,000 NOPM.
4. Comparing SQL Server performance with Babelfish 3.2
Amazon EC2 provides a wide selection of instance types optimized to fit different use cases. Instance types comprise varying combinations of CPU, memory, storage, and networking capacity and give you the flexibility to choose the appropriate mix of resources for your applications. Each instance type includes one or more instance sizes, allowing you to scale your resources to the requirements of your target workload. It is impractical to implement SQL Server performance testing across all possible configurations.
For this analysis, I selected the newer generation R6i of Amazon EC2 instances that are specifically recommended for SQL workloads. The R6i family of Amazon EC2 instances offer multiple sizes, so for my analysis, I selected the popular mid-range SQL Server deployment options of R6i.8xlarge and R6i.12xlarge instances.
4.1. Comparing SQL Server deployed on R6i.8xlarge with Babelfish 3.2
R6i.8xlarge instances offer 32 vCPUs and 256 GB of RAM and can support up to 40,000 IOPS. To fully utilize the capabilities of this instance, I deployed SQL Server 2022 Enterprise Edition on Windows Server 2022. I provisioned this instance with a 1.3 TB IO2 Block Express Amazon EBS volume configured for 40,000 IOPS to match the R6i.8xlarge instance IOPS limit.
The HammerDB test database and SQL Server were configured following the HammerDB Best Practice for SQL Server Performance and Scalability document for HammerDB benchmarking. Using this configuration, I ran HammerDB performance tests using the same 10,000-warehouse database to make a valid comparison. Table 6 captures results of these tests together with performance results for Babelfish 3.2 on comparable hardware from Table 1:

Table 6. NOPM Performance metrics for SQL Server and Babelfish 3.2 for 8xlarge instances.
The chart in Figure 2 represents the data from Table 6 in graphical form. From these tests, Babelfish 3.2 provides better performance than SQL Server.

Figure 2. NOPM Performance metrics for SQL Server and Babelfish 3.2 for 8xlarge instances.
With the established performance characteristics, let’s look at the cost of respective solutions. To estimate the cost of the SQL Server deployment, I used the AWS Pricing Calculator. I used the option for an on-demand deployment with no upfront payment – the same assumptions that I used for estimating cost for Babelfish clusters. Cost estimates for respective configurations together with the performance data is captured in Table 7:

Table 7. Cost and price-performance summary
Babelfish not only offers lower cost per 1,000 NOPM, but also comes with up to a 70% lower overall deployment cost.
4.2. Comparing SQL Server deployed on R6i.12xlarge with Babelfish 3.2
The next step was to run performance tests for SQL Server deployed on a R6i.12xlarge instance. This instance offers 48 vCPUs and 384 GB of RAM, and supports 60,000 IOPS when communicating with Amazon EBS storage volumes. It is a 50% increase on every functional parameter as compared with R6i.8xlarge instance used in the previous set of tests. Thus, it is not surprising that SQL Server demonstrates twice the level of performance that was achieved on R6i.8xlarge. Results for the relevant test runs are presented in Table 8 and as a chart in Figure 3:

Table 8. NOPM Performance metrics for SQL Server 12xlarge and Babelfish 3.2 on comparable instances.
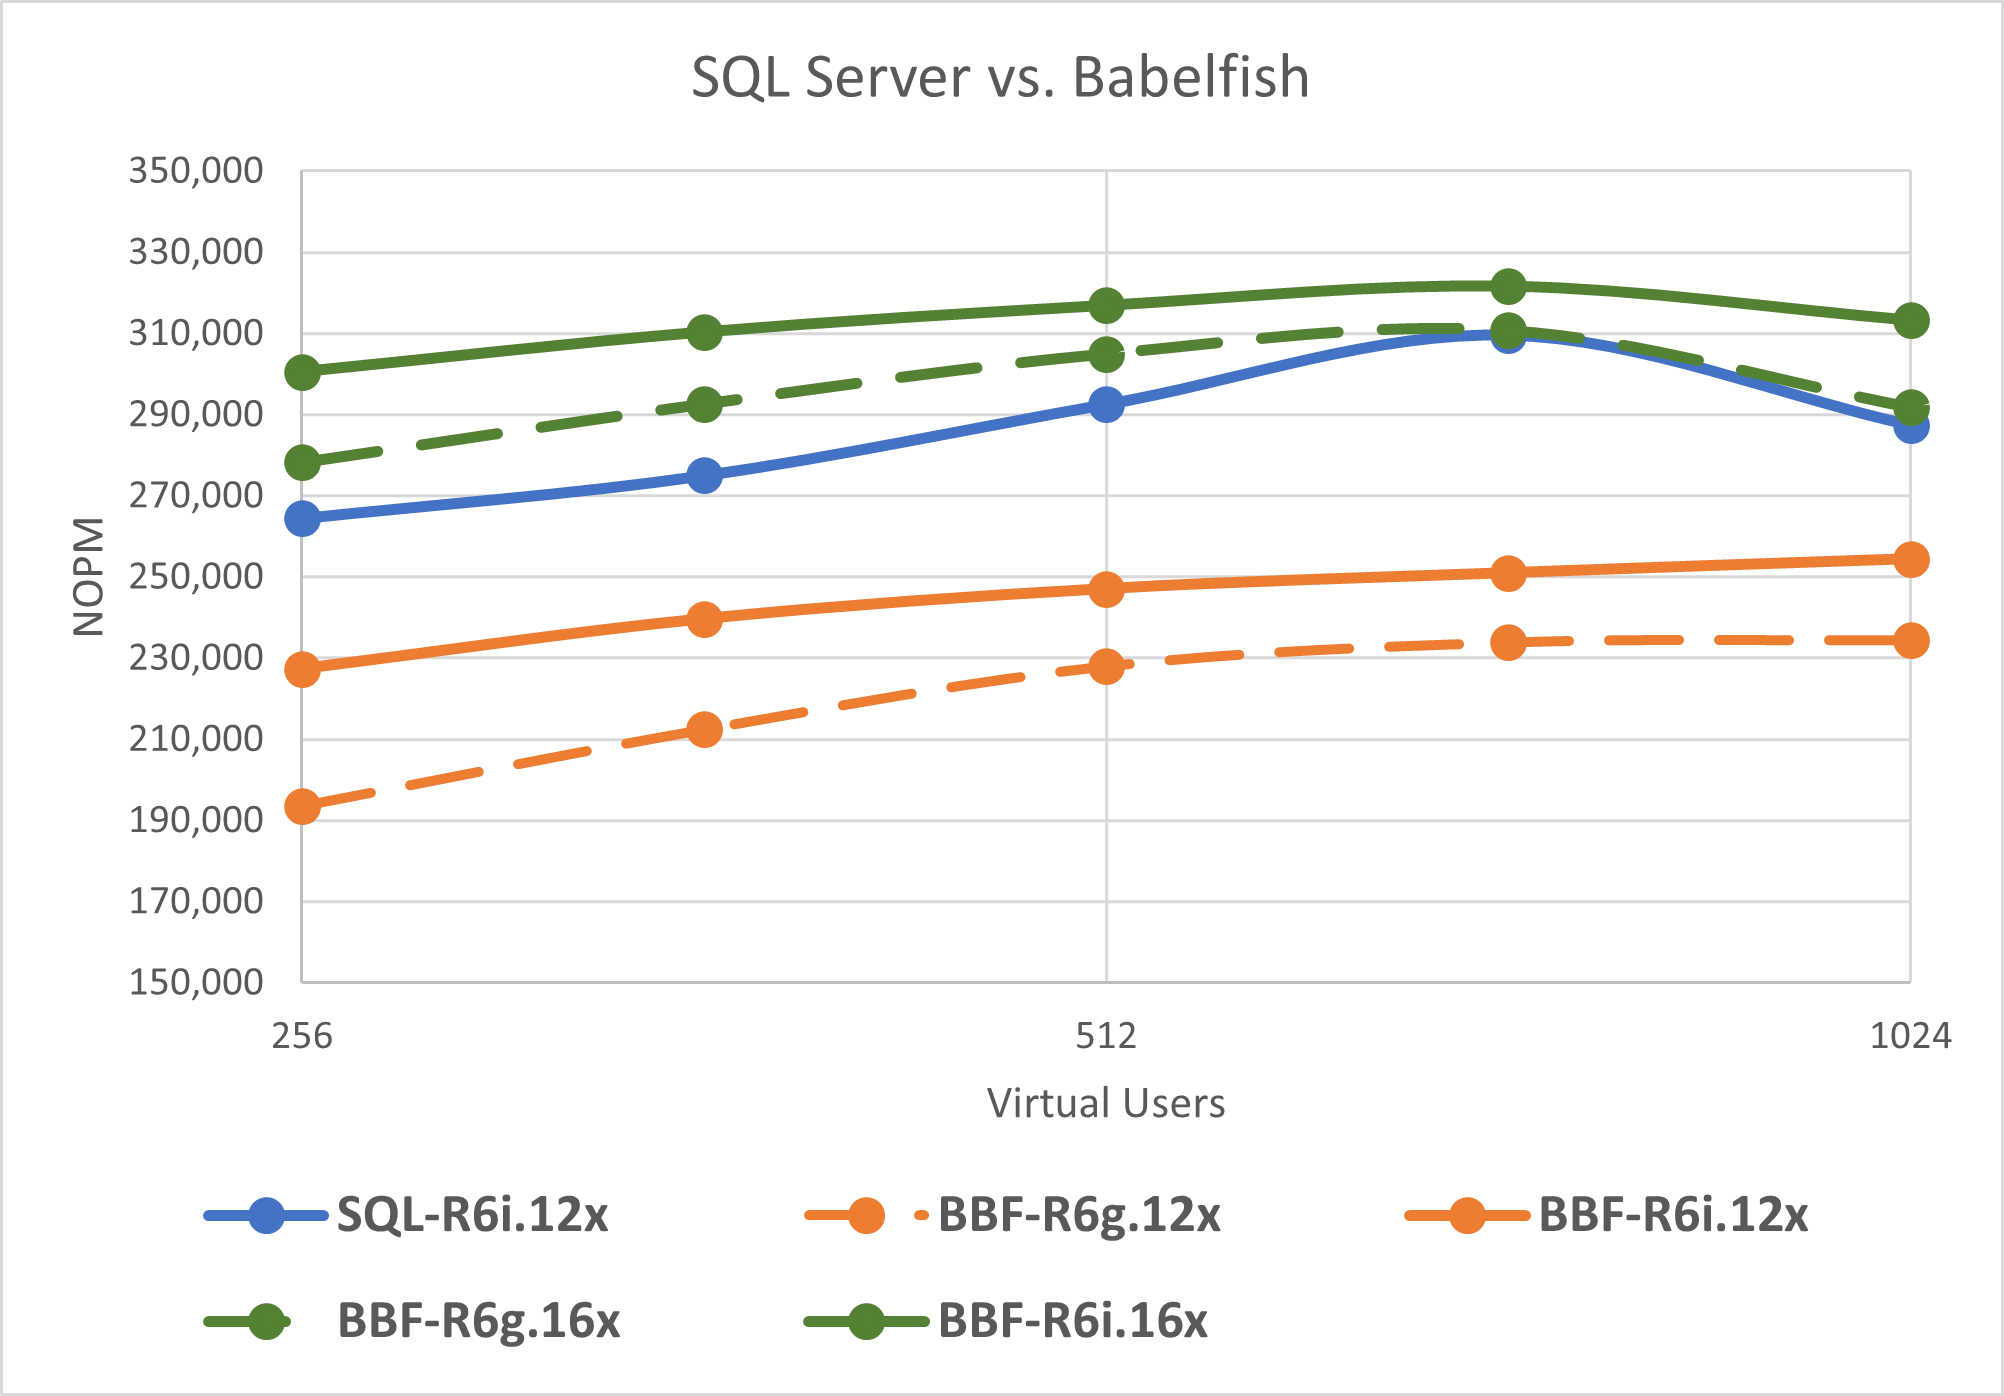
Figure 3. NOPM Performance metrics for SQL Server 12xlarge and Babelfish 3.2 on comparable instances.
Babelfish clusters deployed on R6g.12xlarge and R6i.12xlarge instances demonstrated good performance levels, but were not able to match the performance levels offered by SQL Server. Babelfish clusters deployed on a one step larger instance were able to demonstrate the same or higher performance levels.
In terms of the overall cost and price-performance for these configurations, the relevant data is presented in Table 9:

Table 9. Cost and price-performance summary
Even upgrading the Babelfish cluster to a larger instance size to match or exceed SQL Server performance, the Babelfish deployment shows up to a 60% lower overall cost and better price-performance numbers.
Conclusion
Based upon the results presented in this blog post, we can derive the following two conclusions:
1. Babelfish version 3.2 offers better performance than previous releases of Babelfish. Thus, if you are currently running database workloads on earlier releases of Babelfish, it makes sense to upgrade your deployment, especially considering that upgrading your Babelfish cluster is a rather simple operation. If you are planning a new Babelfish deployment on AWS or the migration of a SQL Server workload to Babelfish, always consider the latest Babelfish release. It will offer more features, better compatibility with SQL Server, and higher performance.
2. If your SQL Server workload is compatible with or can be made compatible with Babelfish, migration to Babelfish will offer you the same or better performance at a significantly lower cost and free you from licensing requirements.
If you decide that Babelfish addresses your functional and performance requirements and would like to migrate your SQL Server workload to Babelfish, please read our Migrating a SQL Server database to Babelfish for Aurora PostgreSQL documentation and Migrate from SQL Server to Amazon Aurora using Babelfish blog post.
AWS has significantly more services, and more features within those services, than any other cloud provider, making it faster, easier, and more cost effective to move your existing applications to the cloud and build nearly anything you can imagine. Give your Microsoft applications the infrastructure they need to drive the business outcomes you want. Visit our .NET on AWS and AWS Database blogs for additional guidance and options for your Microsoft workloads. Contact us to start your migration and modernization journey today.