AWS Cloud Operations Blog
Visualize and gain insights into your AWS cost and usage with Amazon Managed Grafana
As you migrate workloads to AWS and increase consumption of AWS services, it becomes critical to have a comprehensive view of the value of AWS, as well as to track and effectively manage your AWS cost and usage. AWS offer multiple native services such as AWS Cost Explorer, AWS Budgets, and AWS Cost Anomaly Detection to allow customers visualize and guardrail their spend while the AWS Cost and Usage Report (CUR) report may be used to deep dive cost and usage data down to the individual AWS resources.
Amazon Managed Grafana is a fully managed, scalable, secure and highly available data visualization service that enables customers to instantly query, correlate, and visualize operational metrics, logs, and traces for their applications from multiple data sources. Amazon Managed Grafana is open source Grafana compatible and integrated with AWS data sources that collect operational data, such as Amazon CloudWatch, Amazon OpenSearch Service, Amazon Athena and Amazon Managed Service for Prometheus (AMP). Furthermore, it provides plug-ins to popular open-source databases, third-party ISV monitoring tools, as well as other cloud services. With Amazon Managed Grafana you can easily visualize information from multiple AWS services, AWS accounts, and Regions in a single Grafana dashboard.
Athena is an interactive query service that makes it easy to analyze data using standard SQL. Athena is serverless, so no infrastructure to manage, and you pay only for the queries that you run.
In this blog post, we demonstrate how you can visualize and analyze your AWS Cost and Usage data with Amazon Managed Grafana while using the Amazon Athena plugin.
Solution overview
The following diagram shows the complete setup that we will explain in this post
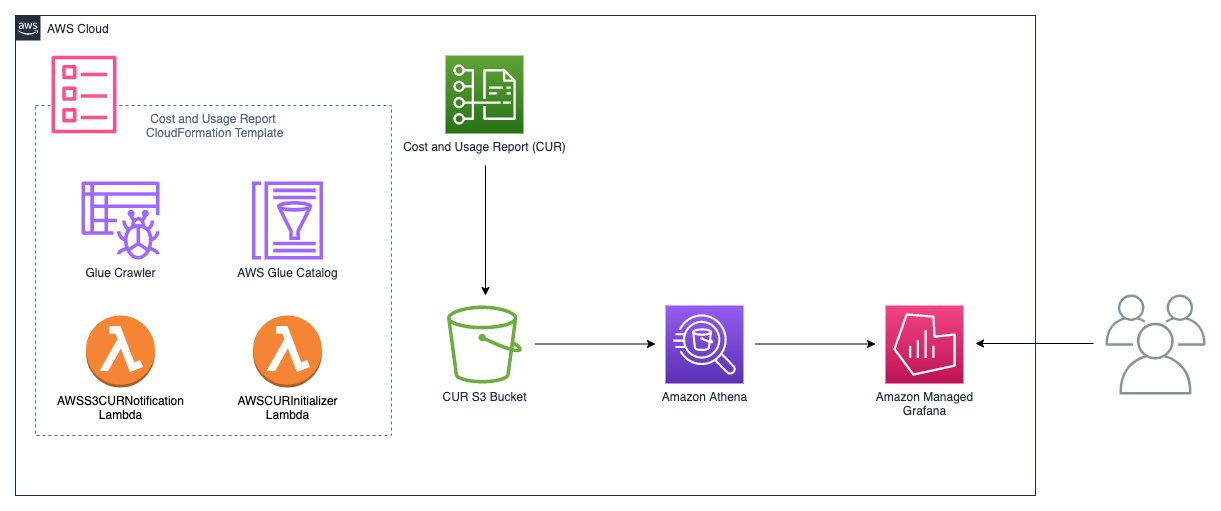
Figure 1. The overall architecture highlights integration of Cost and Usage Report (CUR) with Amazon S3, Amazon Athena and Amazon Managed Grafana to visualize and analyze the cost and usage data for your AWS resources.
On a high level, we will first create AWS Cost and Usage Report (CUR) report using CloudFormation Template and store that in S3 bucket. Then, we will analyze and query the CUR report using Athena. Lastly, we will visualize the cost and usage data from CUR report in Amazon Managed Grafana using Athena plugin.
Step 1: Setup and create Cost and Usage Report
This solution leverages the billing data found in the AWS Cost and Usage Report (CUR). AWS CUR breaks down cost and usage on a granular level down to the hour or resource ARN and contains the most comprehensive set of cost and usage data available.
To create a CUR Report, follow detailed instructions at Creating Cost and Usage Reports. Consider the following options when creating the CUR:
- Configure a new Amazon S3 bucket to store the AWS CUR. Let’s say
demo-cur-report-XXX - Select “Include resource IDs”. Many billing records will automatically include the Resource ID, which can be useful context when trying to understand a segment of your bill.
- Select “Automatically refresh your Cost & Usage Report when charges are detected for previous months with closed bills”. This lets you have the most accurate representation, as some refunds, credits, and AWS Support fees are calculated after the month is closed.
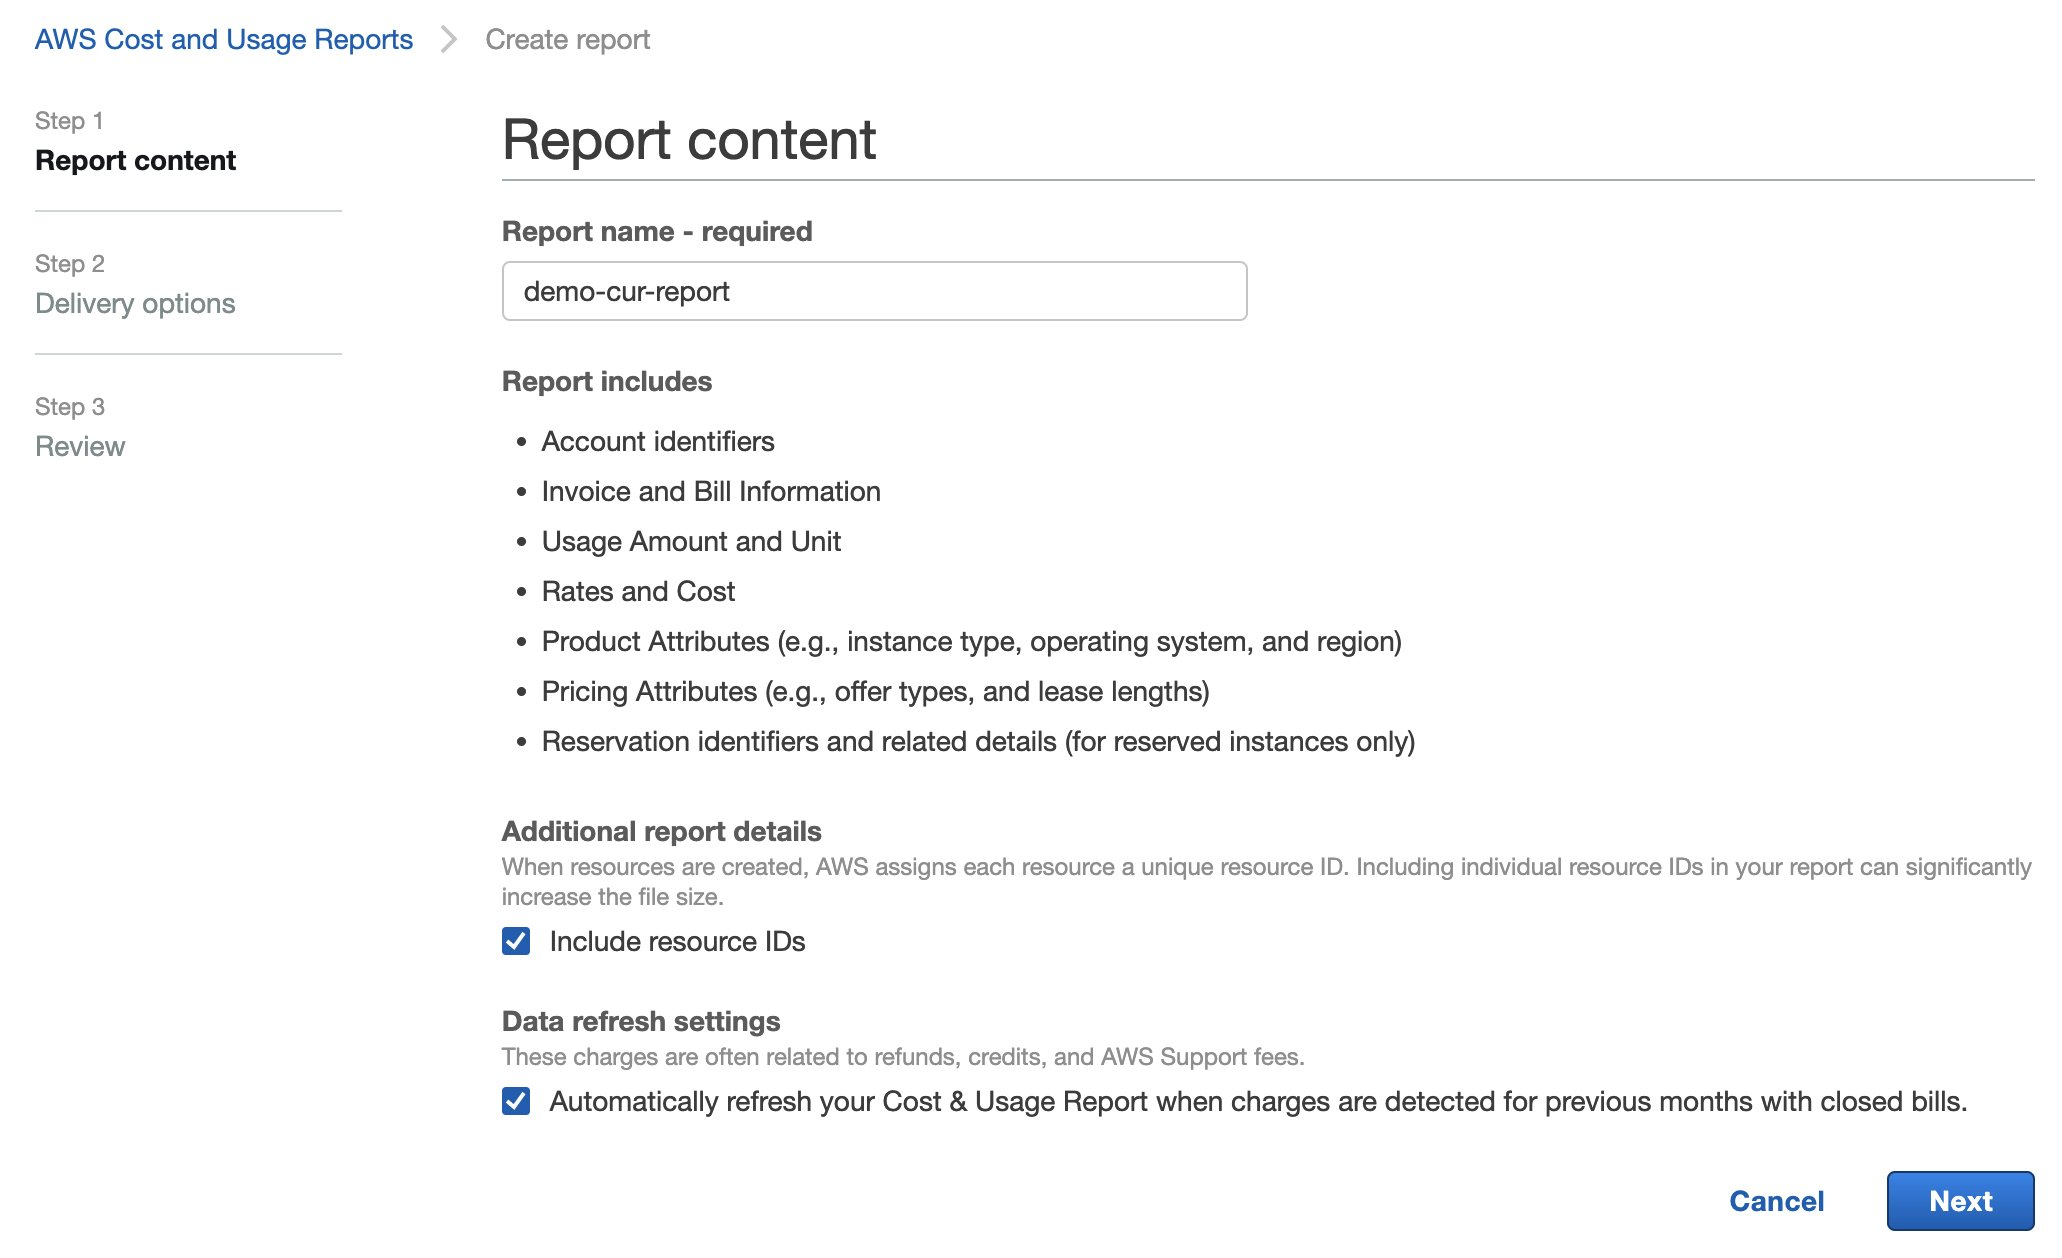
Figure 2. Create AWS Cost and Usage Report
- Select “Overwrite existing report” for Report versioning. The entire month of data is written multiple times per day as the CUR is delivered. Overwriting lets you only have the latest copy of the current month, and avoid storing duplicate data.
- Select “Hourly” to receive the highest available granularity.
- Select “Amazon Athena” for Enable report data integration for. This will automatically select the (Apache) Parquet compression type, which is required for Athena to run efficient queries for the Grafana dashboards
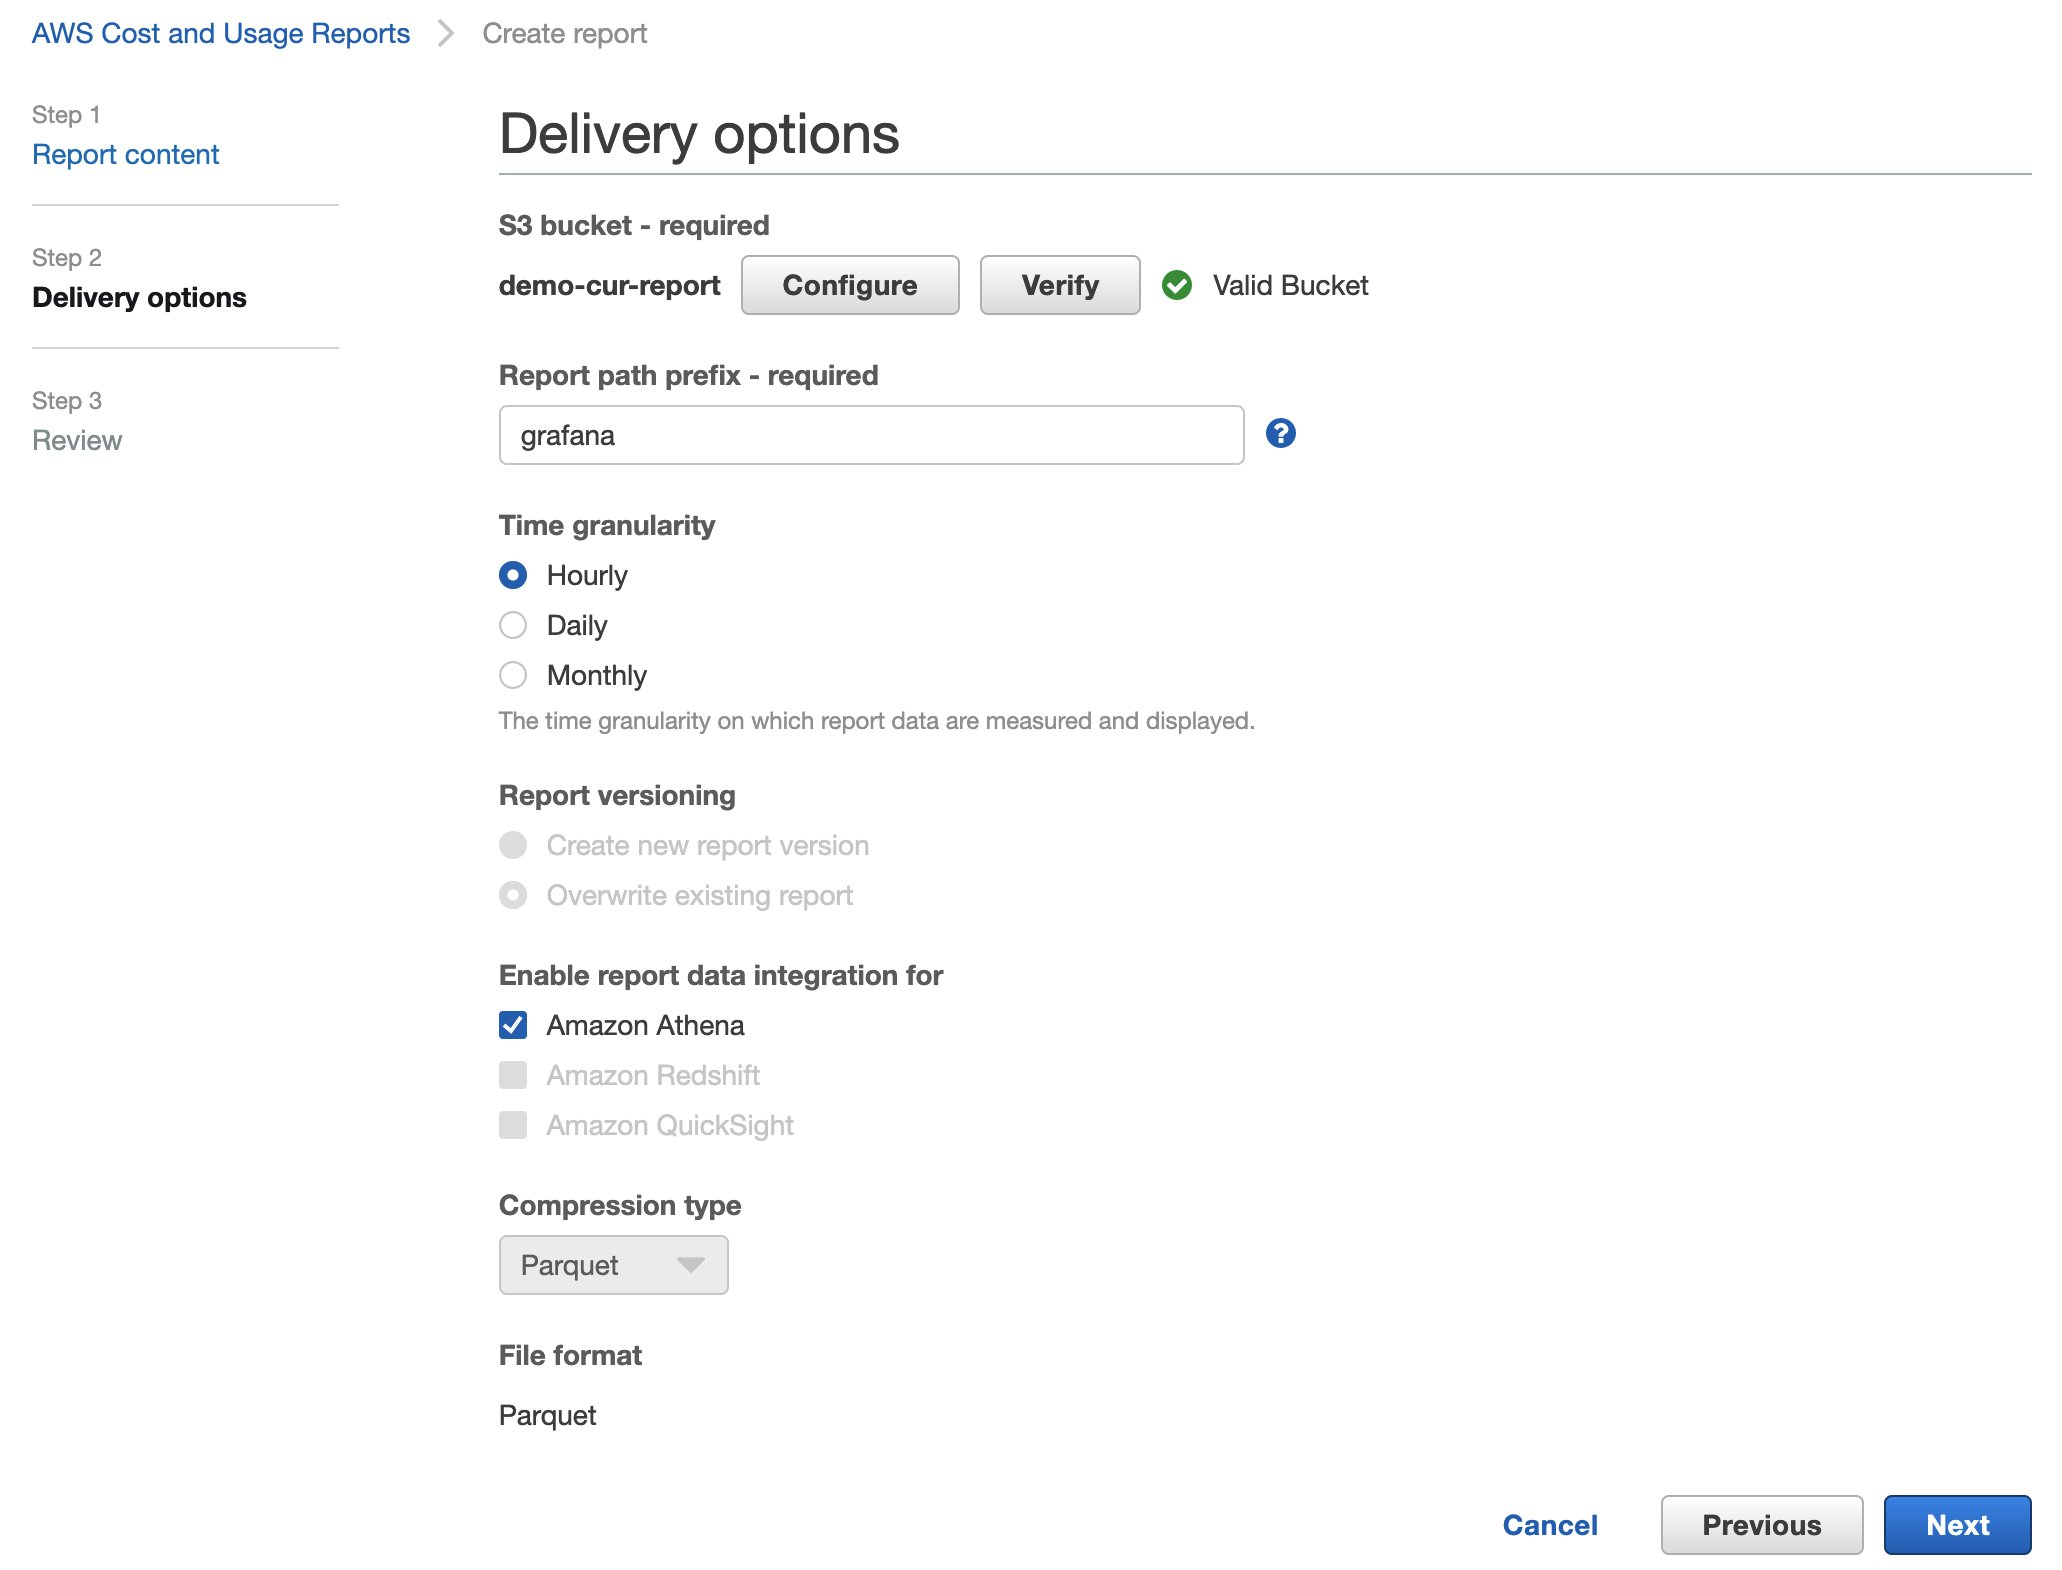
Figure 3. S3 Delivery Options for AWS Cost and Usage Report
It may take up to 24 hours for AWS to deliver your first report into the S3 bucket.
Step 2: Querying AWS CUR using Athena
Let’s query and analyze the data from your AWS CUR in S3 using standard SQL in Amazon Athena.
To streamline and automate the one-time integration of your Cost and Usage Reports with Athena, AWS provides a AWS CloudFormation template. This will ensure that your latest cost and usage information is always available to Athena—with no additional work required to prepare your data for analysis. Follow the detailed instructions on Setting up Athena using AWS CloudFormation templates to complete the integration with Athena.
Create Athena Workgroup for Grafana Queries and configure IAM permissions
Athena supports Workgroups to separate workload configurations between users or applications. This solution uses a dedicated Workgroup to simplify the access to the Athena queries and raw AWS CUR data.
Let’s create an S3 bucket to store Amazon Managed Grafana’s query results. To learn more about securing S3 buckets, please refer to Security Best Practices for Amazon S3.
- In the AWS Management Console, on the Services menu, select S3.
- For the S3 bucket name, use the following prefix to make sure of compatibility with the service managed AWS Identity and Access Management(IAM) policies:
grafana-athena-query-results-
Example S3 bucket name: grafana-athena-query-results-XXXXXXX
If you plan to use any other S3 bucket name to store query results, then you must add s3.Get* and s3.List* permissions for S3 bucket for the IAM role AmazonGrafanaServiceRole-XXXXX as shown in the following.
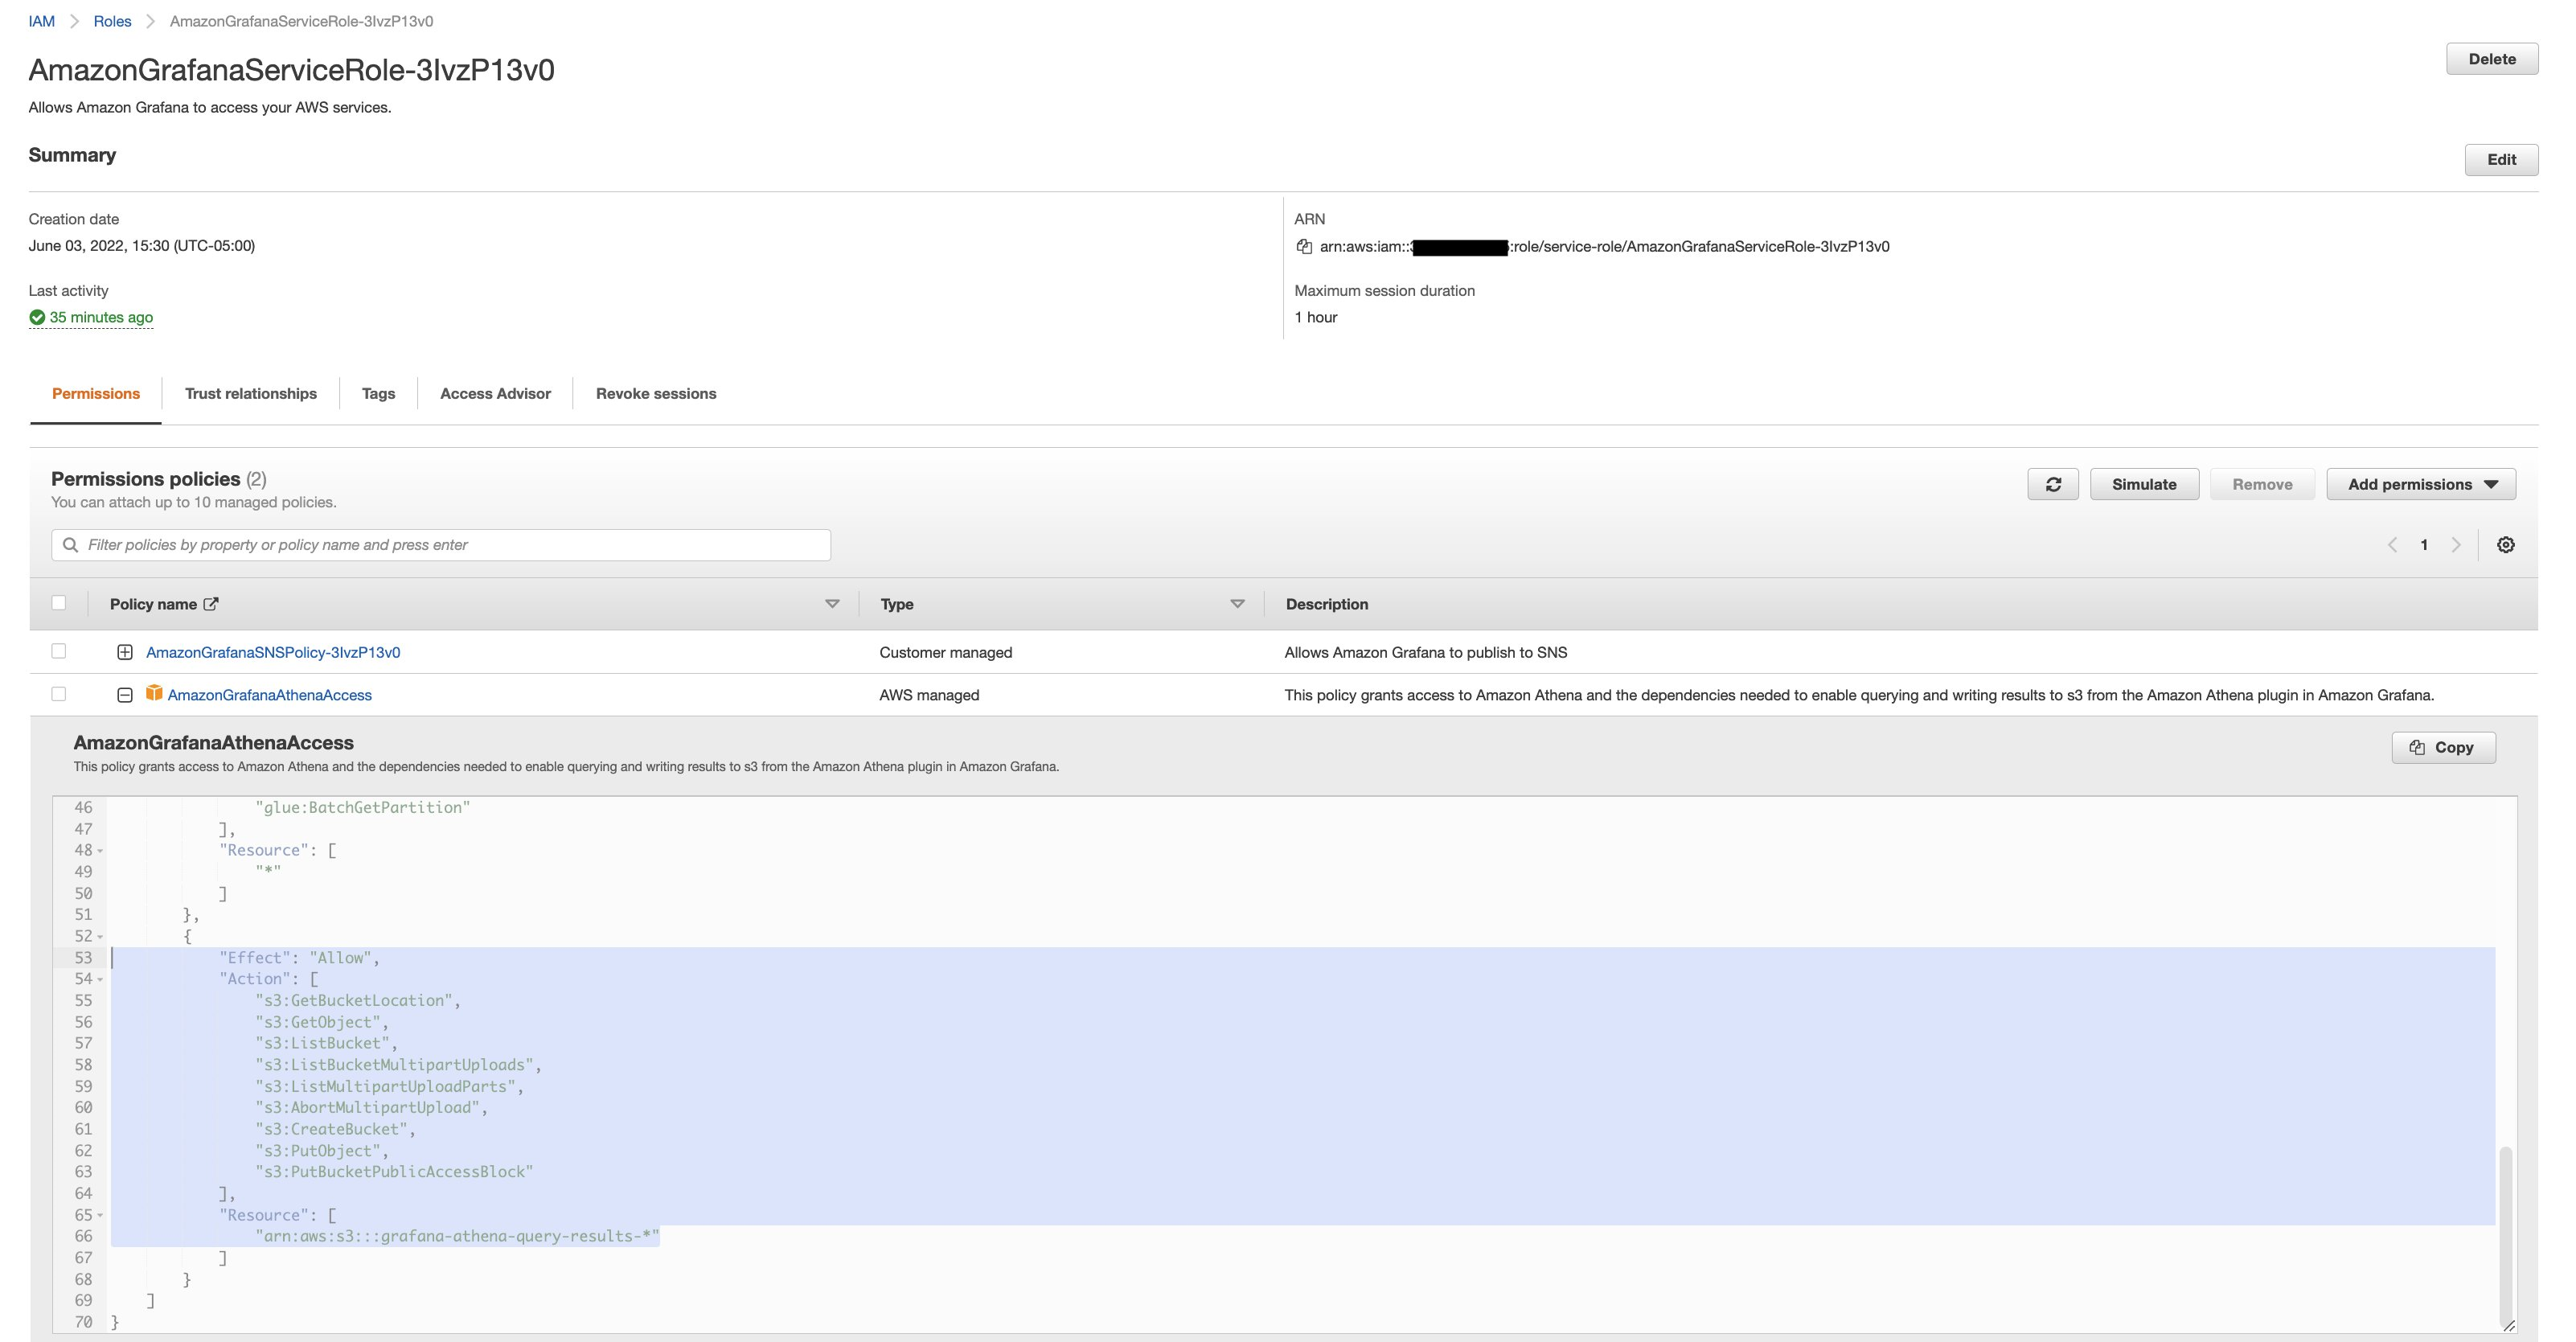
Figure 4. Configure permission for AmazonGrafanaServiceRole
- For AWS Region, make sure that you create the S3 bucket in the same AWS region where you plan to deploy the Amazon Managed Grafana workspace
Now, we’ll create a new Athena Workgroup for Grafana queries:
- In the console, on the Services menu, select
Athena. - On the left menu, select
Workgroups. - Select
Create workgroup.- Enter a Workgroup name. For Example
Grafana. - For Location of query result, enter the S3 path to the bucket created in the ‘Setup and create Cost & Usage Report’ section.
- Enter a Workgroup name. For Example
s3://grafana-athena-query-results-XXXXXXXXXX/
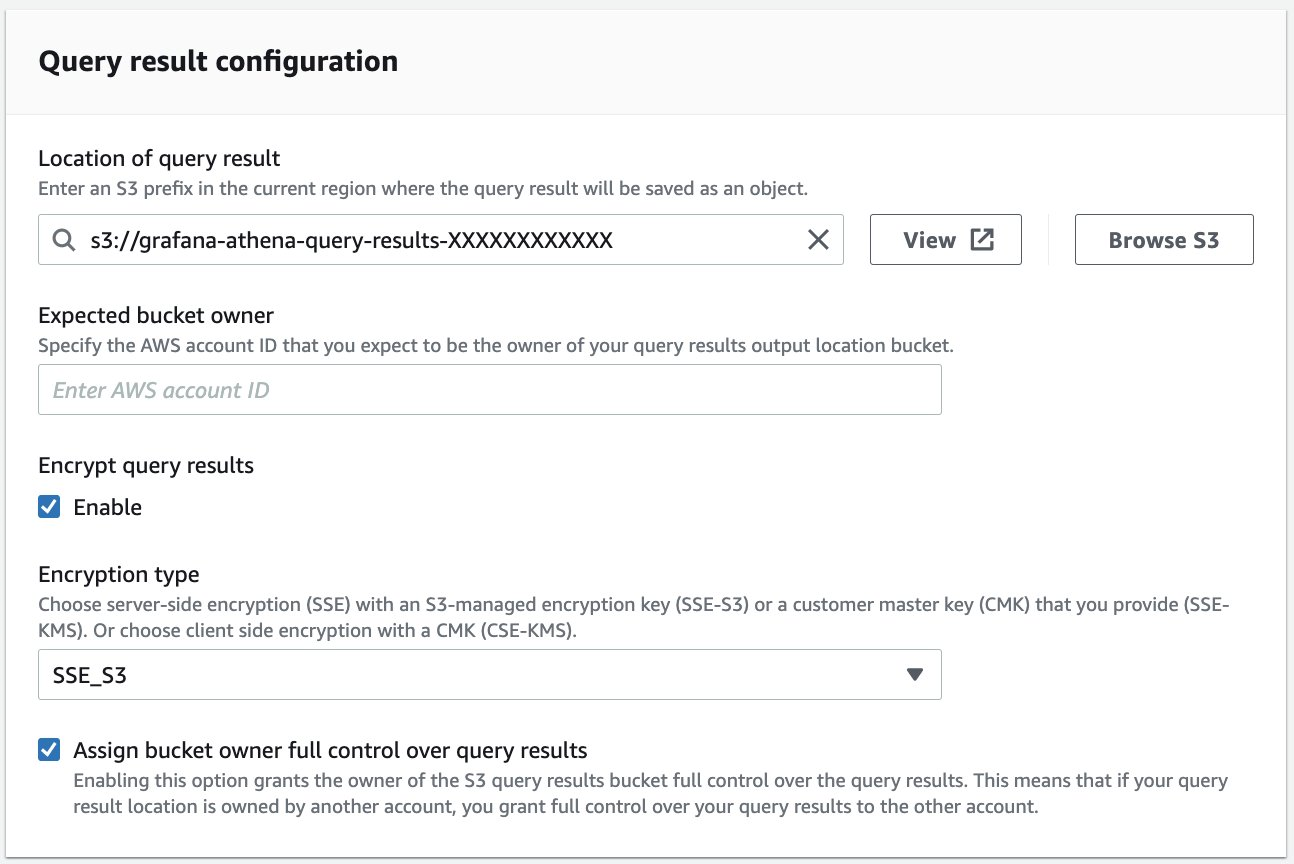
Figure 5. Athena Workgroup Configuration to store query result in S3
- For Tags, select
Add new tag - Tag Key:
GrafanaDataSource - Tag Value:
true
Adding a tag with the above key and value is essential to using Amazon Managed Grafana workspace’s service managed IAM policy with Athena workgroup.Select Create workgroup.
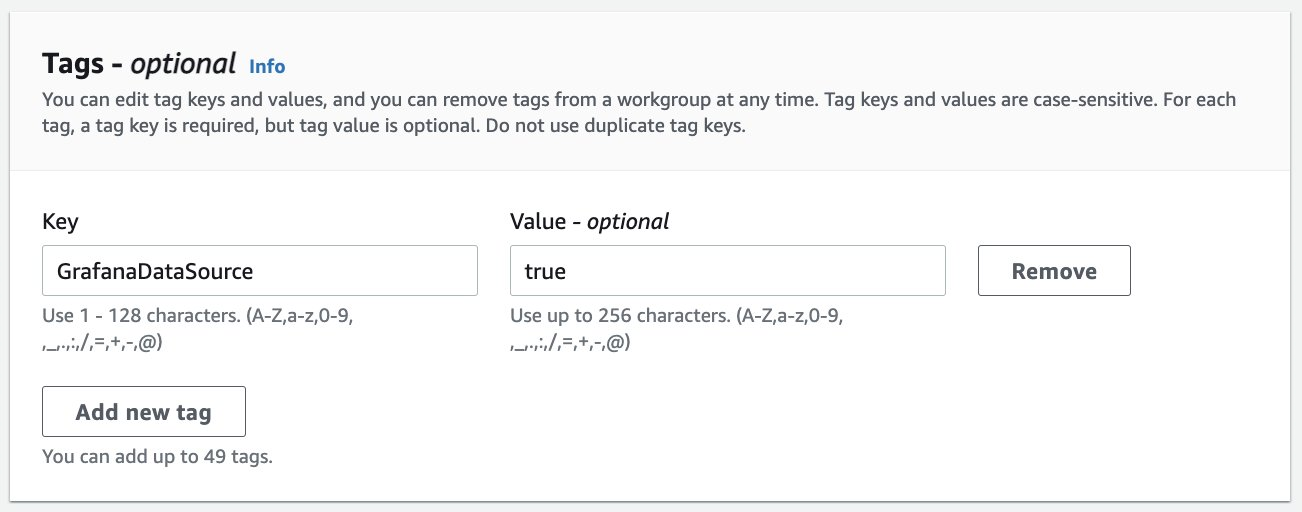
Figure 6. Athena Workgroup Tagging for GrafanaDataSource
-
- Select Create workgroup
At this point, you now have a functional Athena Query Editor. From the new workgroup, you can now run sql-like queries against the AWS CUR data. For more information on how to run SQL queries in Athena, see Running Amazon Athena queries.
Step 3: Setup Amazon Managed Grafana Workspace
Refer to Amazon Managed Grafana – Getting Started for information on how to configure and setup Amazon Managed Grafana. Amazon Managed Grafana lets you to configure user access through AWS IAM Identity Center or other SAML based Identity Providers (IdP). In this post, we’re using the AWS IAM Identity Center option with Amazon Managed Grafana. To set up Authentication and Authorization, follow the instructions in the Amazon Managed Grafana User Guide for enabling AWS IAM Identity Center.
Configure Athena Data Source in Amazon Managed Grafana
Make sure that you already have the AWS CUR available in the S3 and you can query AWS CUR data using Amazon Athena before configuring the Athena data source in Amazon Managed Grafana.
Select AWS services from the AWS logo on the left navigation menu.
This will take you to a screen that shows all of the AWS data sources available for you to choose from. Select Athena from the list
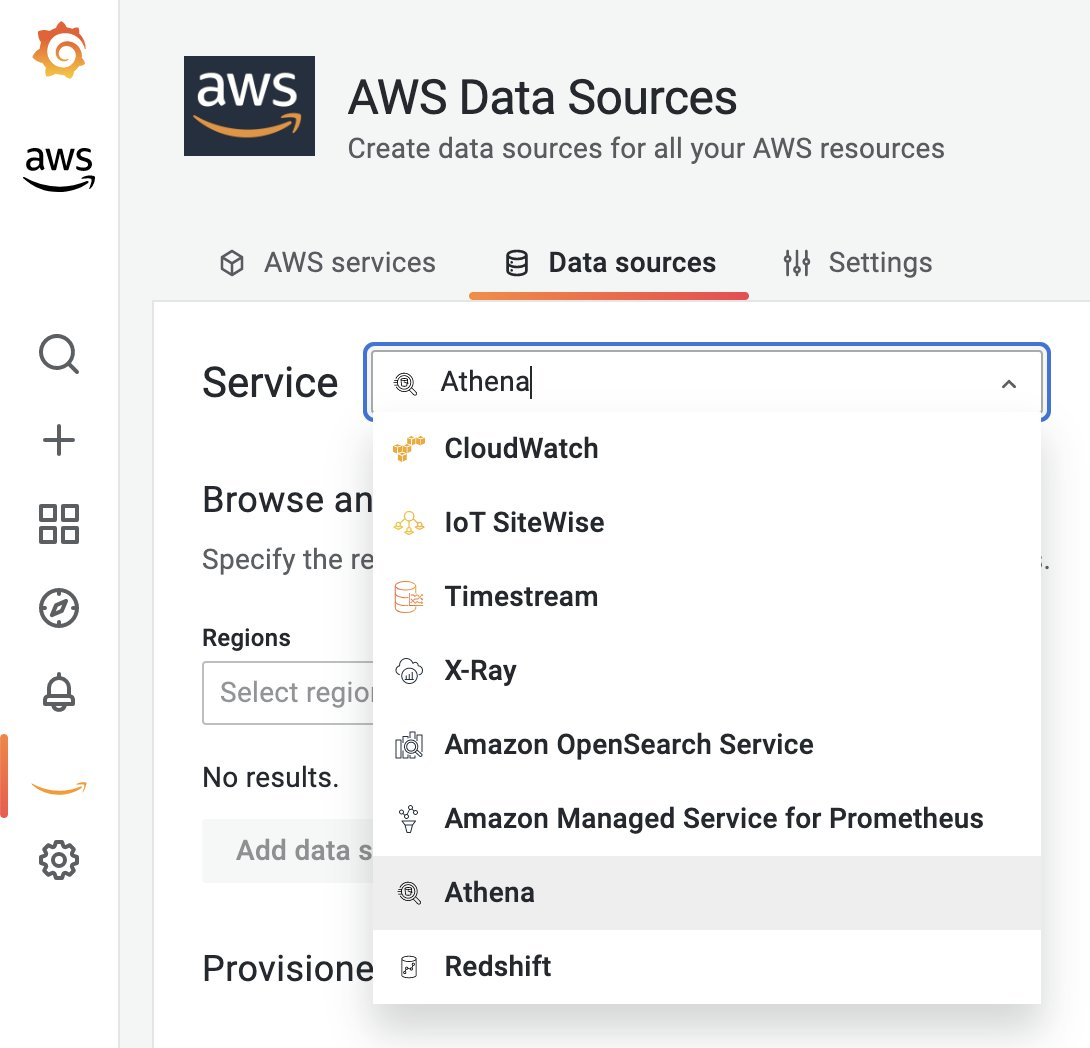
Figure 7. AWS Data Source in Amazon Managed Grafana
Choose the region where you have your Athena and S3 bucket setup.
Check the Database + Workspace that corresponds to the Athena Workgroup that you have setup for the AWS CUR reporting.
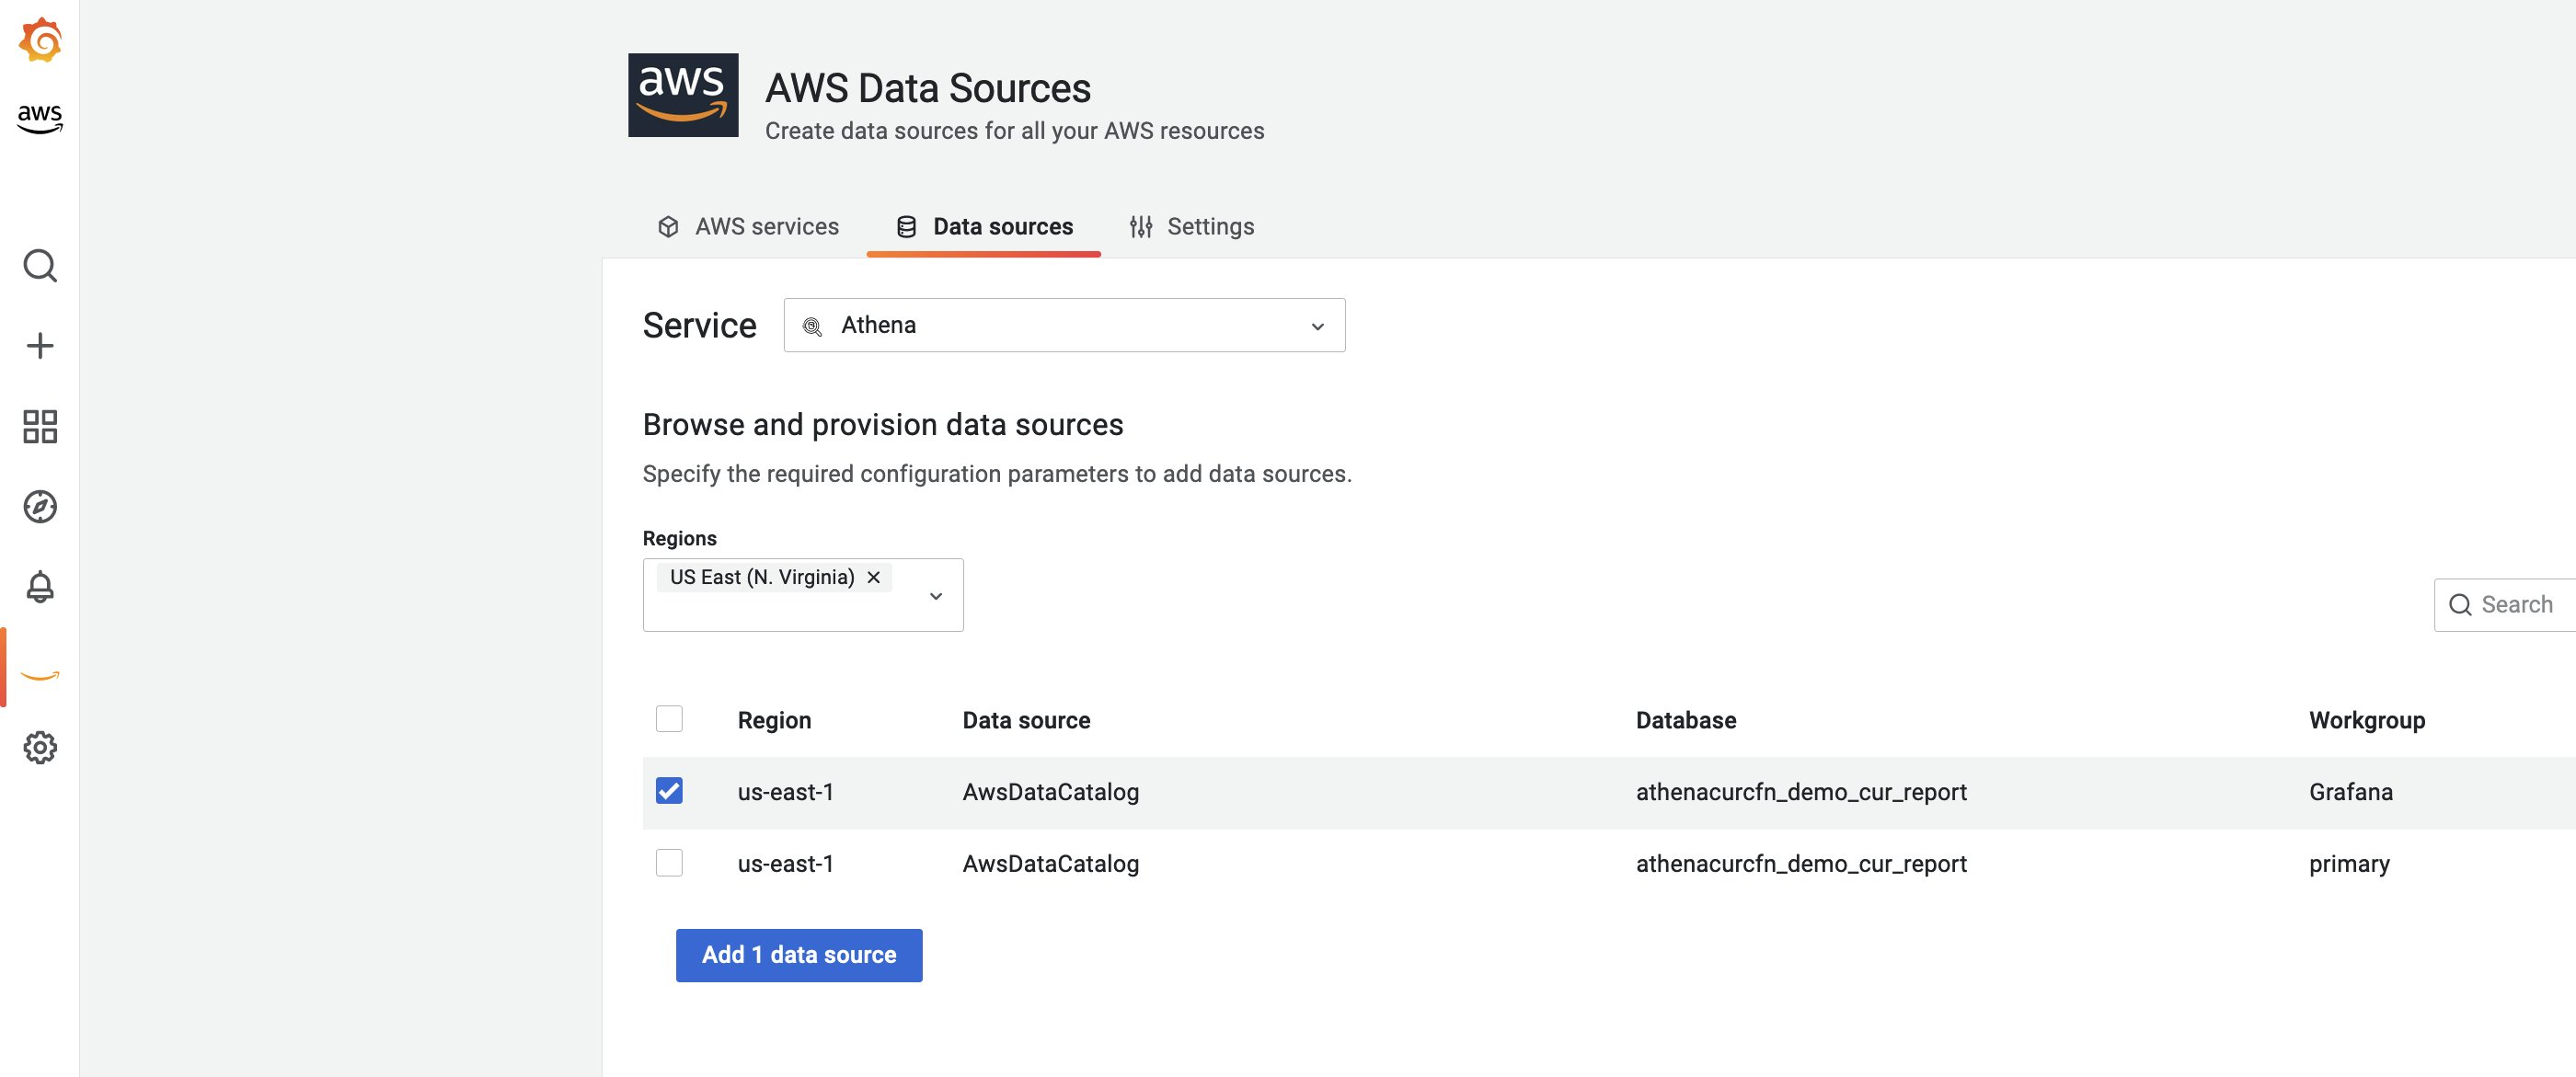
Figure 8. Add Data Source in Amazon Managed Grafana
Select Add 1 data source. Make sure that the Workgroup specified is the one we created in previous section ‘Create Amazon Athena Workgroup for Grafana Queries’.
Now, go to settings and select Save & test to make sure data source is working as expected.
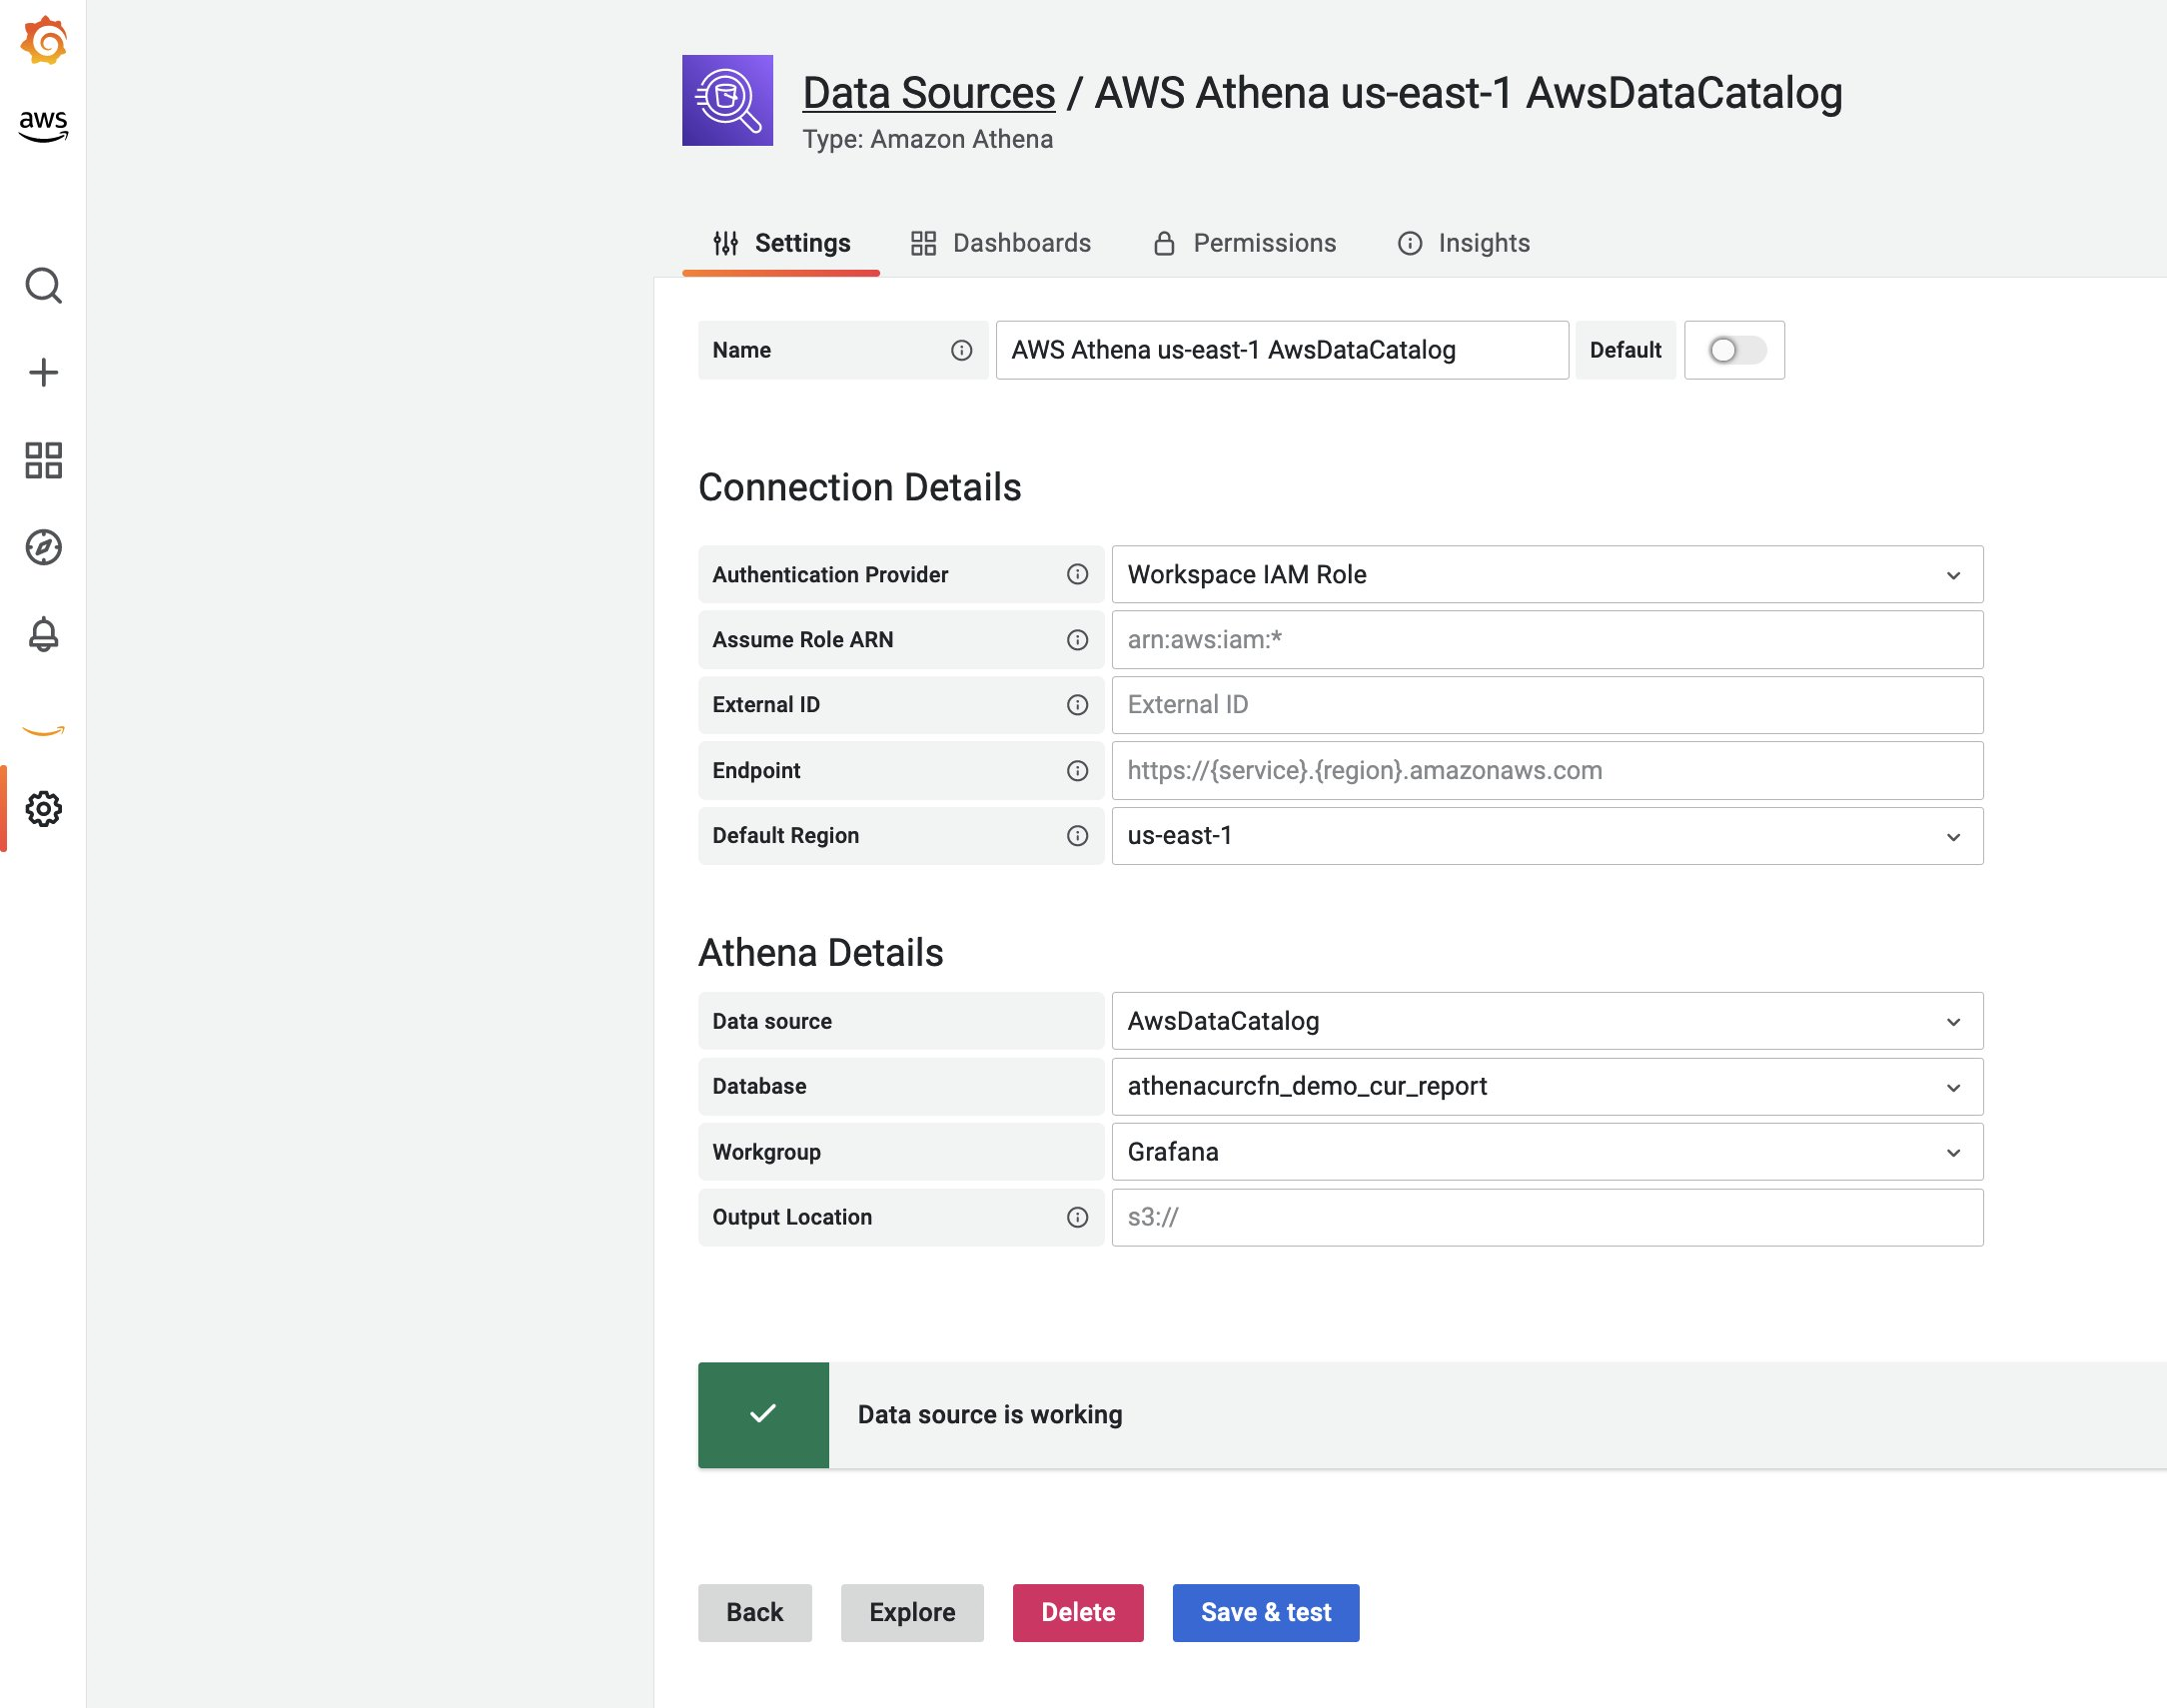
Figure 9. Save and Data Athena Data Source in Amazon Managed Grafana
Configure IAM permissions for AmazonGrafanaServiceRole-XXXXX
Now, in the console, on the Services menu, select IAM and under Roles, search for AmazonGrafanaServiceRole-XXXXX role.
Attach AmazonS3ReadOnlyAccess AWS managed policy to allow Amazon Managed Grafana to query the S3 bucket with AWS CUR report. You can restrict the IAM policy to specific S3 bucket as well. You can learn more at the post Writing IAM policies: How to Grant Access to an Amazon S3 Bucket.
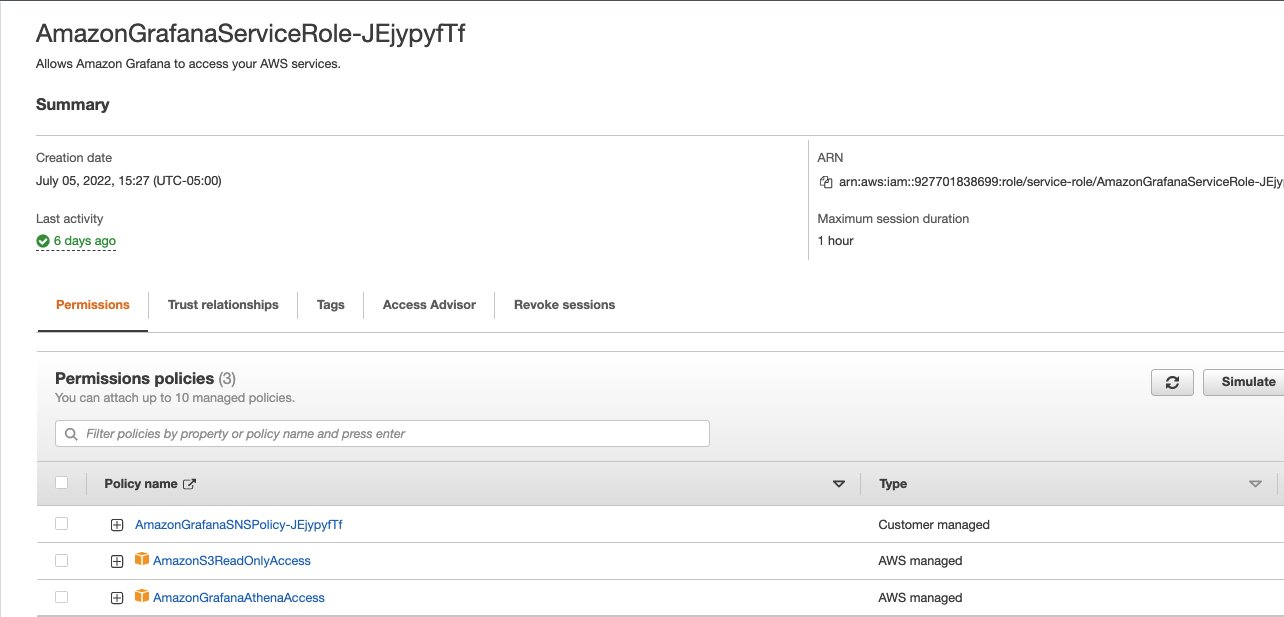
Figure 10. Configure IAM Permissions for Amazon Managed Grafana’s Service RoleDashboard in Amazon Managed Grafana
Step 4: Visualizing Grafana dashboards
Amazon Managed Grafana has a default Grafana dashboard for Cost and Usage analysis for the Athena data source.
Default ‘Athena Cost and Usage Report’ dashboard
To get that default Amazon Managed Grafana dashboard, while still on the Athena Data Source screen, select the second tab Dashboards as shown in the following:
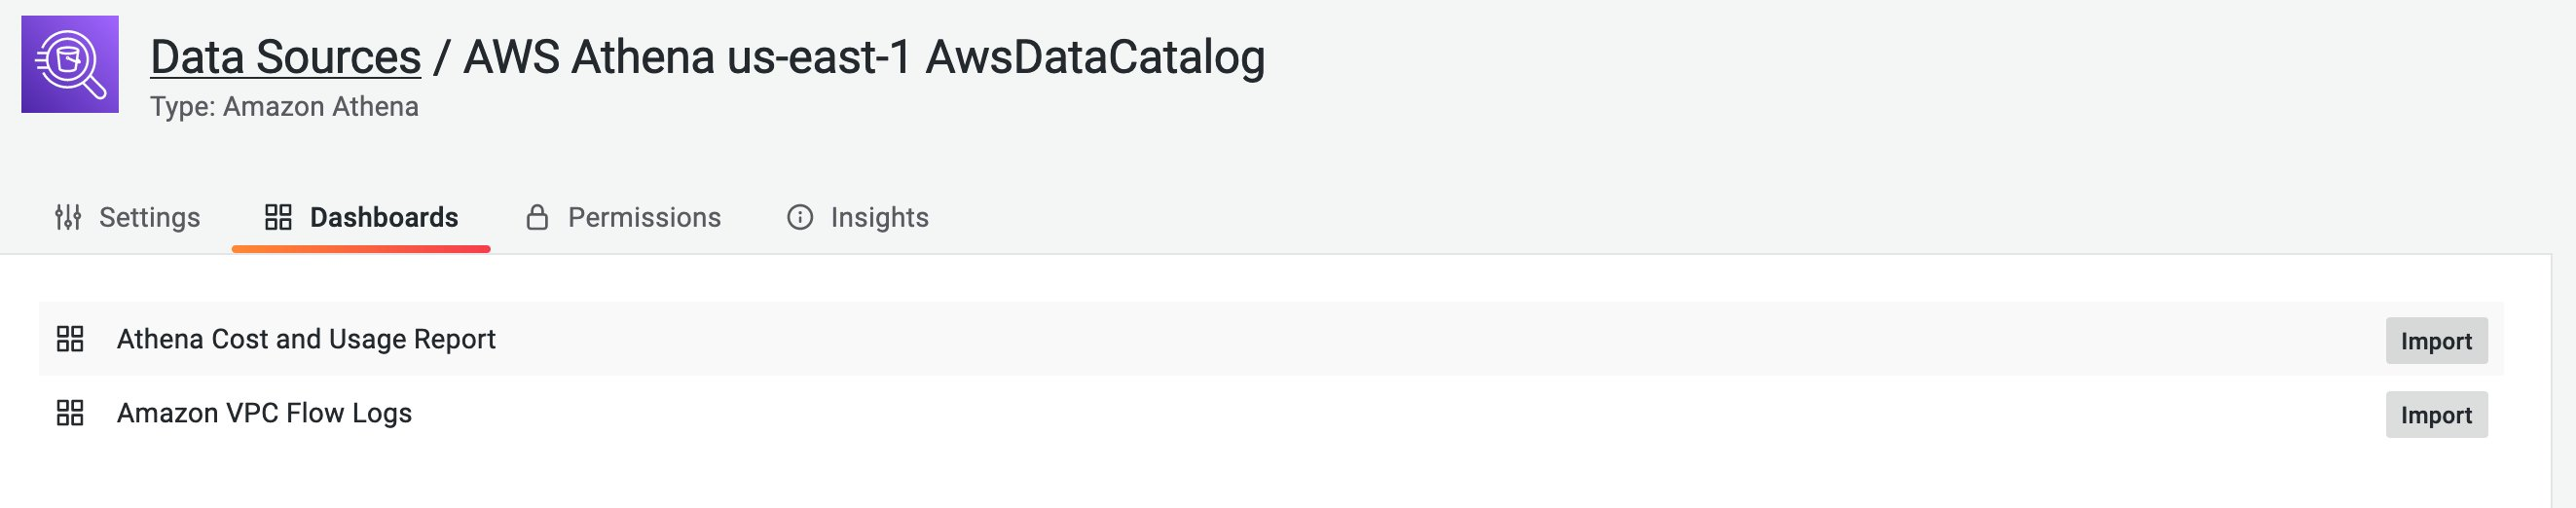
Figure 11. Default Curated Cost and Usage Report Dashboard in Amazon Managed Grafana
Select import next to Athena Cost and Usage Report to import the dashboard. Select ‘Browser’ in the Dashboards menu to view all Grafana dashboards.
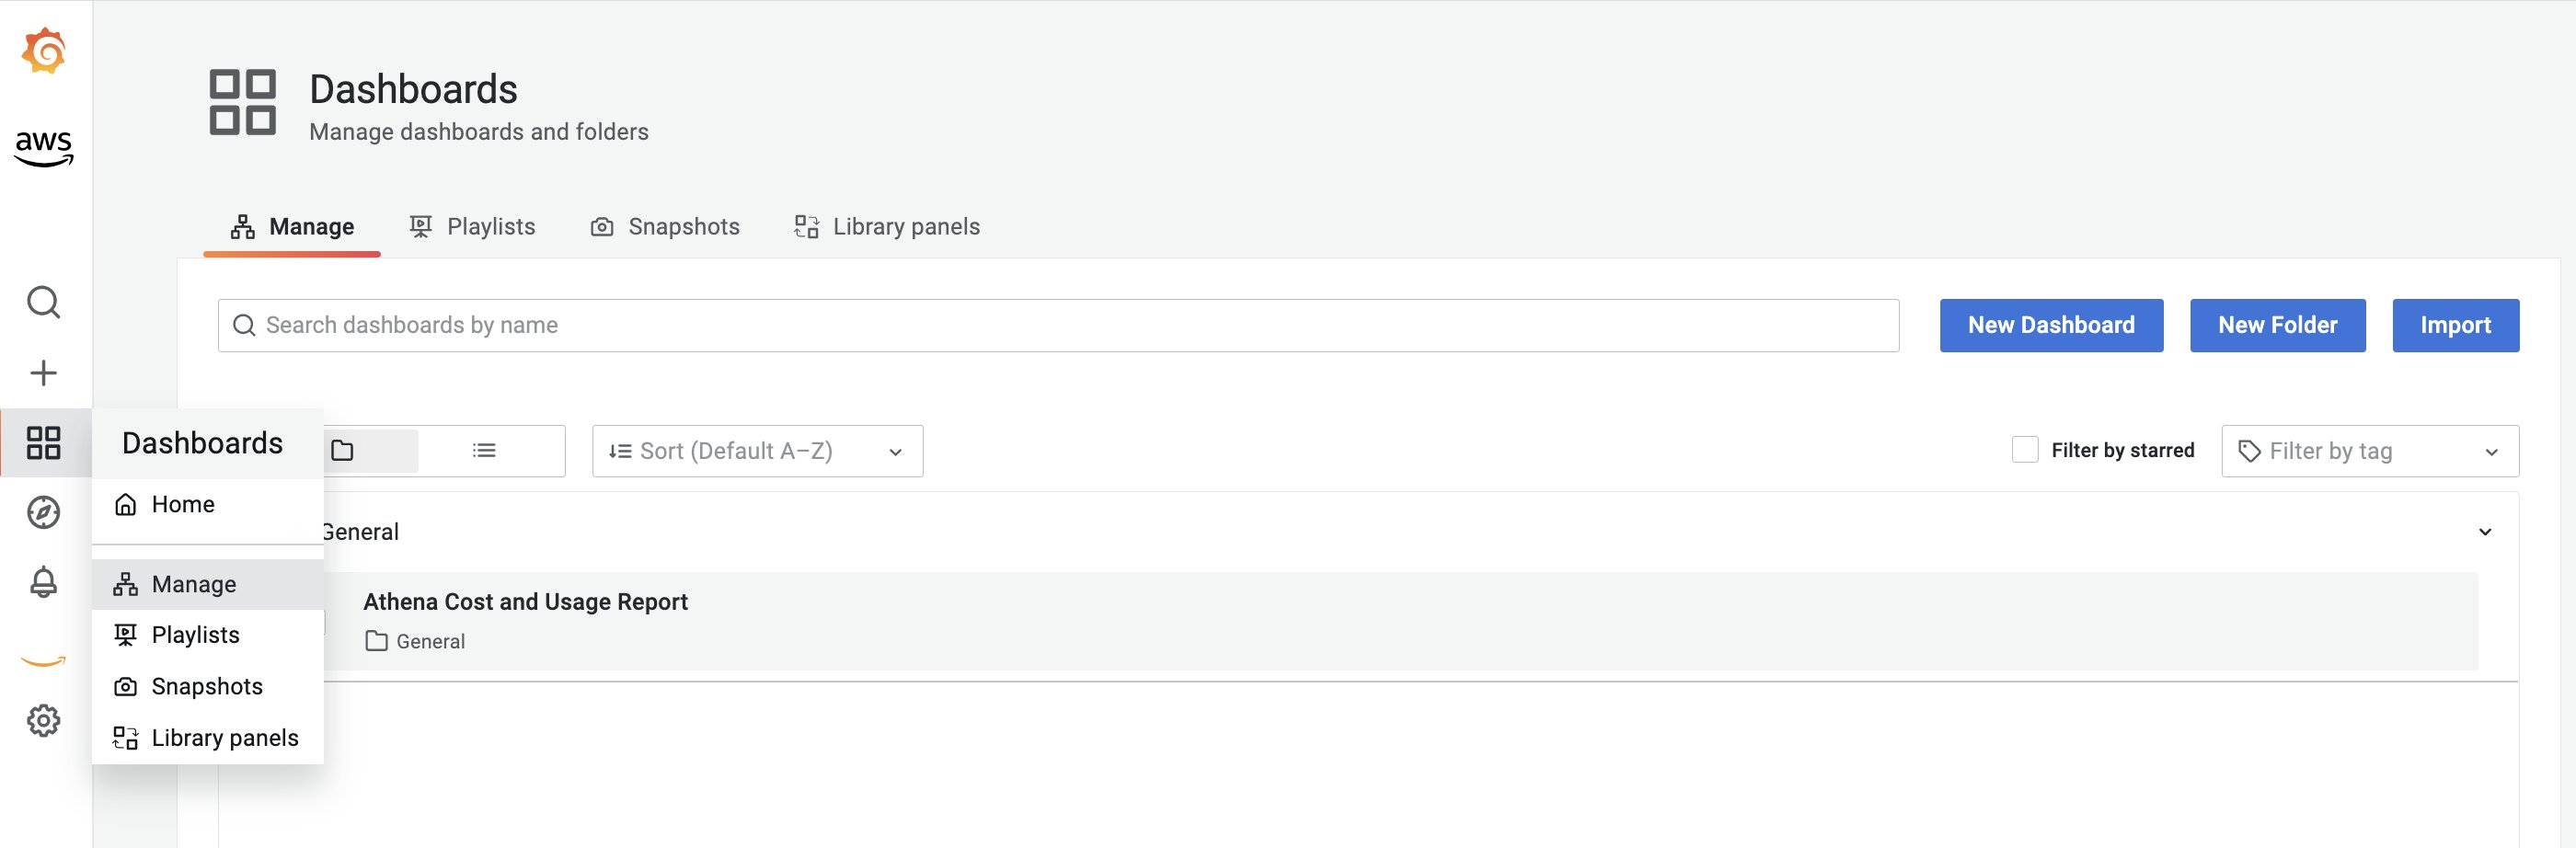
Figure 12. Dashboard view in Amazon Managed Grafana
You can see the Grafana dashboard showing the cost and usage metrics from the AWS CUR report.
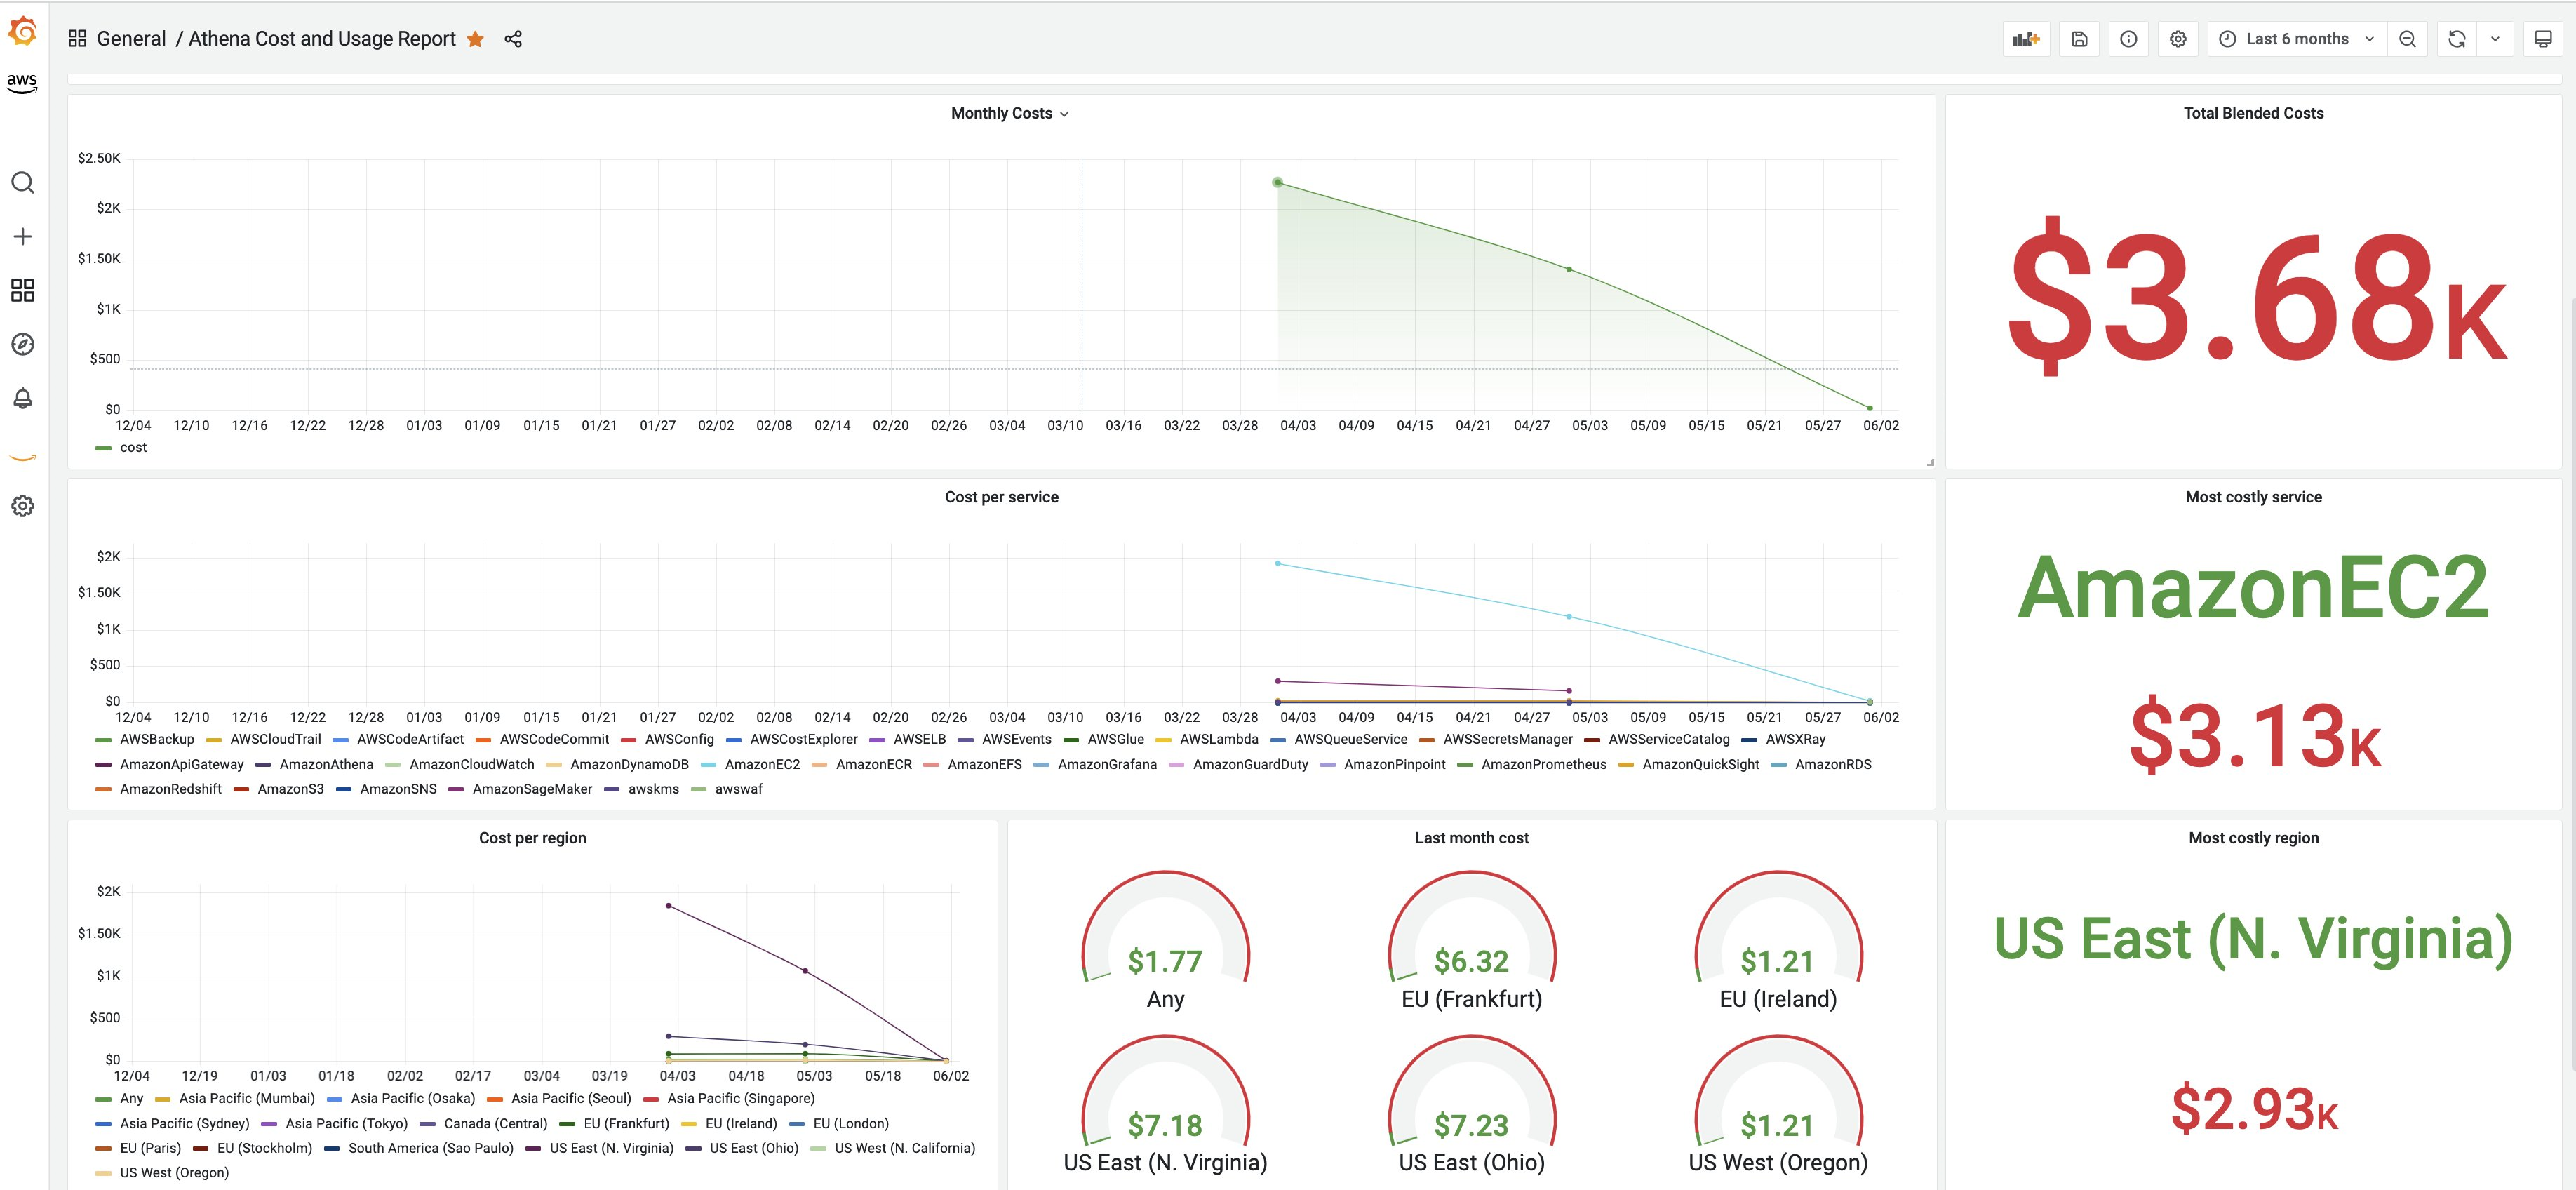
Figure 13. Default Curated ‘Cost and Usage’ dashboard in Amazon Managed Grafana
Custom Cost and Usage SQL Queries
You can also create custom Cost and Usage Grafana panels and dashboards by using your own SQL queries. For example, the following query shows year-to-date costs by AWS service for each region.
Now, let’s create a new Amazon Managed Grafana dashboard and use the previous SQL query in a new Panel to visualize the data as shown in the following:
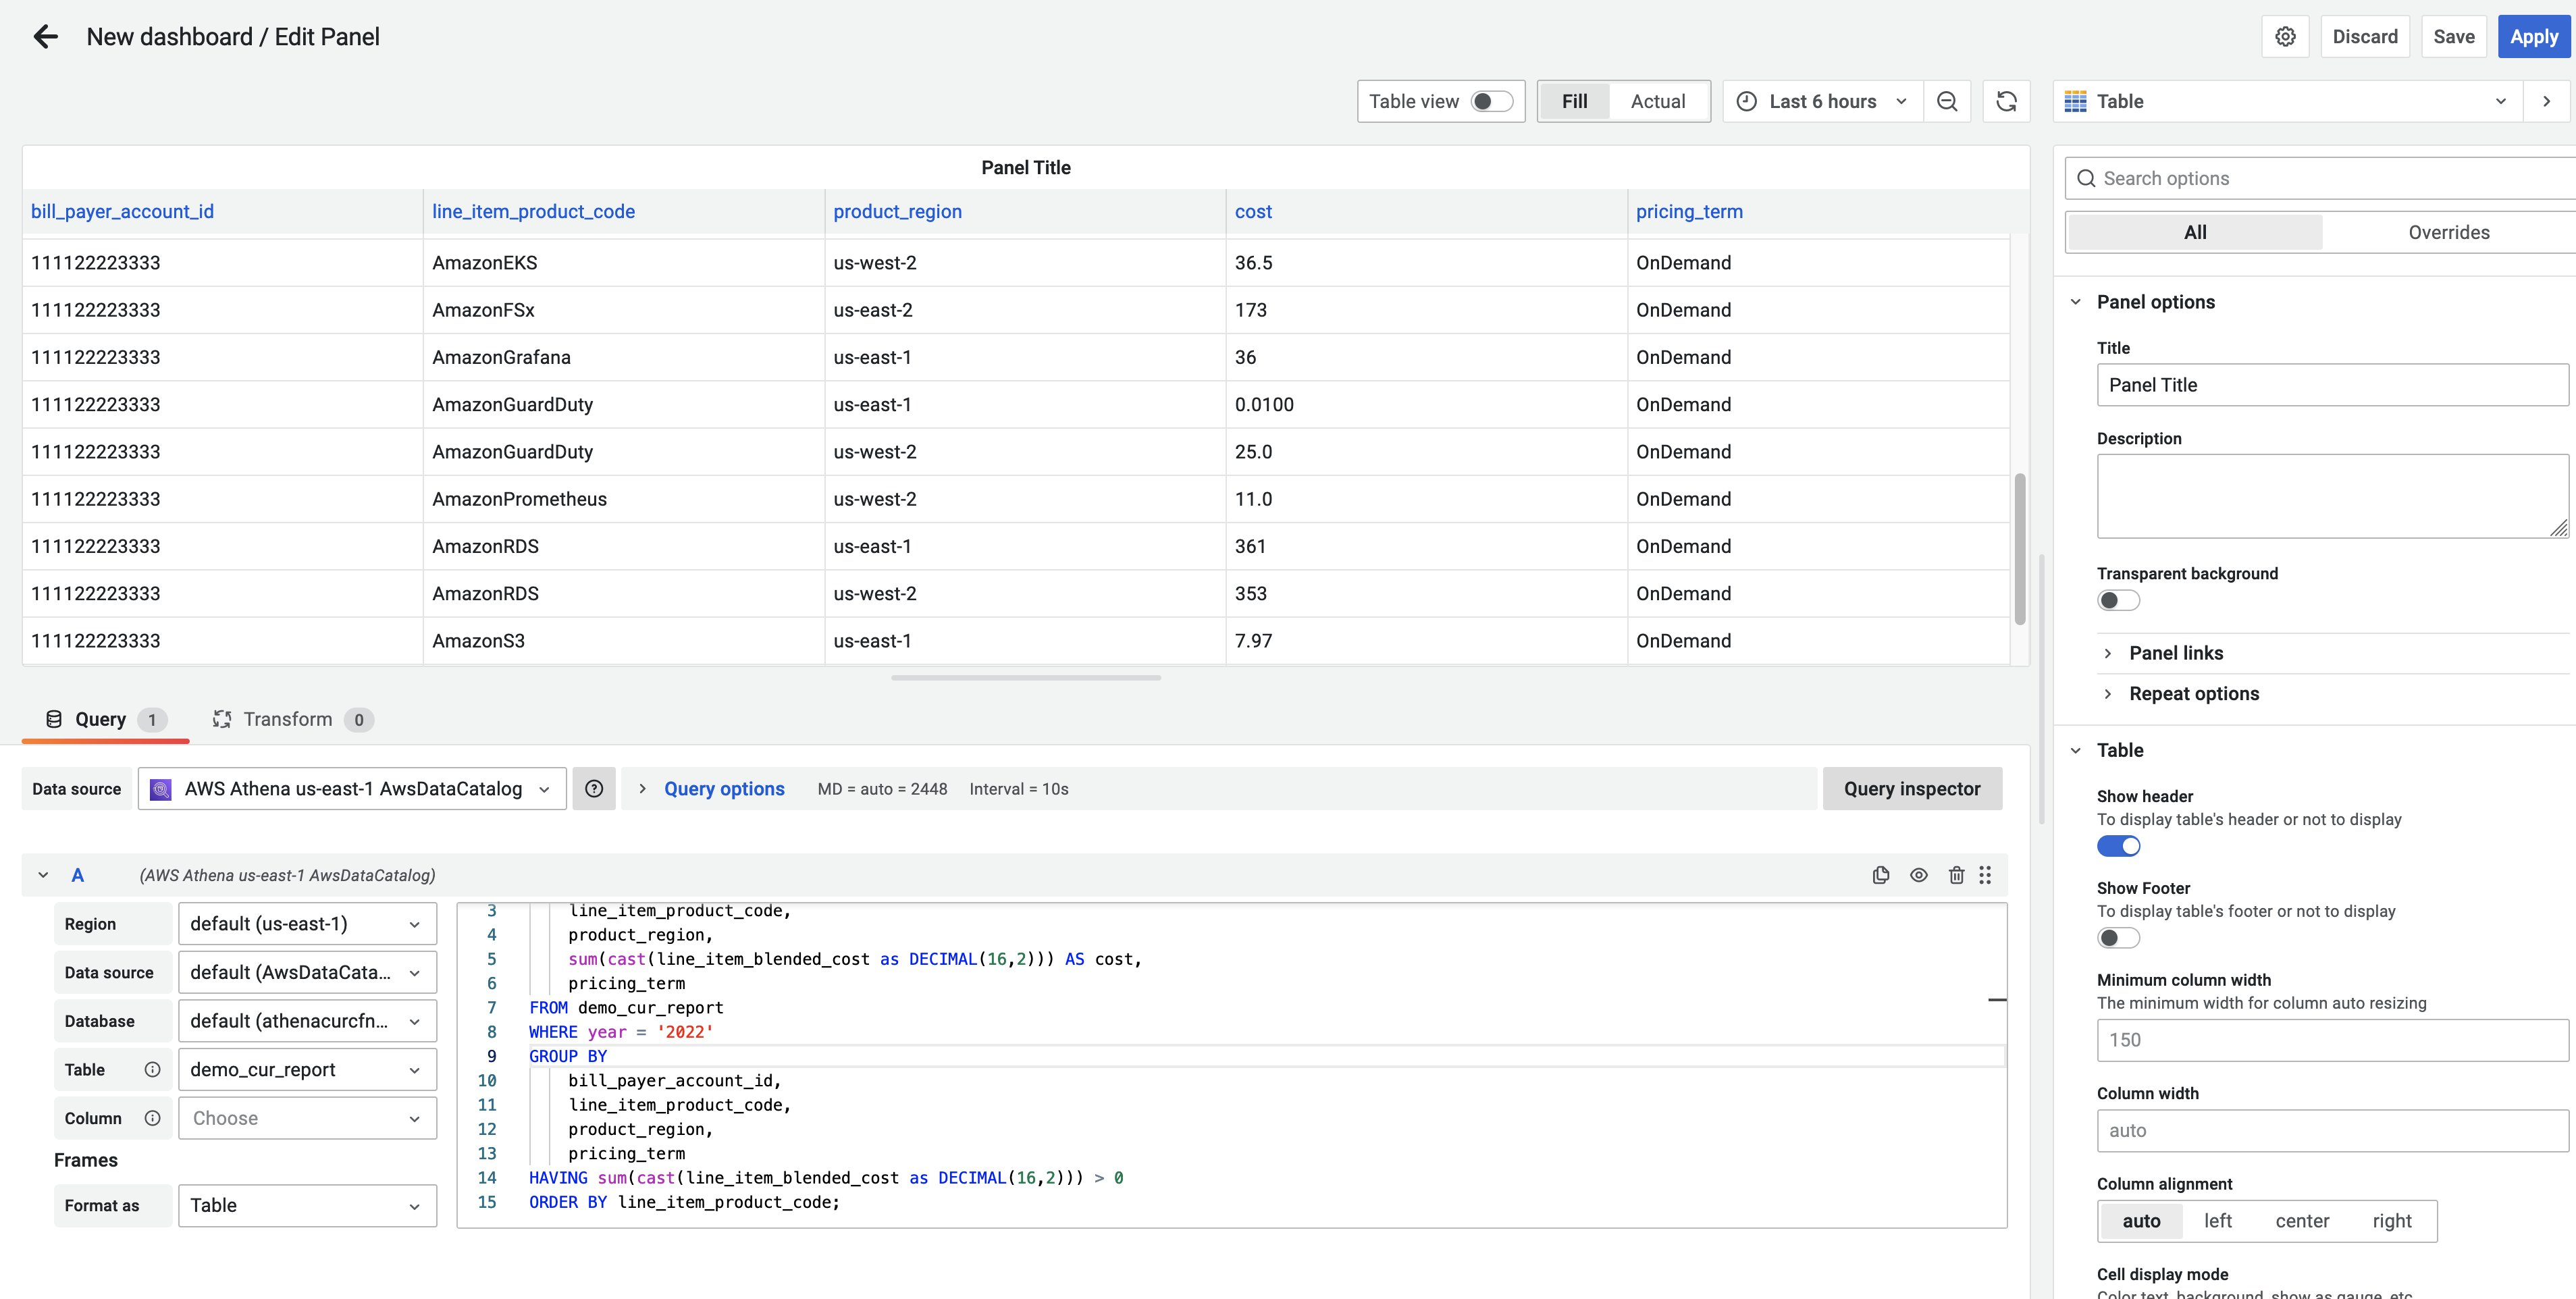
Figure 14. Explore using Custom SQL Query and Athena data source in Amazon Managed Grafana
Select Save and Apply. Your Grafana dashboard will look like the following:
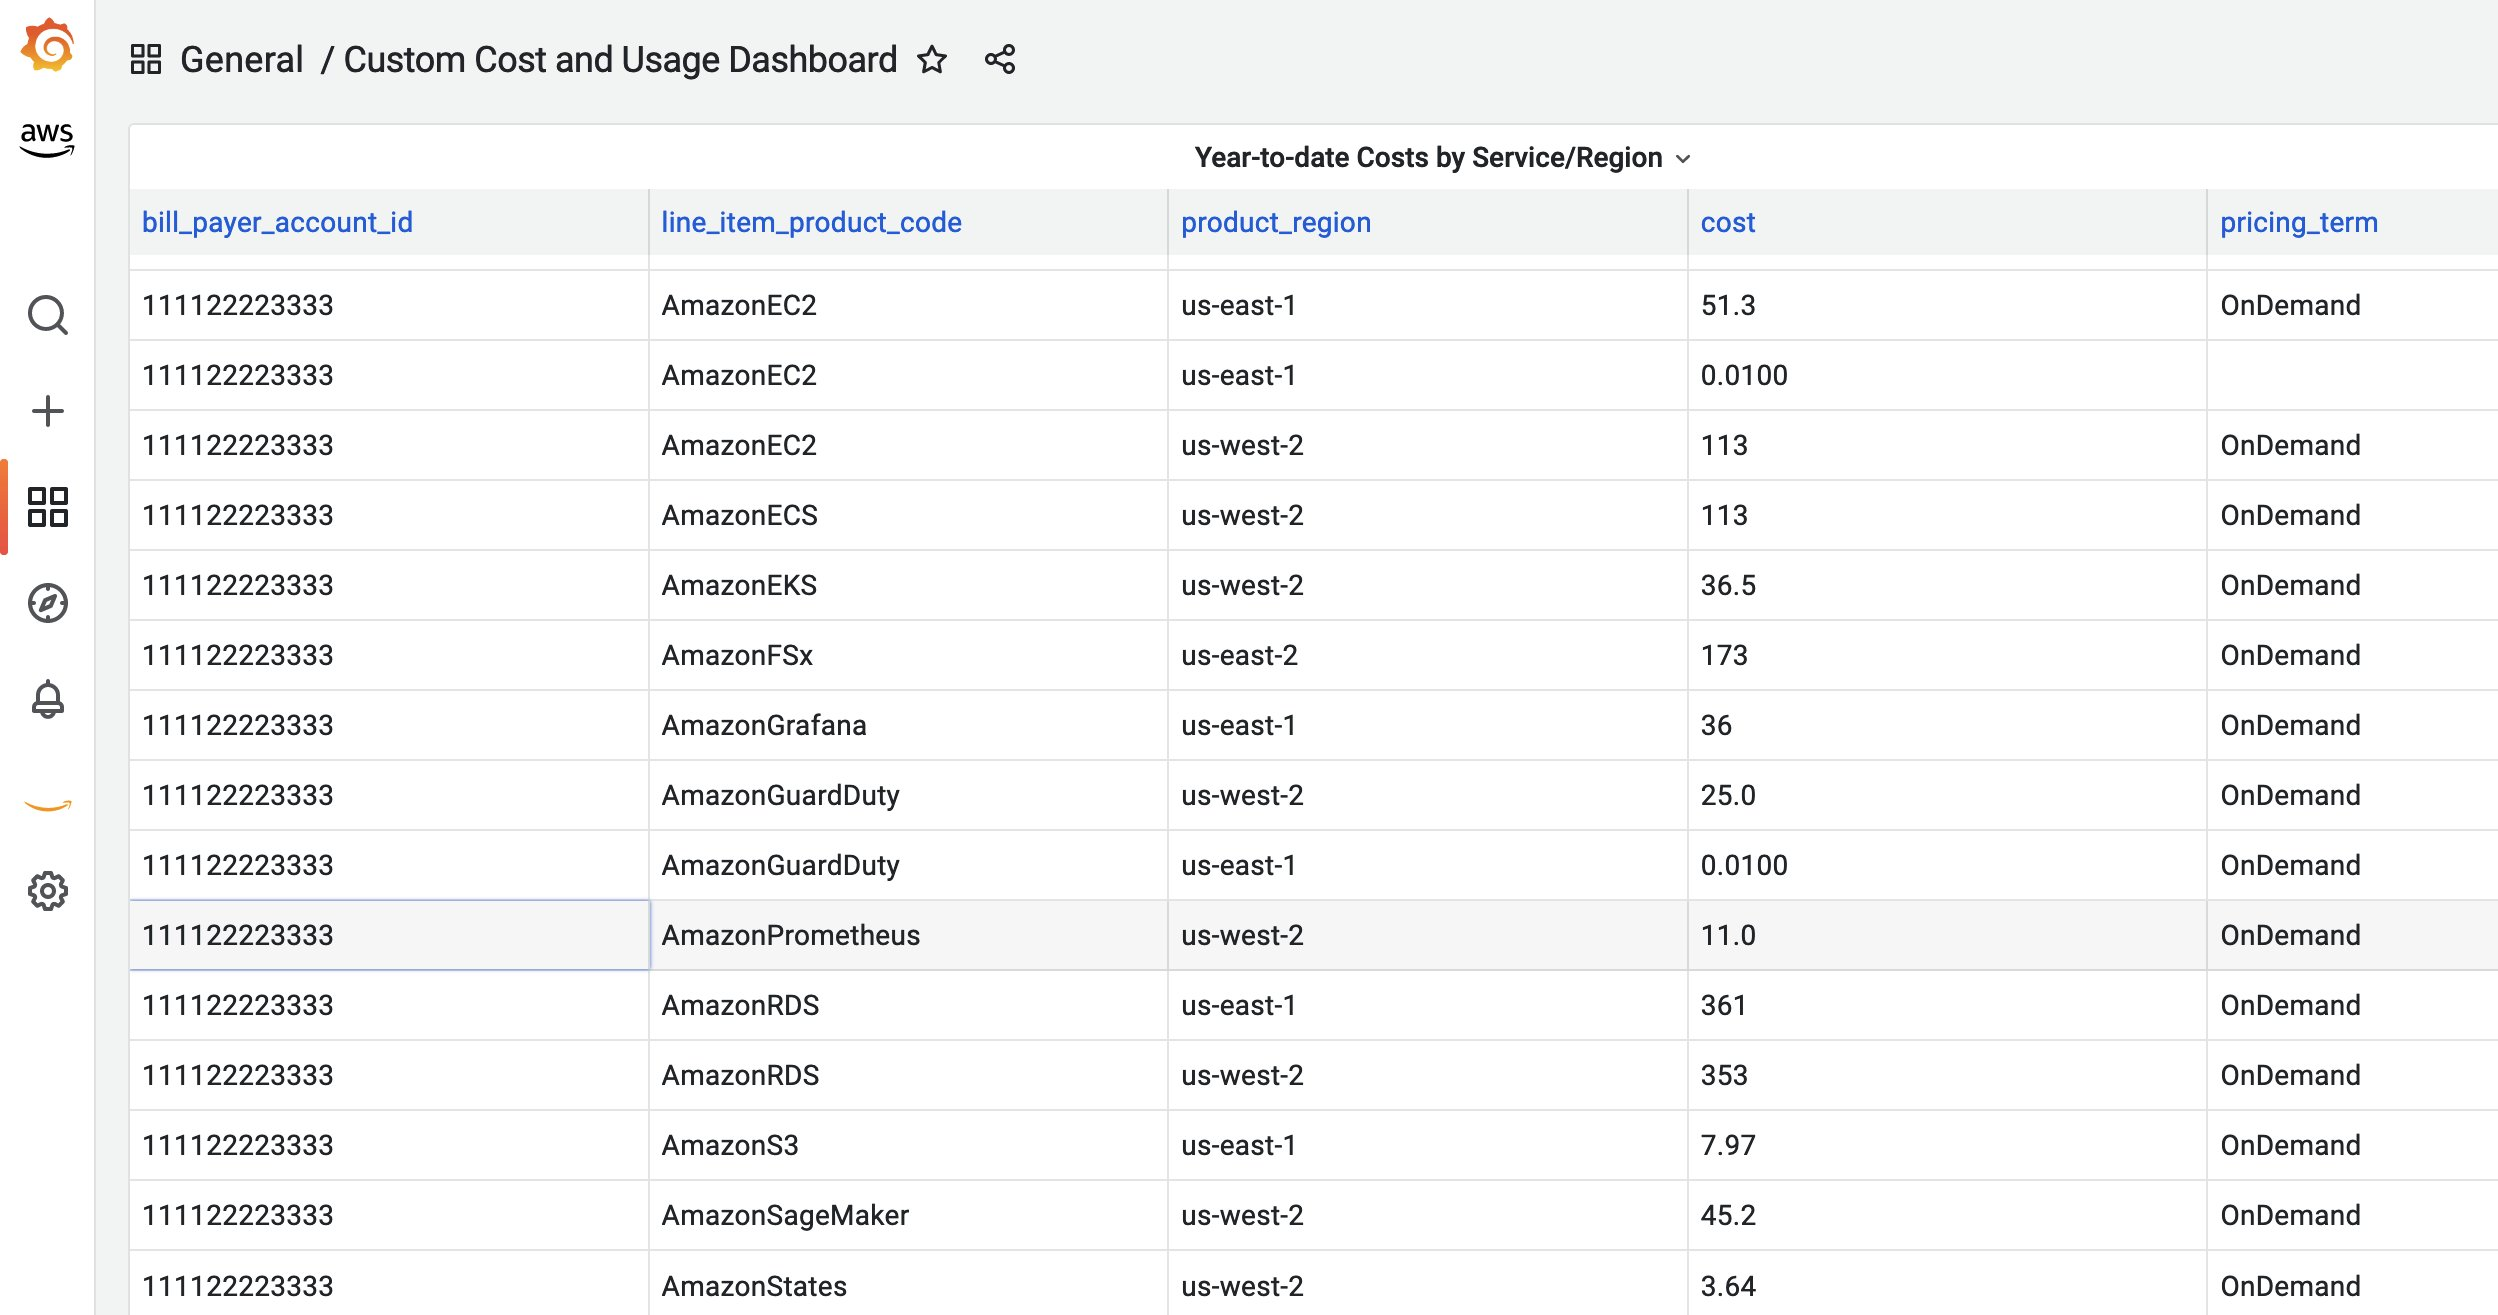
Figure 15. Save and Apply – Custom Cost and Usage Dashboard in Amazon Managed Grafana
For additional SQL queries against AWS CUR data, you can check out Cost and Usage Analysis and AWS CUR Query Library. The AWS CUR Query Library is a collection of curated SQL queries to analyze your Cost and Usage Report (CUR) data. Although cost analysis is unique to each business but these queries are intended to be modified to suit your specific needs.
Create Cost and Usage Report (CURE) Grafana Dashboard (Optional)
To demonstrate Amazon Managed Grafana capabilities with the AWS CUR integration we have created the Cost and Usage REport (CURE) Dashboard which is easily imported into your Amazon Managed Grafana environment.
The CURE Dashboard is a customizable Amazon Managed Grafana dashboard which provides a summary view as well as granular service level views for EC2 (includes Reserved Instances and Saving Plan), EBS Storage, Data Transfer and RDS. Dashboard let your Financial, DevOps and IT teams dive deep into AWS cost and usage and optimize. With little effort customers may modify or add additional sections based on their service adoption.
To import the CURE dashboard, you can download the JSON file content from this location:
curl -O -L "https://raw.githubusercontent.com/aws-observability/observability-best-practices/main/sandbox/cure-grafana-dashboard/AmazonManagedGrafanaCUREDashboard.json"
Now, import the JSON file content into Amazon Managed Grafana. Log in to the Amazon Managed Grafana console, and select the + and import button on the left ribbon panel. Paste the copied JSON file content in the import via panel json text box, and select the AWS Athena data source from the drop down. Then, select the import button to see the CURE dashboard.
You should see different sections of the dashboard similar to the below images. In addition, you can filter and monitor using Linked AWS accounts, AWS regions, and AWS Services.
EC2
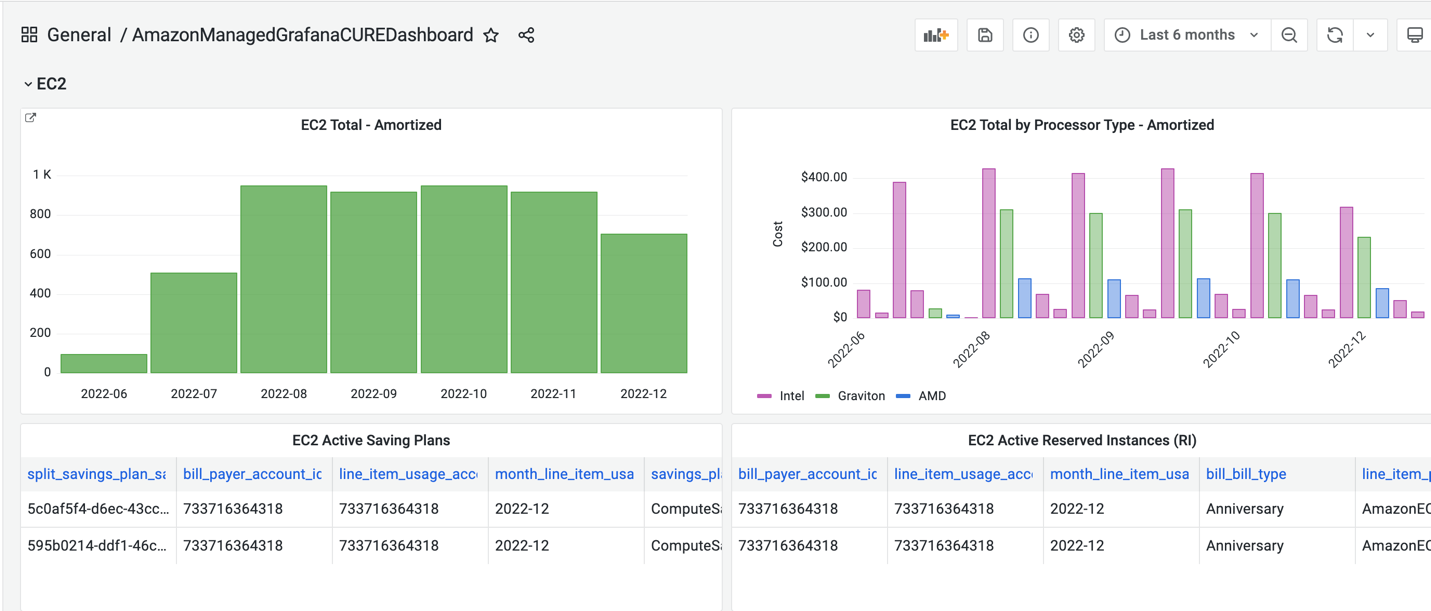
Figure 16. Cost and Usage Report (CURE) dashboard in Amazon Managed Grafana for EC2 Instances
Storage
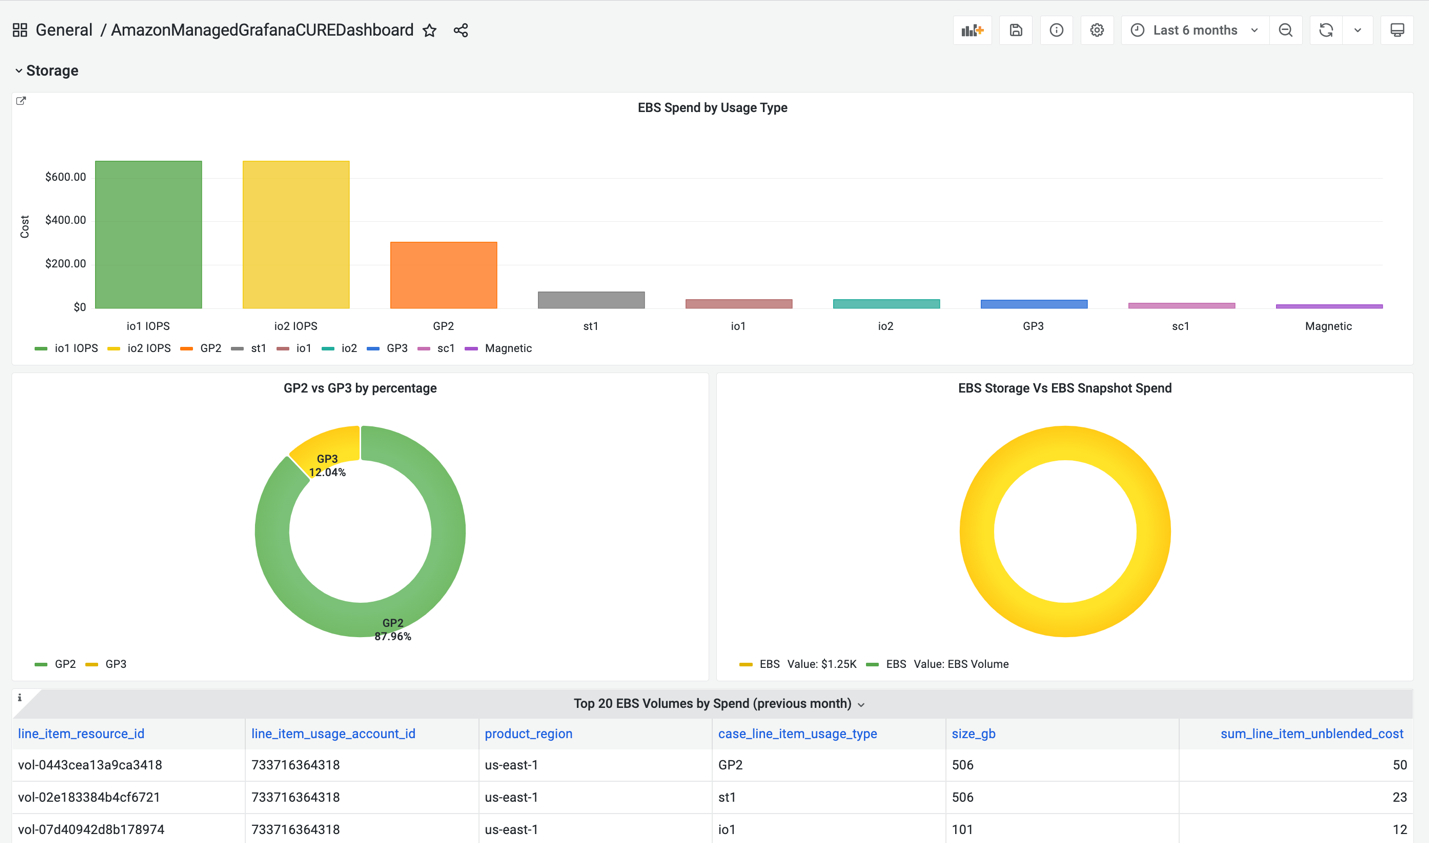
Figure 17. Cost and Usage Report (CURE) dashboard in Amazon Managed Grafana for Data Transfer in AWS
Data Transfer
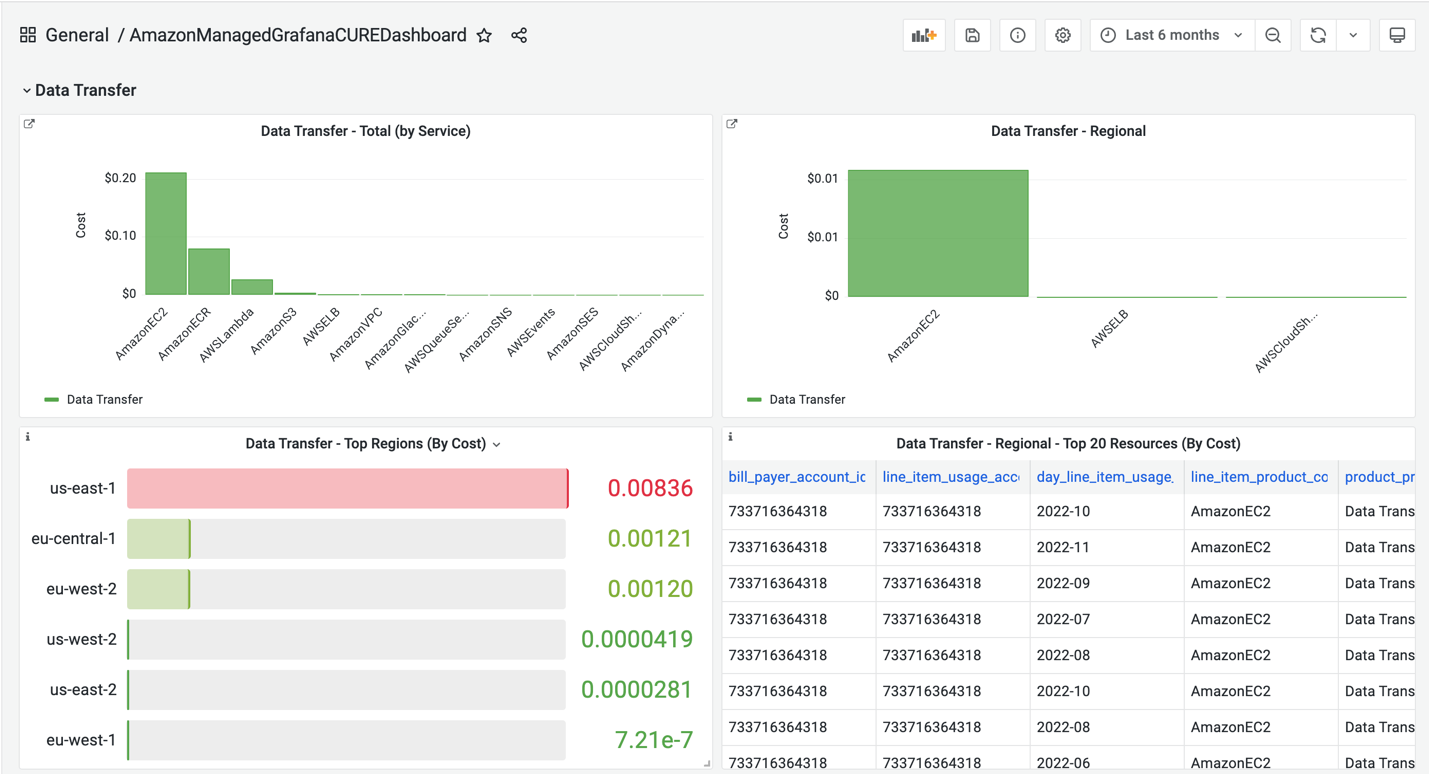
Figure 18. Cost and Usage Report (CURE) dashboard in Amazon Managed Grafana for Data Transfer in AWS
RDS/Aurora
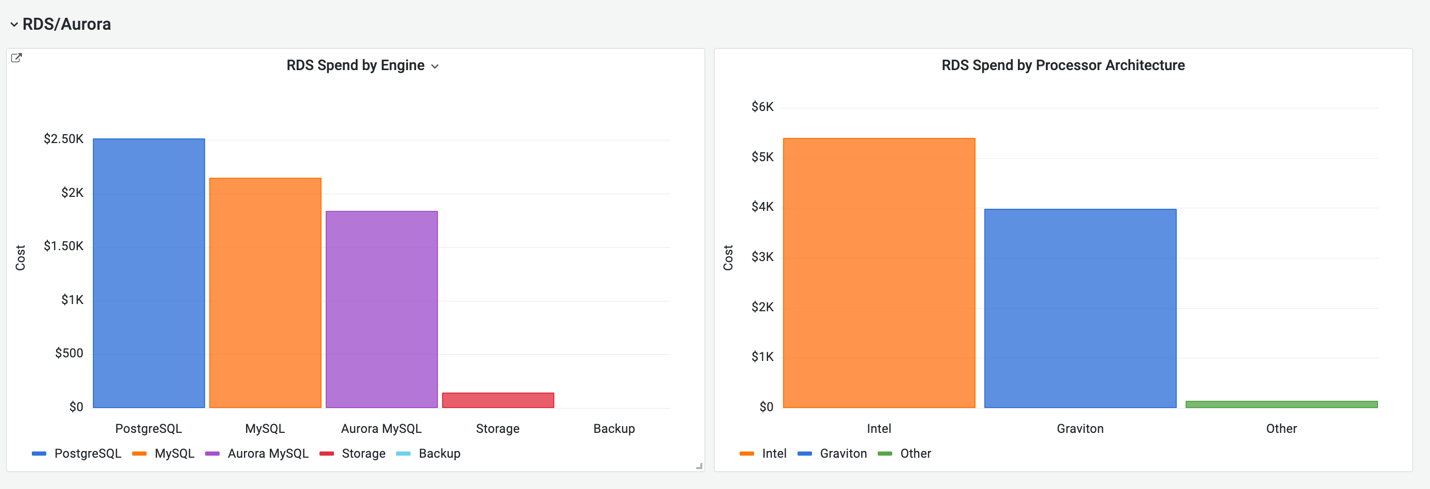
Figure 19. Cost and Usage Report (CURE) dashboard in Amazon Managed Grafana for RDS/Aurora instances
Summary – Overall
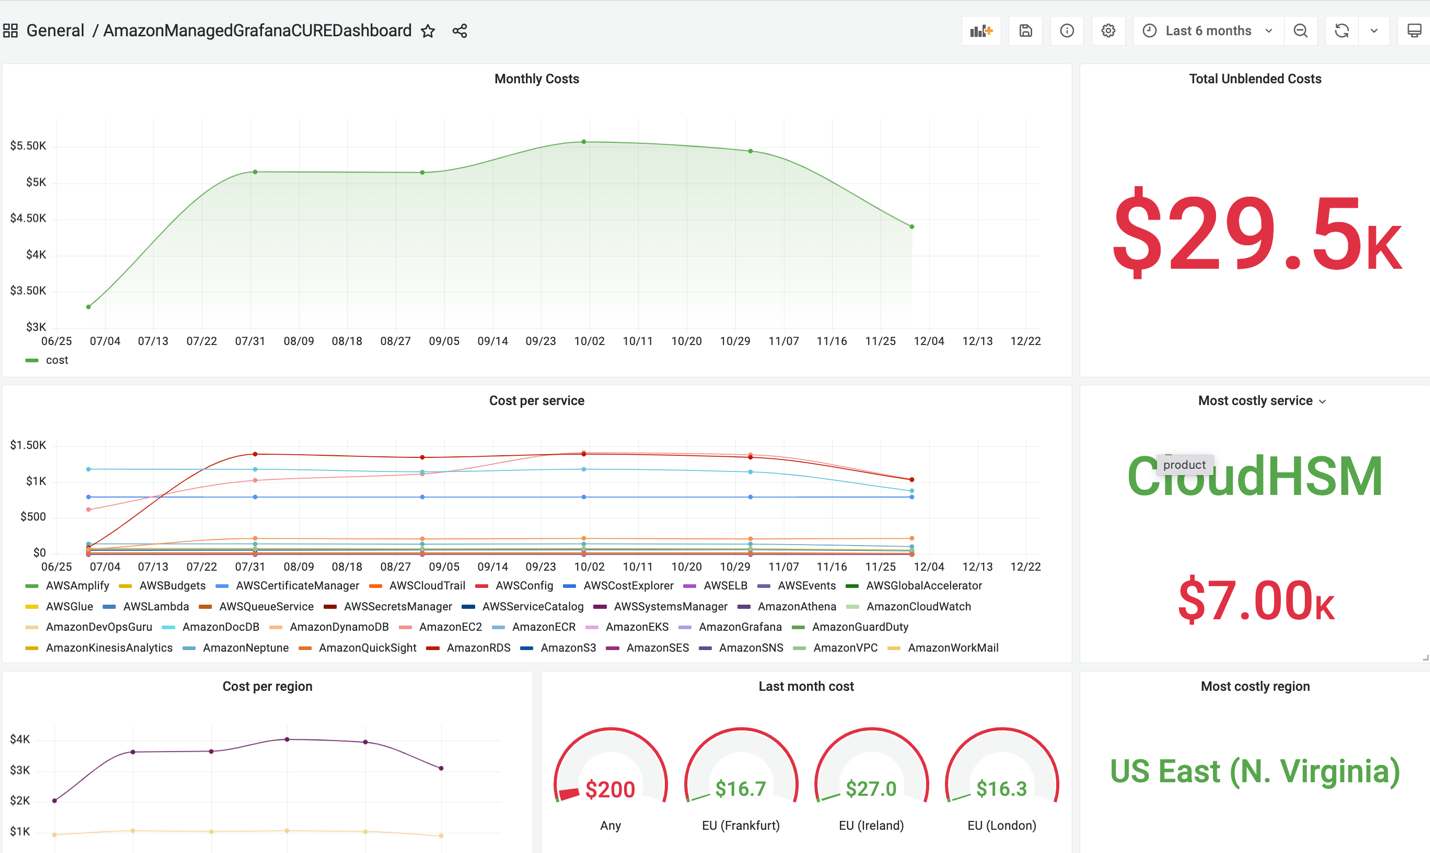
Figure 20. Cost and Usage Report (CURE) dashboard in Amazon Managed Grafana for overall Summary
Clean up
You will continue to incur cost until deleting the infrastructure that you created for this post. Navigate to the Amazon Managed Grafana and S3 console to delete the created Amazon Managed Grafana workspace and the S3 buckets.
Conclusion
In this blog post, we showed how you can visualize and analyze your AWS Cost and Usage report (CUR) data with Amazon Managed Grafana using Amazon Athena plugin. We also showed how you can use your own SQL queries to create and enhance cost and usage Grafana dashboard for your specific business use-case. We also reviewed curated Cost and Usage Report (CURE) dashboard to monitor EC2, Storage, Data Transfer, and RDS/Aurora costs. To see the demo, check out this video Visualize Your AWS Cost and Usage with Amazon Managed Grafana.
For organizations seeking a more comprehensive and automated cost optimization solution with Grafana, we recommend exploring COAST (Cost Optimization and Savings Toolkit for Amazon Managed Grafana), our open-source infrastructure as code (IaC) solution. COAST extends beyond basic cost visualization by offering:
- Single-pane-of-glass view unifying infrastructure, performance, and cost data
- Rapid deployment with pre-configured data sources and dashboards
- Persona-based dashboards tailored for Developers, CloudOps, FinOps, and Executives
- Seamless integration with AWS services and automated CUR analytics
- Fully customizable, open-source framework to meet your organization’s specific needs
You can explore COAST on our GitHub repository, watch the solution demo on YouTube, and find comprehensive implementation guides in our Wiki. COAST helps bridge the gap between operational and financial data, enabling teams to build cost-aware architectures and make informed decisions about their cloud infrastructure.
To get hands-on experience with the AWS observability services, see AWS observability services at One Observability Workshop.
About the authors: