AWS Machine Learning Blog
Designing resilient cities at Arup using Amazon SageMaker geospatial capabilities
This post is co-authored with Richard Alexander and Mark Hallows from Arup.
Arup is a global collective of designers, consultants, and experts dedicated to sustainable development. Data underpins Arup consultancy for clients with world-class collection and analysis providing insight to make an impact.
The solution presented here is to direct decision-making processes for resilient city design. Informing design decisions towards more sustainable choices reduces the overall urban heat islands (UHI) effect and improves quality of life metrics for air quality, water quality, urban acoustics, biodiversity, and thermal comfort. Identifying key areas within an urban environment for intervention allows Arup to provide the best guidance in the industry and create better quality of life for citizens around the planet.
Urban heat islands describe the effect urban areas have on temperature compared to surrounding rural environments. Understanding how UHI affects our cities leads to improved designs that reduce the impact of urban heat on residents. The UHI effect impacts human health, greenhouse gas emissions, and water quality, and leads to increased energy usage. For city authorities, asset owners, and developers, understanding the impact on the population is key to improving quality of life and natural ecosystems. Modeling UHI accurately is a complex challenge, which Arup is now solving with earth observation data and Amazon SageMaker.
This post shows how Arup partnered with AWS to perform earth observation analysis with Amazon SageMaker geospatial capabilities to unlock UHI insights from satellite imagery. SageMaker geospatial capabilities make it easy for data scientists and machine learning (ML) engineers to build, train, and deploy models using geospatial data. SageMaker geospatial capabilities allow you to efficiently transform and enrich large-scale geospatial datasets, accelerate product development and time to insight with pre-trained ML models, and explore model predictions and geospatial data on an interactive map using 3D accelerated graphics and built-in visualization tools.
Overview of solution
The initial solution focuses on London, where during a heatwave in the summer of 2022, the UK Health Security Agency estimated 2,803 excess deaths were caused due to heat. Identifying areas within an urban environment where people may be more vulnerable to the UHI effect allows public services to direct assistance where it will have the greatest impact. This can even be forecast prior to high temperature events, reducing the impact of extreme weather and delivering a positive outcome for city dwellers.
Earth Observation (EO) data was used to perform the analysis at city scale. However, the total size poses challenges with traditional ways of storing, organizing, and querying data for large geographical areas. Arup addressed this challenge by partnering with AWS and using SageMaker geospatial capabilities to enable analysis at a city scale and beyond. As the geographic area grows to larger metropolitan areas like Los Angeles or Tokyo, the more storage and compute for analysis is required. The elasticity of AWS infrastructure is ideal for UHI analyses of urban environments of any size.
The solution: UHeat
Arup used SageMaker to develop UHeat, a digital solution that analyzes huge areas of cities to identify particular buildings, structures, and materials that are causing temperatures to rise. UHeat uses a combination of satellite imagery and open-source climate data to perform the analysis.
A small team at Arup undertook the initial analysis, during which additional data scientists needed to be trained on the SageMaker tooling and workflows. Onboarding data scientists to a new project used to take weeks using in-house tools. This now takes a matter of hours with SageMaker.
The first step of any EO analysis is the collection and preparation of the data. With SageMaker, Arup can access data from a catalog of geospatial data providers, including Sentinel-2 data, which was used for the London analysis. Built-in geospatial dataset access saves weeks of effort otherwise lost to collecting and preparing data from various data providers and vendors. EO imagery is frequently made up of small tiles which, to cover an area the size of London, need to be combined. This is known as a geomosaic, which can be created automatically using the managed geospatial operations in a SageMaker Geomosaic Earth Observation job.
After the EO data for the area of interest is compiled, the key influencing parameters for the analysis can be extracted. For UHI, Arup needed to be able to derive data on parameters for building geometry, building materials, anthropogenic heat sources, and coverage of existing and planned green spaces. Using optical imagery such as Sentinel-2, land cover classes including buildings, roads, water, vegetation cover, bare ground, and the albedo (measure of reflectiveness) of each of these surfaces can be calculated.
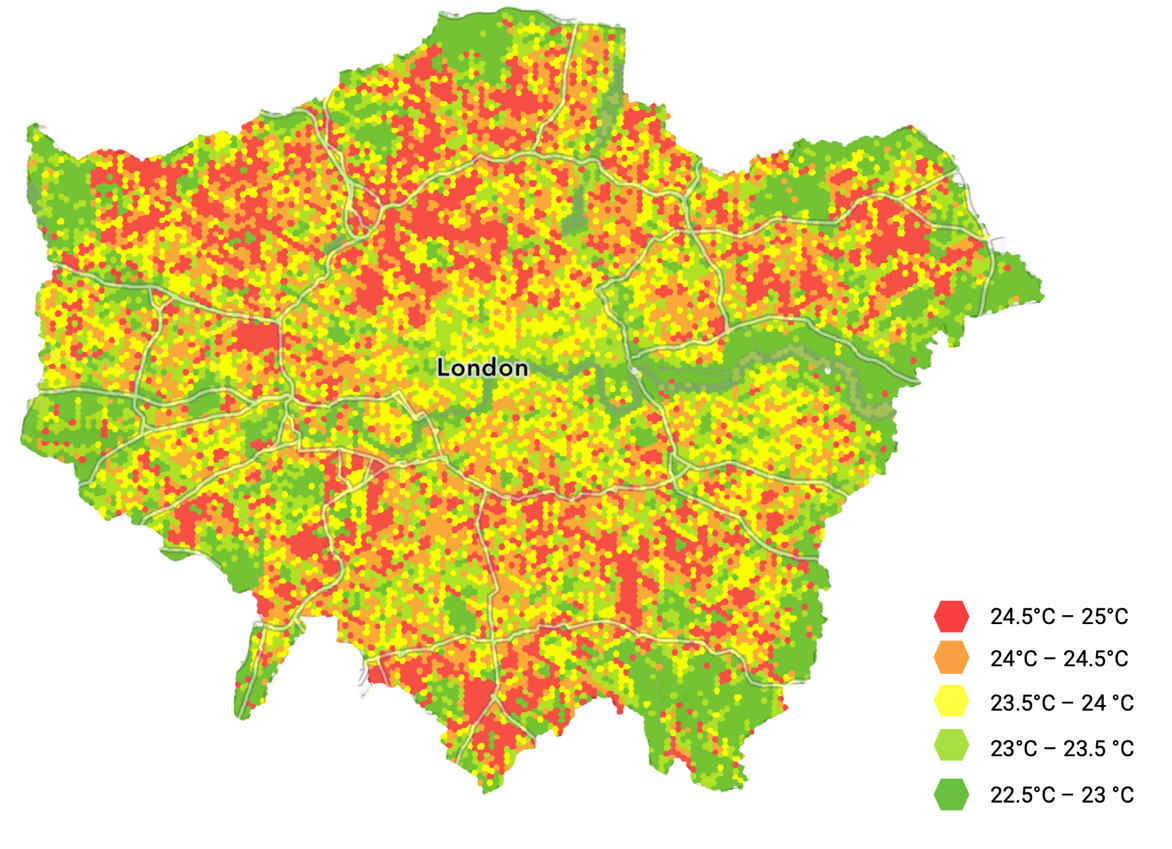
Calculating the values from the different bands in the satellite imagery allows them to be used as inputs into the SUEWS model, which provides a rigorous way of calculating UHI effect. The results of SUEWS are then visualized, in this case with Arup’s existing geospatial data platform. By adjusting values such as the albedo of a specific location, Arup are able to test the effect of mitigation strategies. Albedo performance can be further refined in simulations by modeling different construction materials, cladding, or roofing. Arup found that in one area of London, increasing albedo from 0.1 to 0.9 could decrease ambient temperature by 1.1°C during peak conditions. Over larger areas of interest, this modeling can also be used to forecast the UHI effect alongside climate projections to quantify the scale of the UHI effect.
With historical data from sources such as Sentinel-2, temporal studies can be completed. This enables Arup to visualize the UHI effect during periods of interest, such as the London summer 2022 heatwave. The Urban Heat Snapshot research Arup has completed reveals how the UHI effect is pushing up temperatures in cities like London, Madrid, Mumbai, and Los Angeles.
Collecting data for an area of interest
SageMaker eliminates the complexities in manually collecting data for Earth Observation jobs (EOJs) by providing a catalog of geospatial data providers. As of this writing, USGS Landsat, Sentinel-1, Copernicus DEM, NAIP: National Agriculture Imagery Program, and Sentinel-2 data is available directly from the catalog. You can also bring your own Planet Labs data when imagery at a higher resolution and frequency is required. Built-in geospatial dataset access saves weeks of effort otherwise lost to collecting data from various data providers and vendors. Coordinates for the polygon area of interest need to be provided as well as the time range for when EO imagery was collected.
Arup’s next step was to combine these images into a larger single raster covering the entire area of interest. This is known as mosaicking and is supported by passing GeoMosaicConfig to the SageMaker StartEarthObservationJob API.
We have provided some code samples representative of the steps Arup took:
This can take a while to complete. You can check the status of your jobs like so:
Resampling
Next, the raster is resampled to normalize the pixel size across the collected images. You can use ResamplingConfig to achieve this by providing the value of the length of a side of the pixel:
Determining coverage
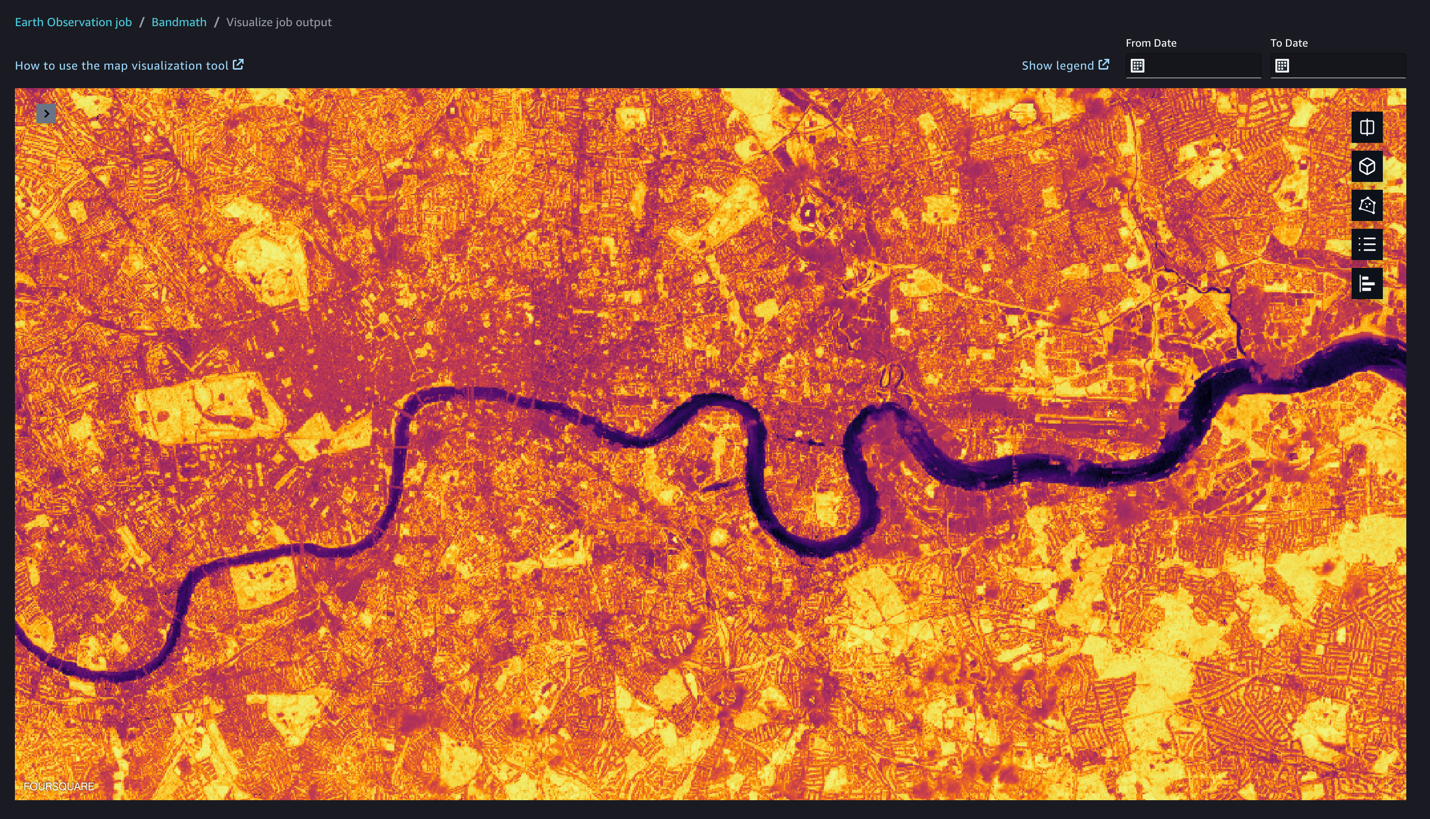
Determining land coverage such as vegetation is possible by applying a normalized difference vegetation index (NDVI). In practice, this can be calculated from the intensity of reflected red and near-infrared light. To apply such a calculation to EO data within SageMaker, the BandMathConfig can be supplied to the StartEarthObservationJob API:
We can visualize the result of the band math job output within the SageMaker geospatial capabilities visualization tool. SageMaker geospatial capabilities can help you overlay model predictions on a base map and provide layered visualization to make collaboration easier. The GPU-powered interactive visualizer and Python notebooks provide a seamless way to explore millions of data points in a single window as well as collaborate on the insights and results.
Preparing for visualization
As a final step, Arup prepares the various bands and calculated bands for visualization by combining them into a single GeoTIFF. For band stacking, SageMaker EOJs can be passed the StackConfig object, where the output resolution can be set based on the resolutions of the input images:
Finally, the output GeoTIFF can be stored for later use in Amazon Simple Storage Service (Amazon S3) or visualized using SageMaker geospatial capabilities. By storing the output in Amazon S3, Arup can use the analysis in new projects and incorporate the data into new inference jobs. In Arup’s case, they used the processed GeoTIFF in their existing geographic information system visualization tooling to produce visualizations consistent with their product design themes.
Conclusion
By utilizing the native functionality of SageMaker, Arup was able to conduct an analysis of UHI effect at city scale, which previously took weeks, in a few hours. This helps Arup enable their own clients to meet their sustainability targets faster and narrows the areas of focus where UHI effect mitigation strategies should be applied, saving precious resources and optimizing mitigation tactics. The analysis can also be integrated into future earth observation tooling as part of larger risk analysis projects, and helps Arup’s customers forecast the effect of UHI in different scenarios.
Companies such as Arup are unlocking sustainability through the cloud with earth observation data. Unlock the possibilities of earth observation data in your sustainability projects by exploring the SageMaker geospatial capabilities on the SageMaker console today. To find out more, refer to Amazon SageMaker geospatial capabilities, or get hands on with a guidance solution.
About the Authors
 Richard Alexander is an Associate Geospatial Data Scientist at Arup, based in Bristol. He has a proven track record of building successful teams and leading and delivering earth observation and data science-related projects across multiple environmental sectors.
 Mark Hallows is a Remote Sensing Specialist at Arup, based in London. Mark provides expertise in earth observation and geospatial data analysis to a broad range of clients and delivers insights and thought leadership using both traditional machine learning and deep learning techniques.
 Thomas Attree is a Senior Solutions Architect at Amazon Web Services based in London. Thomas currently helps customers in the power and utilities industry and applies his passion for sustainability to help customers architect applications for energy efficiency, as well as advise on using cloud technology to empower sustainability projects.
 Tamara Herbert is a Senior Application Developer with AWS Professional Services in the UK. She specializes in building modern and scalable applications for a wide variety of customers, currently focusing on those within the public sector. She is actively involved in building solutions and driving conversations that enable organizations to meet their sustainability goals both in and through the cloud.
 Anirudh Viswanathan – is a Sr Product Manager, Technical – External Services with the SageMaker geospatial ML team. He holds a Masters in Robotics from Carnegie Mellon University and an MBA from the Wharton School of Business, and is named inventor on over 50 patents. He enjoys long-distance running, visiting art galleries, and Broadway shows.