With a microservices architecture, distributed teams often need a central operational excellence team to make sure that the rest of the organization is following operational best practices.
For example, you might want to know if you configured lifecycle policy, versioning, and access policies properly for objects in an Amazon S3 bucket. Proper configurations ensure that you have the desired retention and deletion policies, and avoids accidental sharing of Amazon S3 objects.
Similarly, you might want to know whether teams have enabled Amazon DynamoDB auto scaling in their tables. Doing so increases throughput capacity (read and write capacity units) to handle increased traffic seamlessly, and lowers the throughput capacity when workloads decrease. This scaling means that you pay for the right amount of provisioned capacity. Finally, you might want to make sure that you configured Amazon CloudWatch alarms on your DynamoDB tables (or other AWS resources) for effective and automated response.
AWS provides services such as Amazon CloudWatch, AWS CloudTrail, AWS Config, and AWS Trusted Advisor to enable operational auditing. This blog post covers how you can use AWS Lambda and APIs provided by different AWS services to automate the auditing of your operational best practices.
Solution overview
In this post, you create an AWS Identity and Access Management (IAM) role for your Lambda function and use the DynamoDB API to review DynamoDB tables and indexes for different rules. You also set up automated notifications to let you know if your settings violate any of those rules. You can extend this solution to add more rules, or you can modify the solution to audit AWS services for operational best practices. The code in this post shows how to:
- Check the current AWS account limit for your DynamoDB tables.
- Calculate your total provisioned throughput—tables plus global secondary indexes (GSIs)—and warn you if it is greater than x percent of your AWS account limit.
- Calculate the provisioned throughput for each table and warn you if it’s greater than x percent of the table-maximum limit for your account.
- Check the provisioned throughput of each GSI and warn you if it is x percent less than the throughput of the table.
- Check whether you configured CloudWatch alarms for the following DynamoDB metrics logged by CloudWatch:
ConsumedReadCapacityUnits, ConsumedWriteCapacityUnits, ReadThrottleEvents, WriteThrottleEvents, and ThrottledRequests.
- Calculate the total number of warnings, and optionally write those warnings as a custom metric to CloudWatch.
Create an IAM role for your Lambda function
To get started, create an IAM role and attach it to an existing or new custom policy to have permissions for dynamodb and cloudwatch, as shown in the following policy:
{
    "Version": "2012-10-17",
    "Statement": [
        {
            "Action": [
                "dynamodb:DescribeLimits",
                "dynamodb:ListTables",
                "dynamodb:DescribeTable",
                "cloudwatch:putMetricData",
                "cloudwatch:DescribeAlarmHistory",
                "cloudwatch:DescribeAlarms",
                "cloudwatch:DescribeAlarmsForMetric",
   "logs:*"
            ],
            "Effect": "Allow",
            "Resource": "*"
        }
    ]
}
Create and configure your Lambda function
Next, create and configure a Lambda function:
- In the Lambda console, choose Create function.
- Under the Create function step, choose Author from scratch.
- Under Basic information, add the following information:
- Name: AWSAccountAudit
- Runtime: Python 3.6
- Role: Choose an existing role
- Existing role: Choose the IAM role that you created in the previous section
- Choose Create function.
- Under Function code, do the following:
- Leave Code entry type, Runtime, and Handler at their default values.
- Replace the existing code in the text box with the preceding code block.
import boto3
import json
import logging
from datetime import datetime

def lambda_handler(event, context):

    settings = Settings()

    #Set region
    region = 'us-east-1'
    if settings.region:
        region = settings.region

    #Init Clients
    dynamoDBClient = boto3.client('dynamodb', region_name=region)
    cloudWatchClient = boto3.client('cloudwatch', region_name=region)

    #New account object
    account = Account()

    #Get account limits
    account_limits(dynamoDBClient, account)

    #Get details for all tables in account
    account_tables(dynamoDBClient, cloudWatchClient, account, settings)

    #Analyse account object, print report and generate number of warnings
    warnings = generateReport(account, settings)

    #Add warnings as custom cloud watch metric if enabled in settings
    if(settings.addCustomMetric == 1):
        addWarningAsCustomCloudWatchMetric(cloudWatchClient, settings, warnings)

    #Print warning count
    message = str(warnings) + ' warning(s) found. View Log output below or go to CloudWatch log group to see detailed report.'

    return message

##############################################
#Add warning count as custom cloud watch metric
def addWarningAsCustomCloudWatchMetric(cloudWatchClient, settings, warnings):
    #Add custom metric to CloudWatch if enabled in settings
    cloudWatchClient.put_metric_data(
    Namespace=settings.customMetricNamespace,
    MetricData=[
        {
            'MetricName': settings.customMetricName,
            'Value': warnings,
            },
            ]
        )

##############################################
# Analyse account and generate report
def generateReport(account, settings):
    warnings = 0

    print('DynamoDB analysis report...')
    #Print Limits and Provisioned Capacity
    print('- TableMaxReadCapacityUnits=%s,\t TableMaxWriteCapacityUnits=%s' % (account.tableRcuLimit , account.tableRcuLimit))
    print('- AccountMaxReadCapacityUnits=%s,\t AccountMaxWriteCapacityUnits=%s' % (account.accountRcuLimit, account.accountWcuLimit))
    print('- ProvisionedRcu=%s,\t ProvisionedWcu=%s' % (account.provisionedRcu, account.provisionedWcu))

    #Warn on RCU account limit alert
    if(account.provisionedRcu >= (settings.accountLimitAlertLevel/100.0)*account.accountRcuLimit):
        print('\tRCU Limit Alert! Current provisioned RCU (%s) is %s %% of current account limit of %s. You have set warning threshold to %s%%.' % \
        (account.provisionedRcu, (100.0*account.provisionedRcu/account.accountRcuLimit), account.accountRcuLimit, settings.accountLimitAlertLevel))
        warnings += 1

    #Warn on WCU account limit alert
    if(account.provisionedWcu >= (settings.accountLimitAlertLevel/100.0)*account.accountWcuLimit):
        print('\tWCU Limit Alert! Current provisioned WCU (%s) is %s %% of current account limit of %s. You have set warning threshold to %s%%.' % \
        (account.provisionedWcu, (100.0*account.provisionedWcu/account.accountWcuLimit), account.accountWcuLimit, settings.accountLimitAlertLevel))
        warnings += 1

    for table in account.tables:
        print('- Table=%s, Rcu=%s, Wcu=%s' % (table.name, table.rcu, table.wcu))

        #Table RCU Warnings
        if(table.totalRcu >= (settings.accountLimitAlertLevel/100.0)*account.tableRcuLimit):
            print('\tRCU Limit Alert! Current provisioned RCU (%s) of table is %s %% of current table-max account limit of %s. You set warning threshold to %s%%.' % \
            (table.totalRcu, (100.0*table.totalRcu/account.tableRcuLimit), account.tableRcuLimit, settings.accountLimitAlertLevel))
            warnings += 1

        #Table WCU Warnings
        if(table.totalWcu >= (settings.accountLimitAlertLevel/100.0)*account.tableWcuLimit):
            print('\tWCU Limit Alert! Current provisioned WCU (%s) of table is %s %% of current table-max account limit of %s. You set warning threshold to %s%%.' % \
            (table.totalWcu, (100.0*table.totalWcu/account.tableWcuLimit), account.tableWcuLimit, settings.accountLimitAlertLevel))
            warnings += 1

        #GSI Warnings
        for gsi in table.gsi:
            if(gsi.gsiWarning == 1):
                print('\tGSI Warning! GSI %s has Wcu=%s while table has Wcu=%s. If there is not enough Wcu provisioned for GSI it can throttle table.' % \
                (gsi.name, gsi.wcu, table.wcu))
                warnings += 1

        #CloudWatch Alarm Warnings
        for cwm in table.cloudWatchMetrics:
            if(len(cwm.cloudWatchAlarms) == 0):
                print('\tCloudWatch Warning! %s has no CloudWatch Alarms configured.' % cwm.name)
                warnings += 1
            else:
                for cwa in cwm.cloudWatchAlarms:
                    if(cwa.hasActionsEnabled == 0):
                        print('\tCloudWatch Warning! alarm %s for metric %s has no action configured.' % (cwa.name, cwm.name))
                        warnings += 1

    return warnings

##############################################
#Get limits
def account_limits(client, account):
    response = client.describe_limits()
    account.tableRcuLimit = response.get('TableMaxReadCapacityUnits')
    account.tableWcuLimit  = response.get('TableMaxWriteCapacityUnits')
    account.accountRcuLimit = response.get('AccountMaxReadCapacityUnits')
    account.accountWcuLimit = response.get('AccountMaxWriteCapacityUnits')

##############################################
#Get tables
def account_tables(client, cloudWatchClient, account, settings):
    response = client.list_tables()
    tables = response.get('TableNames')

    for table in tables:
        odt = DynamoDBTable()
        analyse_table(client, cloudWatchClient, table, odt, settings)

        account.provisionedRcu += odt.totalRcu
        account.provisionedWcu += odt.totalWcu

        account.tables.append(odt)

##############################################
#Analyse tables and nested objects of each table
def analyse_table(client, cloudWatchClient, tableName, table, settings):
    response = client.describe_table(TableName=tableName)
    json.dumps(response, default=date_handler)
    table.name = tableName
    table.totalRcu = table.rcu = response['Table']['ProvisionedThroughput']['ReadCapacityUnits']
    table.totalWcu = table.wcu = response['Table']['ProvisionedThroughput']['WriteCapacityUnits']
    if('GlobalSecondaryIndexes' in response['Table']):
        gsis = response['Table']['GlobalSecondaryIndexes']
        for gsi in gsis:
            ogsi = DynamoDBGsi()
            ogsi.name = gsi['IndexName']
            ogsi.rcu = gsi['ProvisionedThroughput']['ReadCapacityUnits']
            ogsi.wcu = gsi['ProvisionedThroughput']['WriteCapacityUnits']
            table.totalRcu += ogsi.rcu
            table.totalWcu += ogsi.wcu
            if(ogsi.wcu != table.wcu and ogsi.wcu < ((settings.gsiThroughputAlertLevel/100.0)*table.wcu)):
                ogsi.gsiWarning = 1
                ogsi.gsiWarningDiff = table.wcu - ogsi.wcu
                table.gsiWarning = 1
            table.gsi.append(ogsi)

    checkCloudWatchAlarmsForTable(table, cloudWatchClient)

##############################################
#Check CloudWatchAlarms for Table
def checkCloudWatchAlarmsForTable(table, cloudWatchClient):
    checkCloudWatchAlarmForMetric(cloudWatchClient, table, 'ConsumedReadCapacityUnits')
    checkCloudWatchAlarmForMetric(cloudWatchClient, table, 'ConsumedWriteCapacityUnits')
    checkCloudWatchAlarmForMetric(cloudWatchClient, table, 'ReadThrottleEvents')
    checkCloudWatchAlarmForMetric(cloudWatchClient, table, 'WriteThrottleEvents')
    checkCloudWatchAlarmForMetric(cloudWatchClient, table, 'ThrottledRequests')

#Check CloudWatchAlarms for each metric
def checkCloudWatchAlarmForMetric(client, table, metricName):
    response = client.describe_alarms_for_metric(
    Namespace='AWS/DynamoDB',
    MetricName = metricName,
    Dimensions=[
        {
            'Name': 'TableName',
            'Value': table.name
        },
        ]
    )

    cloudWatchMetric = CloudWatchMetric()
    cloudWatchMetric.name = metricName

    metricAlarm = response.get('MetricAlarms')
    metricAlarmCount = len(metricAlarm)

    #Check if each alarm is properly configured
    if(metricAlarmCount > 0) :
        for m in range(0, metricAlarmCount) :
            cwAlarm = CloudWatchAlarm()
            cwAlarm.name = response.get('MetricAlarms')[m].get('AlarmName')
            if(response.get('MetricAlarms')[m].get('ActionsEnabled') == True):
                cwAlarm.hasActionsEnabled = 1
            cloudWatchMetric.cloudWatchAlarms.append(cwAlarm);

    table.cloudWatchMetrics.append(cloudWatchMetric)

##############################################
def date_handler(obj):
    if hasattr(obj, 'isoformat'):
        return obj.isoformat()
    else:
        raise TypeError

############ Class definitions #################

class Account:
    tableRcuLimit = 0
    tableWcuLimit = 0
    accountRcuLimit = 0
    accountWcuLimit = 0
    provisionedRcu = 0
    provisionedWcu = 0

    def __init__(self):
        self.tables = []

class DynamoDBTable:
    name = ''
    rcu = 0
    wcu = 0
    totalRcu = 0
    totalWcu = 0
    gsiWarning = 0

    def __init__(self):
        self.gsi = []
        self.cloudWatchMetrics = []

class CloudWatchMetric:
    name = ''

    def __init__(self):
        self.cloudWatchAlarms = []

class CloudWatchAlarm:
    name = ''
    hasActionsEnabled = 0

class DynamoDBGsi:
    name = ''
    rcu = 0
    wcu = 0
    gsiWarning = 0
    gsiWarningDiff = 0

class Settings:
    #AWS region
    region = 'us-west-2'
    #Generate warning if provisioned throughput is more than x% of account limit
    accountLimitAlertLevel = 50
    #Generate warning GSI has throughput less than x% of the table's throughput
    gsiThroughputAlertLevel = 50
    #Add warnings to CloudWatch as custom metric
    addCustomMetric = 0
    customMetricNamespace = 'kashif'
    customMetricName = 'DynamoDBAuditWarnings'
- Under Basic settings, update the following:
- Memory (MB): Leave the default setting (128)
- Timeout: 5 min
- Choose Save to save changes.
- Under Configuration and Add triggers, choose CloudWatch Events from the list of available options.
- Under Rule, choose Create a new rule, and then fill in the following information:
- Rule name: AWS-DynamoDB-Daily-Audit
- Rule description: Daily audit of DynamoDB tables for operational best practices
- Rule type: Scheduled expression
- Schedule expression: Rate(1 day). You can choose a different frequency depending on how often you want to audit your AWS account.
- Choose Add to add a trigger for your Lambda function.
- Choose Test and under Configure test events, leave Create new test event and the Hello World Event Template. Type the event name,
AWSAccountAuditTest, and choose Create.
- Choose Test to execute the Lambda function.
Under Execution result, you can see the number of warnings that result from this script.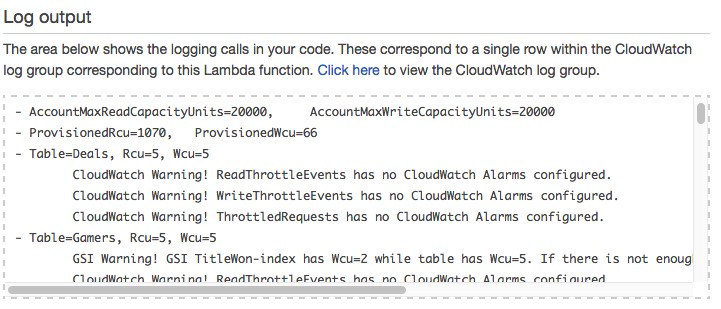 You can view the output details under Log output. If there are a lot of warnings, they all might not appear in the Log output area. To get the complete output results of the function, choose the Click here link to view the CloudWatch log group under Log output.
 You can provide different parameters for the code in the Lambda function, including the AWS Region and thresholds for which warnings should be generated. The following code block shows how to provide these parameters.
#AWS Region
region = 'us-west-2'

#Generate warning if provisioned throughput is more than x% of account limit
accountLimitAlertLevel = 50
#Generate warning that GSI has throughput less than x% of the table's throughput
gsiThroughputAlertLevel = 50
#Add warnings to CloudWatch as custom metric
addCustomMetric = 0
customMetricNamespace = 'kashii'
customMetricName = 'DynamoDBAuditWarnings'
Summary
By automating the auditing of your DynamoDB tables, you can help make sure that operational best practices are being followed, and that you have automated monitoring and notifications in place.
You can always add more rules. For example, you can randomly read a few items from each table to understand how large each item is in the table. If very large items are being stored, the audit can recommend, for example, that you use Amazon S3 to store large objects. The audit also might recommend using DynamoDB to store key metadata, along with links to the objects in Amazon S3. You can also extend the Lambda function shown in this post by using APIs for other AWS services to make sure that you are following operational best practices for those AWS services.
About the Author
 Kashif Imran is a solutions architect at Amazon Web Services. He works with the AWS customers to provide technical guidance and design advice. His expertise spans application architecture, serverless, containers, NoSQL and machine learning.