AWS for M&E Blog
Quick and easy Media Services Dashboards
New users to the AWS Media Services often find the wide assortment of metrics available to be confusing. Users often ask which metrics are most meaningful, how they can make the metrics easily viewed in a chart, and how to view metrics from multiple services on a single Dashboard.
Additionally, customers new to AWS may not have the time or expertise to build useful Amazon CloudWatch Dashboards. To help customers better monitor their Media Service workflows, we created a set of fast and simple self-service scripts that make it easy to generate CloudWatch Dashboards. These Dashboards provide reliable confidence monitoring and error intelligence for critical real-time content. These self-contained, self-service scripts allow users to easily create a new Dashboard for the relevant services in approximately 15 seconds.
There is a second audience for these quick setup tools: Experienced users of AWS Media Services who are on short deadlines for a special live event, and require event-specific Dashboards to track multiple services participating in this upcoming event.
Self-service scripts for on-demand Dashboard creation
This new collection of scripts work by querying the desired service using the AWS Command Line Interface (AWS CLI) or AWS CloudShell prompt, asking for optional name filters, then assembling a new CloudWatch Dashboard using the top four or five most useful metrics for a given service (as defined by the AWS platform engineering teams). Users can quickly invoke these scripts to create useful Dashboards, and then optionally customize them from the CloudWatch Console as needed.
Users can optionally focus each Dashboard on just one resource (such as a single AWS Elemental MediaPackage Channel), OR users can tag a subset of their resources (for example, only the two AWS Elemental MediaLive inputs and the correlating MediaPackage channel being used for a live stream event). This process requires the user to tag the resources individually using the AWS Management Console or the AWS CLI. Then, when you run the script, select the “[t]agged” option to create a Dashboard with only the tagged resources.
The included “Dashboard Joiner” script allows users to aggregate service-specific widgets into a multi-service Dashboard representing each step in a multi-service workflow.
The following is a typical result. This 3-service Dashboard with 11 widgets took less than a minute to create using these scripts.
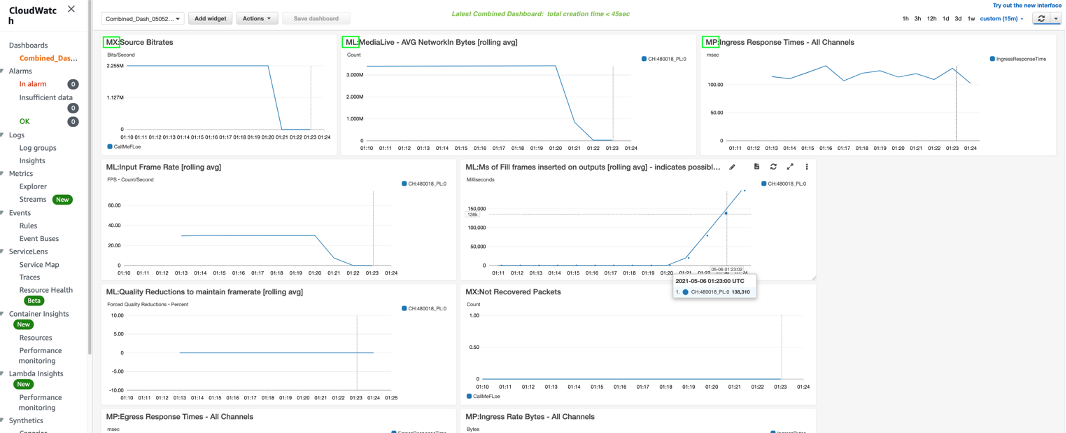
Image of Dashboard with widgets from multiple AWS services
Using the scripts
Pre-Requisites
- The scripts require access to the AWS CLI to poll the service details. If you do not have access to a local computer with AWS CLI installed, you can also run these scripts from the AWS CloudShell prompt within your AWS Management Console.
- The scripts need be in your local directory. You download a zip file containing all the scripts from this link, or from a CloudShell/AWS CLI prompt using a command of the form:
wget https://dlcc9uvp8v2in.cloudfront.net/LATEST.zip && unzip *.zip
Using the Scripts
To make a new Dashboard for AWS Elemental MediaLive inputs:
- Run the command python3 EML_Inputs_dash_maker_v12
- The script prompts you to choose to include [a]ll channels, only [t]agged channels, or a [s]ingle channel. Press “a”, “t” or “s” according to your desired result.
- Enter any secondary information per the prompts.
- The script generates a JSON file and then uploads it to create the new CloudWatch Dashboard. The JSON file mentioned previously is saved locally, so that you can optionally join several JSON files together to create a multi-service Dashboard.
- (Optional) Run the command ‘python3 DashJoin_v3.py’ to join several Dashboard files and create a new Dashboard containing the combined metrics.
Note on tagging resources: most AWS services allow you to tag individual resources (an input, or a channel) from the AWS Management Console. Other services (including MediaPackage) require a CLI command to tag a resource. Refer to the ‘tag-resource’ sub-command within the service of interest for more details.
Next Steps
- You may further customize the Dashboards using the CloudWatch console, to change timeframes, colors, or other chart properties. Dashboards may also be exported, renamed, and deleted from the CloudWatch console.
- You may optionally set alarm thresholds for each widget, so that when a value drops below a safe threshold, you are automatically notified. See Using Amazon CloudWatch alarms for more information.
Conclusion
These simple scripts can easily and rapidly create useful monitoring Dashboards for a variety of user workflows leveraging the AWS Elemental media services. These tools provide insight, confidence monitoring and diagnostic help when troubleshooting complex workflows. AWS encourages customers to explore Amazon CloudWatch Dashboards as a means of efficiently and proactively monitoring service health and performance
If you have questions, feedback, or would like to get involved in discussions with other community members, visit the AWS Developer Forums: Media Services.