AWS Partner Network (APN) Blog
Empowering Organizations with Better Revenue Analysis Using SAP Data on AWS
By Alexander Giovani Koisine, Big Data Presales Consultant – Metrodata Electronics
By Vicko Bhayyu, Big Data Technical Consultant – Metrodata Electronics
By Arif Nanda Atmavidya, Big Data Technical Consultant – Metrodata Electronics
By Lalit Mangla, Sr. Partner Solution Architect – AWS
 |
| Metrodata |
 |
In today’s business world, many organizations stay on track and achieve objectives by conducting a constructive analysis of strengths and weaknesses. There are many areas that require special attention to achieve a company’s goals and objectives, including the revenue stream or company profits tracking.
Revenue and profitability analysis are not easy tasks, however. The analysis determines many factors such as product or production costs and which areas or divisions require revenue and profitability analysis.
Revenue in this context can refer to overall business revenue, sales or turnover, or just plain money. Revenue analysis can ensure the company’s plans and strategies do not deviate or are in accordance with other objectives that have been prepared, such as expansion and research and development (R&D).
Metrodata Electronics is an AWS Advanced Tier Services Partner and veteran systems integrator in Indonesia since 1975. Metrodata is committed to providing comprehensive and innovative cloud solution offerings for organizations in the Indonesian market. Offerings include cloud computing solutions, business and technical consulting, data center assessment, migration, implementation, and managed services.
The digital opportunity in Indonesia is huge, as almost every company uses enterprise software like SAP to digitalize their business and achieve better governance. SAP supports enterprise customers with better business process management, such as purchasing analysis and stock management, financial analysis, sales and customer service analysis, and production analysis.
In this post, we will explore why Metrodata chose Amazon Web Services (AWS) as a trusted platform to build SAP analytics offerings such as revenue and profitability analysis. These offerings empower customers to make business decisions quickly and effectively to expand in new market opportunities and focus on key growth areas.
Technical Architecture
Metrodata’s solution architecture aims for easy access and a reliable, durable, and secure platform so customers no longer need to think about problems that may arise due to limited storage and lack of computing capabilities. With AWS providing flexible and high availability serverless services, the solution is built for accelerated data analysis development and can be applied immediately with minimal efforts.
Revenue analysis allows businesses to see how sales are performing in comparison to previous years. It can also provide answers to key questions related to your business:
- Comparing revenue with different years.
- Which product are the main revenue drivers?
- Showing and analyze actual vs. planned revenue (yearly/monthly).
Figure 1 – High-level end-to-end architecture.
The architecture begins with the integration of multiple platforms capable of automatic data transfer at a massive scale. Data originating from SAP can be integrated with Amazon AppFlow with support for incremental data retrieval, while other data source such as databases and APIs can be integrated with a combination of AWS services such as AWS Database Migration Service (AWS DMS), AWS Glue, or Amazon Kinesis.
All of this data will eventually lead to Amazon Simple Storage Service (Amazon S3), which functions as a centralized data lake that has myriad advantages such as cost-efficiency, durability, data availability, and security.
The data lake will be integrated with AWS Lake Formation, which helps in the process of building, protecting, and managing data lakes by implementing a centralized access control concept. It operates from the table, column, to row level for all services and users who access the data.
Not all data that’s stored in S3 is ready to be consumed; for example, data that comes from many platforms that have different structures. Therefore, data transformation will be needed and AWS Glue or Amazon EMR can help in the process of transforming this into data that’s ready to be consumed, or will be forwarded to Amazon SageMaker to meet business needs requiring a deep level of modeling assistance.
Data that’s ready for consumption is forwarded to Amazon Redshift following the data warehouse requirements to analyze data from terabytes to petabytes.
The data that has met these business needs will be translated into an image with an attractive, easy-to-understand, compare and present so it can assist in accelerating decision making.
Amazon QuickSight is a serverless, high-availability interactive data visualization service. You can integrate QuickSight dashboard objects into application services that have been created. QuickSight enables collaboration of end users, business analysts, developers, and admins, with the same goal of making the decision-making process fast, precise, and efficient.
Amazon AppFlow provides fully-managed integration services that allow automatic data transfer at massive scale, securely from SAP, other data sources, and SAP and non-SAP software-as-a-service (SaaS) applications.
AWS Glue provides serverless data integration services that allow you to “cook” by preparing and combining, enriching, and organizing data for further analytics. Combining it with Apache Hudi, Glue improves data quality and simplifies incremental processing that requires updates and deletes. Datasets that are managed by Hudi are stored in Amazon S3 in an open format for most services easy to integrate with.
Customer Revenue Analysis
A customer profitability analysis explains how much revenue a particular customer generates for the business. It compares the costs of acquiring and retaining customers with the profits generated from them. This analysis helps organizations focus on various business aspects, from the sales process and product development to customer segments and priorities to expand a customer success team.
Actual and Planned
Actual and planned are financial reviews and adjustments based on financial results. During this process, a company will review actions during the period to better contextualize the results. Another term is variance analysis.

Figure 2 – Revenue (actual vs. planned).
Revenue Trends
In the example below, the revenue trend shows the company’s total revenue on yearly and monthly basis. Total revenue can be distinguished by the high or low graph of each period.
Figure 3 – Total revenue by year and month.
Growth Analysis
Growth analysis is carried out with the intent or purpose of identifying business growth patterns. This will be addressed through the implementation of targeted business solutions to areas of concentration to help stimulate better growth.
This analysis examines various business units, such as the company’s product offerings, marketing techniques, environmental studies, human resources, customer service practices, consumer studies, and competition studies.
In the example below, revenue growth shows a comparison of the company’s total revenue as a percentage with the previous year, and the percentage increase in the number of company customers with the previous year.
Figure 4 – Revenue and customer growth.
Revenue by Customer
Customer analysis combines qualitative and quantitative research methods with the goal of better understanding your customer base. Knowing what makes customers tick means you’ll be able to cater to their specific needs.
It’s a tide that lifts all boats—marketing can create campaigns with better wording, sales can come up with better pitches, and product development will know what features to prioritize.
 Figure 5 – Revenue by customer.
Product Analysis
Product analysis is the process of gathering, defining, and analyzing data about a product or service to make better decisions. To create the product offerings that fits the market requirements, as a product/service owner you need to have a clear understanding of what those needs are.
Through the product analysis, organizations would be able to understand the unique selling proposition, marketing requirements, and competitive analysis that is working well, and how they can work backwards from the customer requirements to make successful offerings to capture market share.
Revenue by Product
Based on the following chart, revenue can be filtered by product type and which products are popular and generate the most company revenue in a certain period (yearly/monthly).
In addition, the analysis can be done to see revenue based on divisions or departments in a company. Thus, the company can make small changes to the sales design and maintain product quality. It’s an extensive process, but the results can help businesses in manufacturing, quality assurance, logistics, and sales.
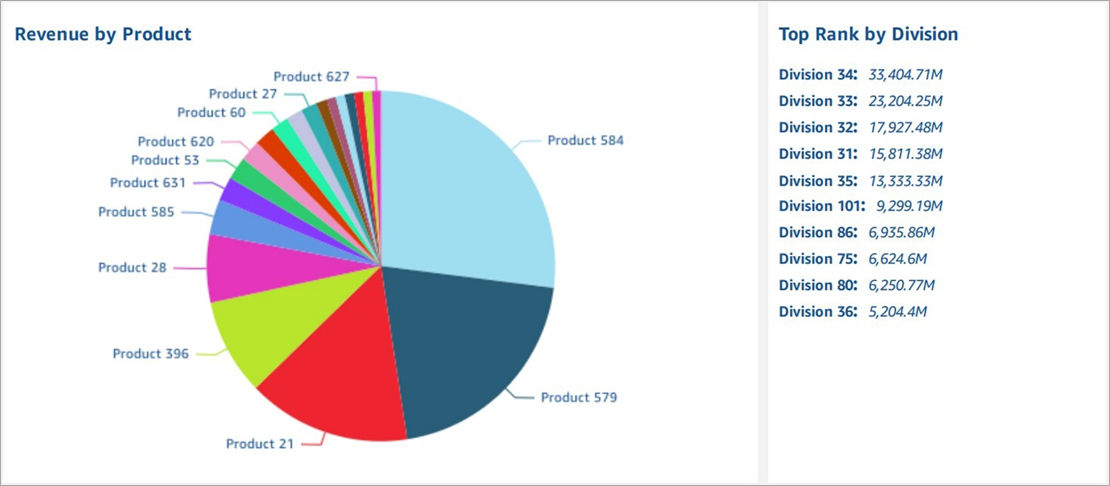
Figure 6 – Revenue by product and division.
Metrics for Success
The process of visualizing revenue analytics using business intelligence (BI) tools on top of cloud analytics platforms help enterprises monitor and analyze high-level revenue performance. Leveraging cloud platforms improves performance faster without having to think about infrastructure availability.
When used as part of good business practice in the financial planning and analysis (FP&A) department, companies can improve their executive insight and reduce the chances of missing important trends, compared to only studying revenue pattern through financial reports.
With AWS, you can flexibly secure the necessary resources so it’s possible to respond quickly and safely when adjusting the scale. This means it’s easy to reduce costs, improve security and process authority.
In addition, as stable and less-hassle service operations become possible, better analysis results can be achieved by focusing on business factors instead of infrastructure factors.
Conclusion
In the world of analytics, speed is key because the value of data depreciates with time. Besides speed, organizations also need to have agility and scalability to be able to scale their analytics workloads according to their business context and challenges.
This is where AWS data and analytics offerings become a vital asset to any organization. Companies get complete, out-of-the-box native solutions designed to accelerate time to insight and increase the agility of their business. AWS provides an end-to-end platform and services catalog that unifies data ingestion, big data analytics, and data warehousing.
Today’s significant economic and health challenges can be turned into growth opportunities with great leadership, a clear vision, and intelligent data analytics. Empowering teams with the right tools is critical to ensure they can collaborate, discover, and innovate.
.

.
Metrodata – AWS Partner Spotlight
Metrodata Electronics is an AWS Advanced Tier Services Partner and veteran systems integrator in Indonesia since 1975. Metrodata is committed to providing comprehensive and innovative cloud solution offerings for organizations in the Indonesian market.