AWS Partner Network (APN) Blog
How TIBCO Leverages AWS for its COVID-19 Analytics App
By Noora Husseini, Lead Data Scientist at TIBCO Software
By Mariano Luna, Sr. Manager, Cloud and Technology Alliances at TIBCO Software
By Dilip Rajan, Partner Solutions Architect at AWS
 |
In March 2020, TIBCO Software—an integration, analytics, and event-processing software provider—launched an analytics app to track the spread and impact of the COVID-19 pandemic in real-time, over local regions worldwide.
The goal of this analytics app is to enable organizations to assess the potential impact of the COVID-19 pandemic on their business fabric, using sound data science and data management principles, in the context of real-time operations.
In this post, we will take you through some of key capabilities of the app and how it was developed on Amazon Web Services (AWS) to help customers in industry segments like CPG, retail, travel, entertainment, and insurance.
The app uses TIBCO Spotfire, an analytics and data visualization product that includes capabilities such visual analytics, data wrangling, predictive analytics, location analytics, and streaming analytics.
With the Spotfire stack running on AWS and leveraging the AWS Cloud’s elasticity and high availability, this app provides a free service open to anyone. The data science team at TIBCO created the statistical models using data from John Hopkins University, Our World in Data, and a number of local sources.
TIBCO Software is a AWS Partner Network (APN) Advanced Technology Partner with AWS Competencies in Machine Learning, Data & Analytics, and Retail. It enables faster and better decisions, smarter actions by capturing data in real-time, and augmenting business intelligence (BI) through analytical insights.
Key Features
Multiple functionalities make TIBCO’s visual data science application unique, allowing companies and individuals to understand the pandemic in their local region with visual data science and real-time updates.
TIBCO Spotfire enables end consumers to interact with the data by enabling them to drill into areas of interest and interact with the model’s parameters, which are visualized and updated in real-time. From the dashboard, users can discover trends, outliers, and patterns, and run machine learning (ML) and statistical methods via an embedded R engine.
Unique features of TIBCO’s base app include:
- Regional and county-level maps with interactive visual and advanced geo-analytics that highlight COVID-19 hotspots and trends. The app provides geo-analytics analysis at the county level for the United States and United Kingdom, and plans to add local data for other countries in the European Union and APAC based on demand.
. - Estimates and predictions of Effective Reproduction Number (Re) at local, regional, and country levels. Re indicates how effectively the virus is spreading through transmission in local regions.
.
National and local governments worldwide are basing their back-to-work programs on keeping Re below 0.8 – 1.0. The app provides a daily timeline for Re estimates across local regions around the world, including confidence bands (credible intervals) on these estimates.
.- Re predictions are leading indicators for expected cases and fatalities. TIBCO’s app includes point-click selection for adjusting serial interval parameters in these estimates, so that data scientists can explore regional effects.
.
The serial interval is the number of days between symptom onset between infector and infectee. While this is still being determined by researchers, the app allows researchers to “experiment” and view results.
. - Re predictions are calculated in Spotfire using R’s EpiEstim package and the latest government figures. Because this is calculated each day, the report displays the trend of the changing Re.
.
- Re predictions are leading indicators for expected cases and fatalities. TIBCO’s app includes point-click selection for adjusting serial interval parameters in these estimates, so that data scientists can explore regional effects.
- Case and fatality trajectories on a global and local level, allowing companies to track outbreaks in local regions of interest like stores, entertainment facilities, insurance policy holders, and more.
.- Non-parametric super-smoothing analysis of cases and fatalities were used. This curve fit method is more robust than the widely used moving average methods, and removes inconsistencies and errors in reporting while providing summaries and projections of case velocities at local and regional levels.
.
- Non-parametric super-smoothing analysis of cases and fatalities were used. This curve fit method is more robust than the widely used moving average methods, and removes inconsistencies and errors in reporting while providing summaries and projections of case velocities at local and regional levels.
- Local government interventions highlighting the impact of preventative measures on the epidemic curves, such as school closures, social distancing, lockdown, and more.
.
The app provides a comprehensive set of interventions categorized to match prominent scientific papers and work from leading epidemiology institutions, including detail from local public health department sources. These are used to annotate case count data with the super-smoother estimates, showing the impact of applying and lifting local intervention measures.
. - Interactive visual data science, analytics, and what-if scenarios, allowing data scientists and casual users to explore data and hypotheses, locally and countrywide. This includes examining effects of virus transmission and interventions on case and death rates; and non-parametric regression analysis of epidemic curves that enable discoveries not available with standard data crunching packages.
. - Hospital locator finding nearby bed utilization within a fixed driving radius.
. - Granular, province-level data for multiple European, Asian, and North American countries. Allows more localized Re estimates and trajectories. Requires complex data ingestion and synchronization across various global entities.
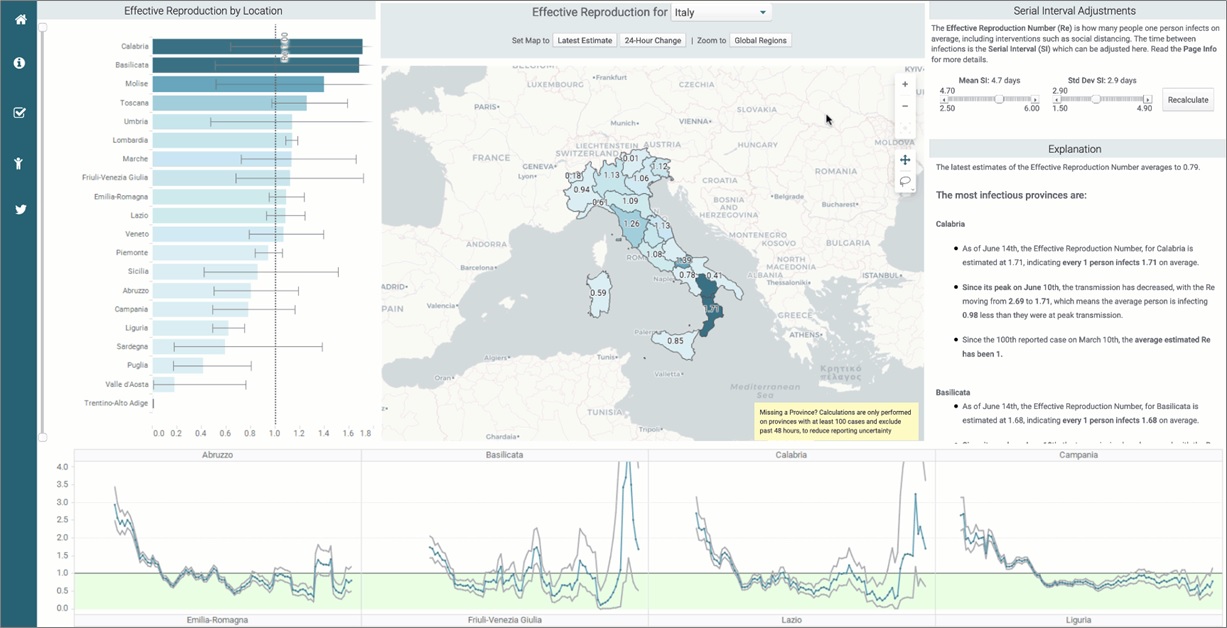
Figure 1 – Marking regions of Italy to zoom in on the detail in the COVID-19 app.
TIBCO Spotfire’s built-in interactive map visualization capabilities provide spatial visualization of the data selected, as shown in Figure 1 above. Multiple types of data (point locations, shapefiles, WMS, TMS) can be visualized through multiple layers in a single map.
User selections invoke algorithms under the hood to perform calculations both within and between the map’s data layers. These calculations can produce additional map layers to illustrate results, such as contours, heatmaps, optimal driving routes, and territories.
The layers are dynamically linked to the underlying data science algorithm, and can respond to the marking and filtering of the map, providing powerful interactive location analytics.
Application Architecture
The overall solution architecture leverages AWS native services to enable this application to efficiently handle the demanding traffic, as shown in Figure 2.
The nature of the free service, which is used worldwide, makes it difficult to predict the load on the servers at any given time. Thus, the app relies heavily on Auto Scaling Groups to create a cost-efficient and elastic infrastructure that can handle the traffic demands while exceeding SLAs.
This same infrastructure is the one used for TIBCO Cloud Spotfire Enterprise, and is the same one customers have been leveraging for internal use cases.
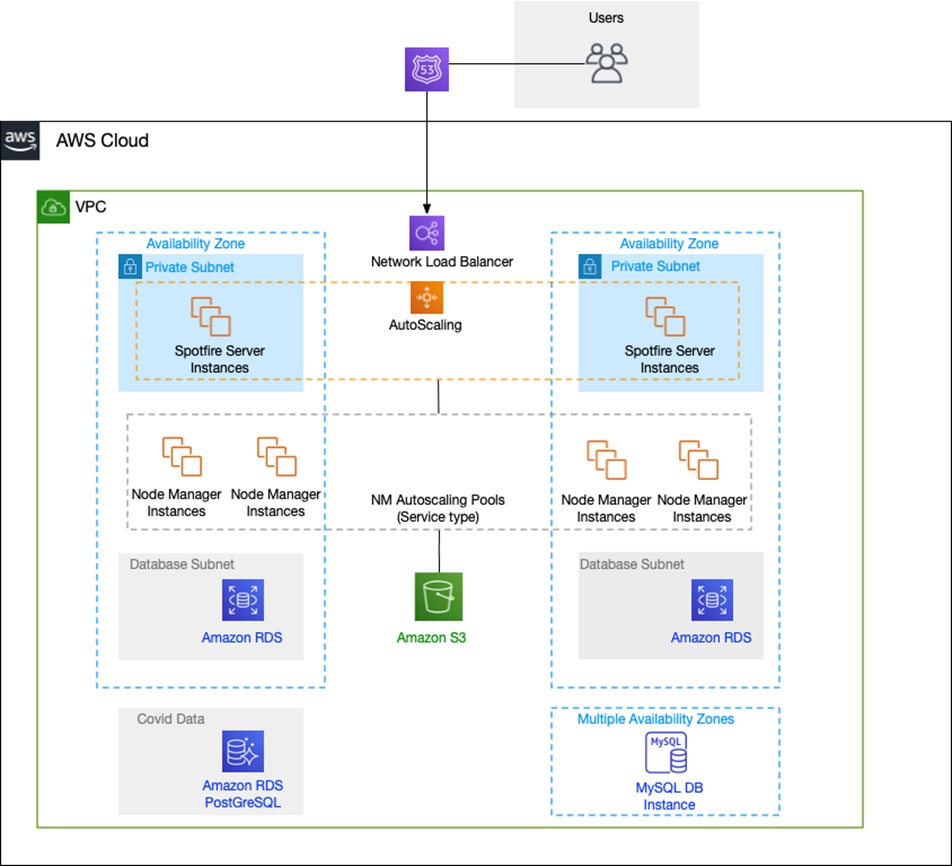
Figure 2 – TIBCO Spotfire architecture leveraging AWS native services.
The overall TIBCO Spotfire architecture spans two AWS Availability Zones in the main region, and traffic is handled by Network Load Balancers with cross-zone load balancing enabled to increase the fault tolerance of the application.
The data is fed to the Spotfire dashboard from an Amazon Aurora database cluster that uses single-master replication and spans three Availability Zones within the region.
Spotfire uses Amazon Relational Database Service (Amazon RDS) as the backend database for its metadata storage, with the application blobs stored in Amazon Simple Storage Service (Amazon S3). With this architecture, and following AWS Well-Architected best practices, the app uses a highly available TIBCO Spotfire implementation that’s able to handle spikes in volumes.
In this particular use case, disaster recovery (DR) is paramount as the current situation has made a lot of companies take a new look at their business continuity plans.
To be able to handle DR scenarios, we have set up a pilot light deployment in a different AWS Region that can seamlessly take over in the unlikely event of a regional disruption. By utilizing Amazon S3, Amazon RDS, and Amazon Aurora cross-region replication, we are able to drastically reduce the RTO and RPO for this application.
You can build your own COVID-19 application with the Spotfire starter template, which includes R scripts and data workflows that download and clean the latest public data. Spotfire can also be integrated with Amazon SageMaker using the Python data function.
Download the Spotfire COVID-19 starter template >>
Read more about the data science behind the COVID-19 application in this three-part series of TIBCO blog posts:
- COVID-19: A Visual Data Science Analysis and Review (Part 1)
- COVID-19: Update and Methodologies (Part 2)
- COVID-19: A Primer for Analytics in the Back-to-Work Landscape (Part 3)
Conclusion
This TIBCO COVID-19 Live Report has garnered much attention with customers, prospects, local and federal governments, press, analysts, and think tanks.
TIBCO is currently helping customers and prospects in CPG, retail, travel, entertainment, and insurance on various use cases, such as store re-openings, insurance policy risk, employer re-opening apps, and apps for social distancing enforcement in crowd management.
COVID-19 is far from over, and as economies start to re-open, visual analytics tools like the TIBCO app will be key in helping organizations get situational awareness and prepare to move forward.
.

.
TIBCO – APN Partner Spotlight
TIBCO is an AWS Competency Partner. TIBCO enables faster and better decisions, smarter actions by capturing data in real-time, and augmenting business intelligence through analytical insights.
Contact TIBCO | Solution Overview | AWS Marketplace
*Already worked with TIBCO? Rate this Partner
*To review an APN Partner, you must be an AWS customer that has worked with them directly on a project.