AWS Partner Network (APN) Blog
Tracing Tenant Activity for Multi-Account SaaS with AWS Distro for Open Telemetry
By Tomo Sakatoku, Principal Partner Solution Architect – AWS
By Peter Yang, Sr. Partner Solution Architect – AWS SaaS Factory
When developing a multi-tenant software-as-a-service (SaaS) solution, you need to ensure the solution can cater to different tenant profiles and dynamic workloads. In order to ensure the solution is performing reliably for all tenants, SaaS providers must have visibility into tenant activities within the SaaS solution so they may monitor, evaluate, and optimize application performance for individual tenants.
SaaS applications also have different deployment models. You may choose to deploy your SaaS solution into different Amazon Web Services (AWS) accounts, for reasons such as AWS account limits, tenant isolation, region specific deployment, reducing blast radius or other architecture considerations.
For example, you may choose to isolate tenants in an account per tenant model or account per tier model. Sometimes, you might even consider sharing your workload by deploying individual microservices in separate AWS accounts.
Regardless of the deployment model, it is recommended that you build a SaaS control plane for shared services, such as onboard, tenant management, and operate the SaaS environment. Control plane is also the centralized location for data needed to operate and analyze the multi-tenant SaaS environment.
Application Plane is where the multi-tenant functionality of your SaaS application lives and potentially deployed across different AWS accounts depending upon your use case. This is where we need to build instrumentation to emit data about what’s happening in the application.
When thinking about collecting data to help you understand what is going on in your SaaS environment, some of the common data points are monitoring data, logging data, and tracing data. Tracing data is important to understand tenant activities because it provides visibility of how end users are using the SaaS solution.
In this blog, we will focus on how to collect tracing data across your multi-account SaaS environment using AWS Distro for Open Telemetry (ADOT) and publish events to a control plane for data aggregation and analysis. We will publish the events with tenant context and show how you can use Amazon CloudWatch ServiceLens in the control plane to create a view of the health and performance of your SaaS solution running across multiple AWS accounts filtering by a tenant or tiers.
Before getting deep into cross-account observability with ADOT, let’s first look at a core SaaS architecture concepts and technology stacks we use for cross-account tracing.
Tenant Context in a SaaS Solution
Tenant context is critical for SaaS providers to monitor and analyze tenant specific activities. When a user signs into a SaaS application, the application needs to know the user’s identity and the tenant that user is associated with.
The combination of user identity and tenant identity is referred to as a SaaS identity. A SaaS identity is stored in an IdP, such as Amazon Cognito, and is represented in the JSON web token (JWT) provided by the IdP when an user authenticates. The SaaS application will use the SaaS identity to associate user events and requests back to a specific tenant.
AWS Distribution for OpenTelemetry (ADOT)
When you are making the investment for instrumenting your SaaS solution to publish tenant activities, you have to decide on an observability platform to process the telemetry data. Each observability platform could have its own instrumentation libraries or agents to collect the data.
This makes it a challenge to switch observability platforms or if you want to push the data to different observability platforms. With OpenTelemetry, you have a set of standardized platform-agnostic APIs for transforming and sending your SaaS telemetry data to an observability platform.
ADOT is a secure, production-ready, AWS-supported distribution of OpenTelemetry project that is integrated with AWS services such as AWS X-Ray and Amazon CloudWatch. With ADOT, you can collect data from your AWS resources with out-of-the-box instrumentation agents and push the data to the control plane. You can also use ADOT to push custom application metrics from your SaaS solution to the control plane, creating a holistic view of resource metrics along with custom application metrics.
AWS X-Ray and Amazon CloudWatch
To operate a SaaS application, monitoring application health is critical to understand how your users are interacting with the solution and how the solution is performing. You should monitor not only overall SaaS application health but also monitor and trace tenant-specific events to ensure individual tenant experiences meet their expectations. AWS X-Ray and Amazon CloudWatch are two services that can help you collect and aggregate tracing data.
AWS X-Ray receives traces from your application via ADOT and provides a complete view of requests as they travel through your application.
Once traces are collected in AWS X-Ray in individual accounts, Amazon CloudWatch Cross-Account Observability can merge the traces from individual accounts to the control plane and provide a visualization of complete SaaS application tracing using Amazon CloudWatch ServiceLens. Enabling Amazon CloudWatch Cross-Account Observability is easy and instructions for setup can be found in the AWS Documentation.
Sample Application for Demonstration
Let’s see how these services work together to help you build a broader observability capability for your SaaS application. The SaaS application we are using today is an airline booking system deployed across two AWS accounts.
Here are the key components for the SaaS application:
- User Portal: Each user can sign up and log into the portal after authorized by Amazon Cognito. Through the portal, users can book a flight and retrieve airline miles information.
- Booking API: Users can book a flight with booking API. This microservice (Microservice-A) is designed to utilize an Amazon API Gateway, AWS Lambda and Amazon DynamoDB.
- Mileage API: Users can retrieve mileage information by invoking the Mileage API. This microservice (Microservice-B) also utilizes an Amazon API Gateway, AWS Lambda and Amazon DynamoDB, as seen in figure 1.
Here is a high-level booking flow for the application.
- User logs in the portal after being authorized by Amazon Cognito and makes a flight ticket reservation. The user inputs information needed for booking such as a name, travel destination, dates and so on.
- This reservation is processed by Lambda functions and the input information is stored into Amazon DynamoDB in the Microservice-A account.
- After all the information is stored in Amazon DynamoDB, other Lambda functions in the Microservice-B account are triggered through Amazon SNS to calculate the mileage, store it into Amazon DynamoDB and send the response back to the portal.
These user and system activities are collected as traces using the ADOT collector, sent and stored to AWS X-Ray in each account. By enabling Amazon CloudWatch Cross Account Observability, all the telemetry data, including traces across AWS accounts, are merged in CloudWatch inside our centralized account.
In this demo, to make it simple, we are setting up the Microservice-A account for both hosting the booking API and configured as the centralized account for viewing CloudWatch data.
It’s important to note that ADOT does not record tenant related information, such as tenant-id, tenant tier-level in its tracing by default. This information is critical for SaaS providers to track a specific tenant activity.
In this sample application, we are adding tenant-id and tier-level to AWS X-Ray annotation so that we can filter and identify a particular activity by a tenant when viewing the tracing data.
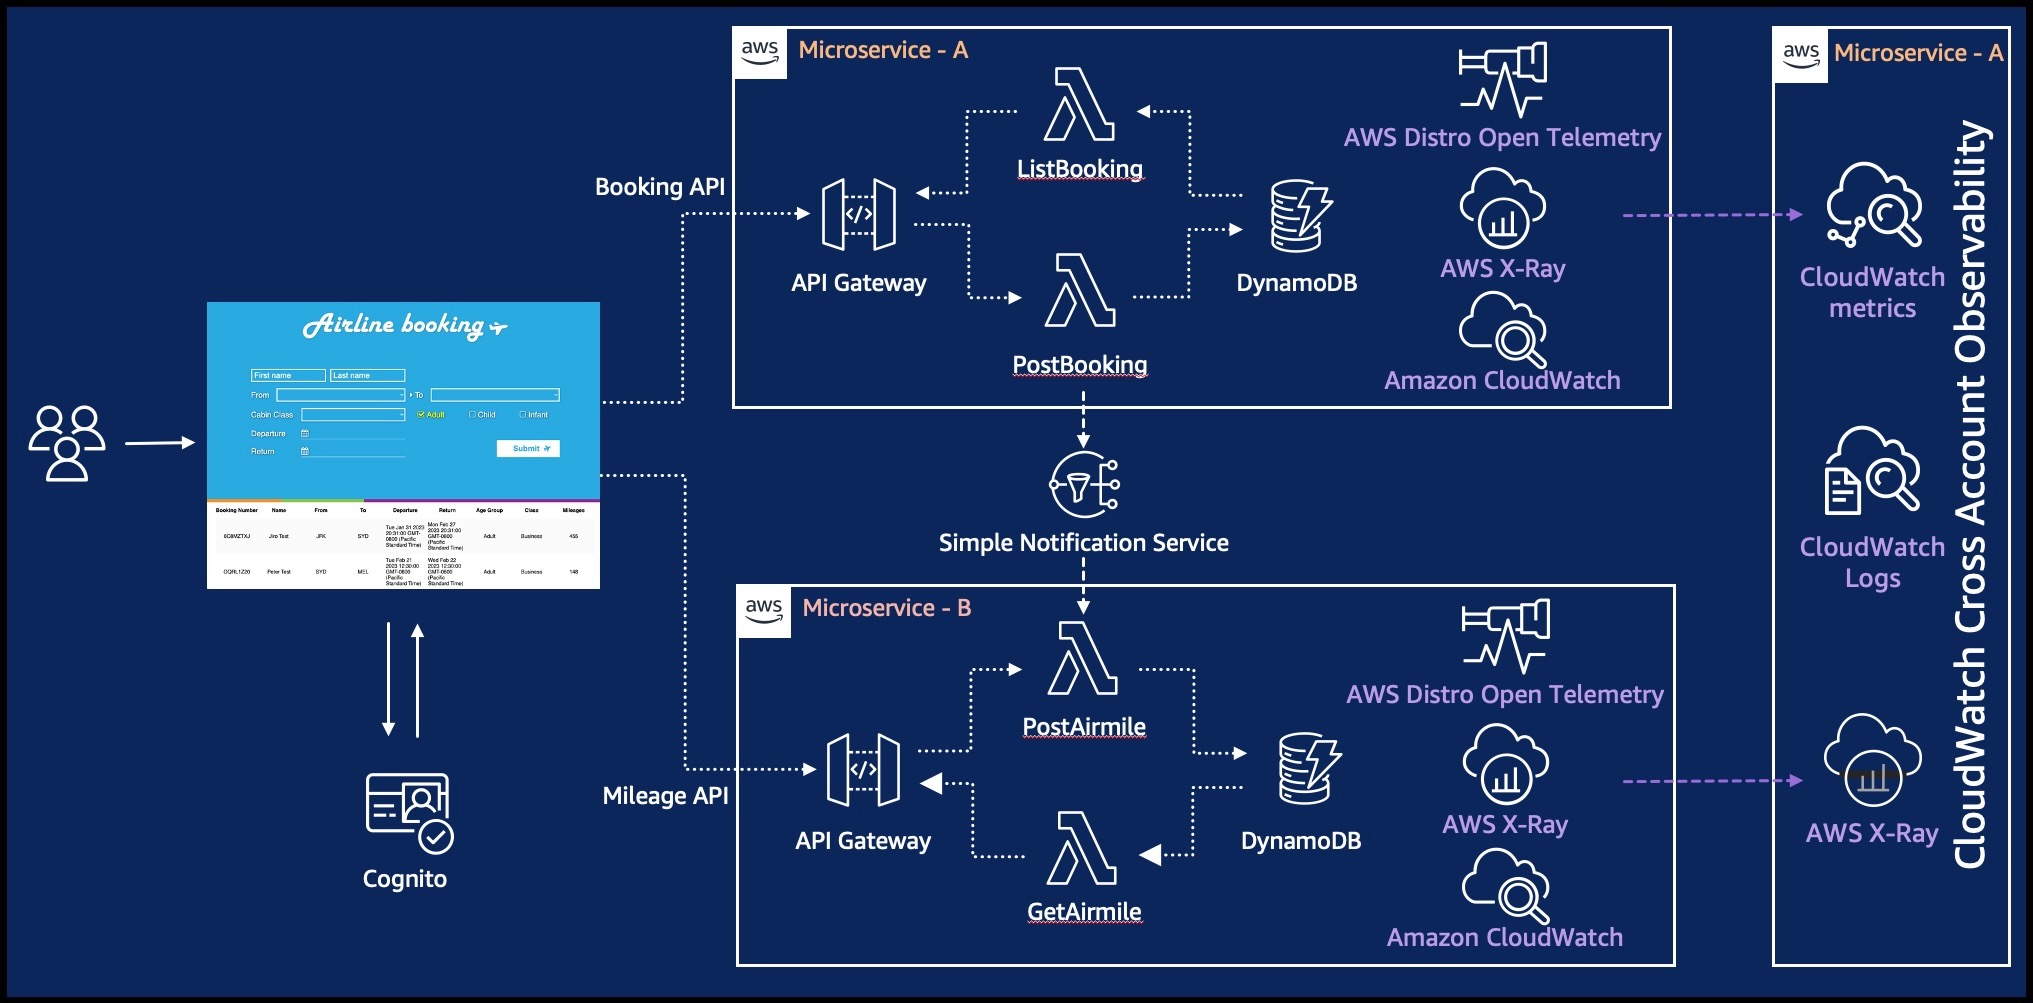
Figure 1 – Sample ticketing serverless application.
Every time you create a user in Amazon Cognito User Pool, Amazon Cognito allocates a unique user-id (sub) for each user. In Amazon Cognito, you can add custom attributes based on how you like to analyze user/tenant activities. We added tenant-id and tier-level in user attributes so you can slice and dice user and tenant activities.

Figure 2 – User attributes in Amazon Cognito User Pool.
Implementing ADOT to Collect Distributed Tracings for Tenant Activities
We use the ADOT Collector for AWS X-Ray to capture and send traces to AWS X-Ray. The ADOT Collector will be deployed in the Lambda layer to collect telemetry generated by lambda functions. By default, the ADOT exporter delivers this telemetry to AWS X-Ray but you can also change the destination by configuring the collector.yaml file.
Once you enable ADOT in your Lambda Layer, you will see below (Figure 3) added in the Lambda Layer. In the sample application, we are using the Python runtime.
AWS Lambda Layer supports a certain version of python. Make sure your python version is in the support list. Also visit the link for instructions and details on how to enable and configure your Lambda Layer.

Figure 3 – AWS Lambda Layer setup.
Now, we have ADOT setup and collecting telemetry (tracings) and sending it to AWS X-Ray. The tenant-id and tier-level are a part of the JWT passed to Lambda functions through the HTTP authorization header. The Lambda functions extract them from the JWT, and adds them in AWS X-Ray annotation.
Here’s a sample python code for how to retrieve the tenant-id and tier-level from JWT and add to AWS X-Ray annotation:
Since the application is deployed across multiple AWS accounts, we need to share the tenant-level and tenant-id across accounts when the request flows across accounts so the microservices in the different account can annotate tracing data with tenant context. We pass the tenant-level and tenant-id as a part of the Amazon SNS message to another AWS account.
You’ll see what attributes are shared across accounts in below:
It’s time to see how the traces get correlated in Amazon CloudWatch ServiceLens. Amazon CloudWatch Service Lens provides you the capability to visualize and analyze application health and performance in a single place.
As you see in the Figure 4, you’ll find two Amazon API Gateway icons and other resources mapped in Service Lens across the two AWS accounts.
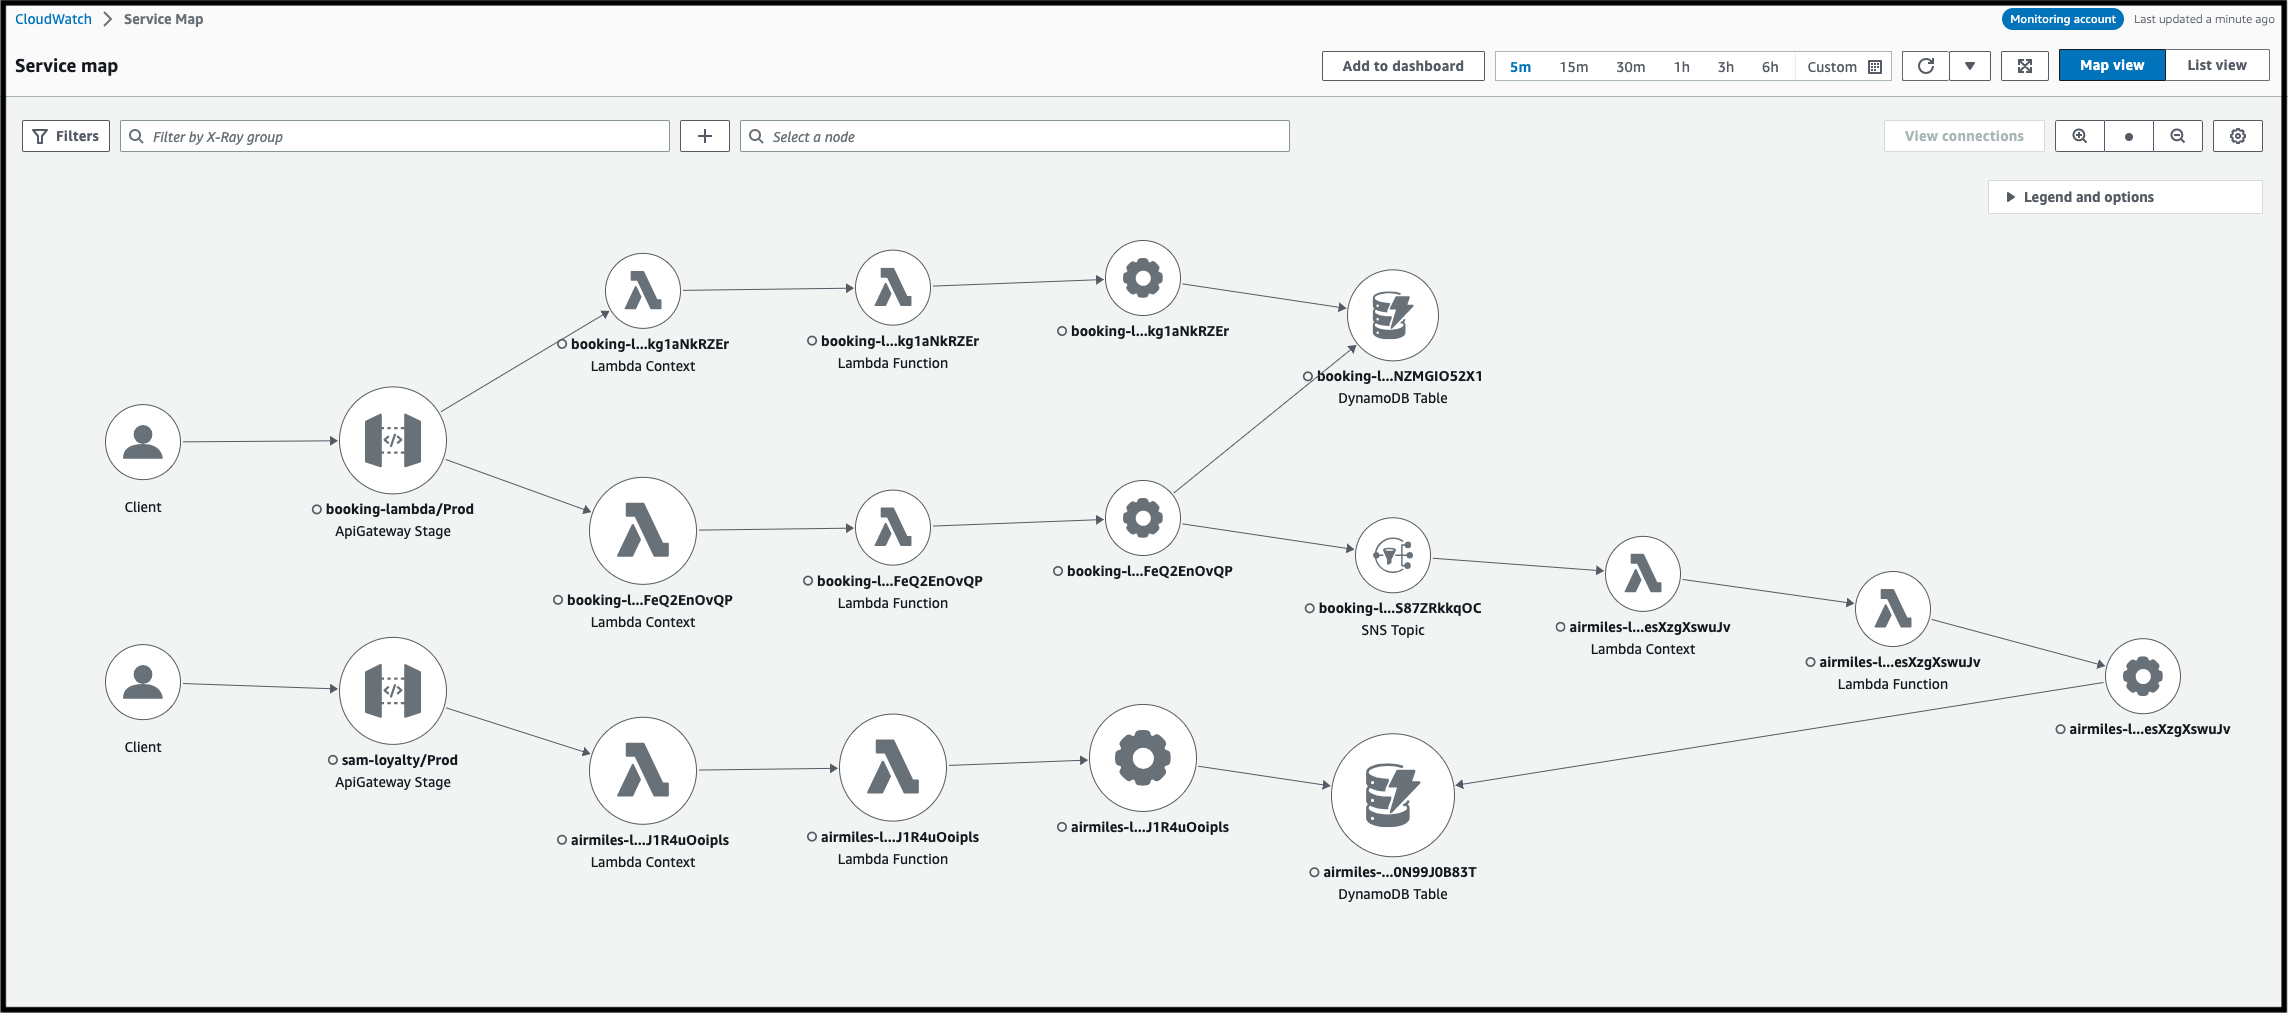
Figure 4 – Amazon CloudWatch Service Lens map.
To slice and dice the traces from different angles, you could also use filter expression to get a variety of insights. Let’s use tenant-id to filter a specific tenant’s activity. You should find the selection of tenant-ids in the filter pull down. By selecting one of tenant-ids, you can analyze the tenant specific activities (Figure 5 and Figure 6).

Figure 5 – Using Filter expression to filter traces by tenant-ids.

Figure 6 – Particular tenant trace across multiple AWS accounts.
This filtering capability is powerful. You can filter traces by both out-of-box attributes and custom annotations, which you can add based on your needs.
Conclusion
In this post, we talked about how to identify tenant activities inside microservices across multiple AWS accounts. We explained how to instrument lambda functions to add tenant information as a part of tracings using ADOT and showed how to create a service map across multiple AWS accounts using CloudWatch.
SaaS architecture becomes complex and hard to operate for many reasons. Leveraging AWS Observability technology helps SaaS providers optimize operational efficiency and lets them focus on what they want to build.
If you are interested in AWS Observability, visit One Observability workshop to learn more.
About AWS SaaS Factory
AWS SaaS Factory helps organizations at any stage of the SaaS journey. Whether looking to build new products, migrate existing applications, or optimize SaaS solutions on AWS, we can help. Visit the AWS SaaS Factory Insights Hub to discover more technical and business content and best practices.
SaaS builders are encouraged to reach out to their account representative to inquire about engagement models and to work with the AWS SaaS Factory team.
Explore today resources for any stage of your SaaS journey from design and build, to launch and optimization.