AWS News Blog
AWS Systems Manager Explorer – A Multi-Account, Multi-Region Operations Dashboard

|
Since 2006, Amazon Web Services has been striving to simplify IT infrastructure. Thanks to services like Amazon Elastic Compute Cloud (Amazon EC2), Amazon Simple Storage Service (Amazon S3), Amazon Relational Database Service (Amazon RDS), AWS CloudFormation and many more, millions of customers can build reliable, scalable, and secure platforms in any AWS region in minutes. Having spent 10 years procuring, deploying and managing more hardware than I care to remember, I’m still amazed every day by the pace of innovation that builders achieve with our services.
With great power come great responsibility. The second you create AWS resources, you’re responsible for them: security of course, but also cost and scaling. This makes monitoring and alerting all the more important, which is why we built services like Amazon CloudWatch, AWS Config and AWS Systems Manager.
Still, customers told us that their operations work would be much simpler if they could just look at a single dashboard, listing potential issues on AWS resources no matter which ones of their accounts or which region they’ve been created in.
We got to work, and today we’re very happy to announce the availability of AWS Systems Manager Explorer, a unified operations dashboard built as part of Systems Manager.
Introducing AWS Systems Manager Explorer
Collecting monitoring information and alerts from EC2, Config, CloudWatch and Systems Manager, Explorer presents you with an intuitive graphical dashboard that lets you quickly view and browse problems affecting your AWS resources. By default, this data comes from the account and region you’re running in, and you can easily include other regions as well as other accounts managed with AWS Organizations.
Specifically, Explorer can provide operational information about:
- EC2 issues, such as unhealthy instances,
- EC2 instances that have a non-compliant patching status,
- AWS resources that don’t comply with Config rules (predefined or your own),
- AWS resources that have triggered a CloudWatch Events rule (predefined or your own).
Each issue is stored as an OpsItem in AWS Systems Manager OpsCenter, and is assigned a status (open, in progress, resolved), a severity and a category (security, performance, cost, etc.). Widgets let you quickly browse OpsItems, and a timeline of all OpsItems is also available.
In addition to OpsItems, the Explorer dashboard also includes widgets that show consolidated information on EC2 instances:
- Instance count, with a tag filter,
- Instances managed by Systems Manager, as well as unmanaged instances,
- Instances sorted by AMI id.
As you would expect, all information can be exported to S3 for archival or further processing, and you can also set up Amazon Simple Notification Service (Amazon SNS) notifications. Last but not least, all data visible on the dashboard can be accessed from the AWS CLI or any AWS SDK with the GetOpsSummary API.
Let’s take a quick tour.
A Look at AWS Systems Manager Explorer
Before using Explorer, we recommend that you first set up Config and Systems Manager. This will help populate your Explorer dashboard immediately. No setup is required for CloudWatch events.
Setting up Config is a best practice, and the procedure is extremely simple: don’t forget to enable EC2 rules too. Setting up Systems Manager is equally simple, thanks to the quick setup procedure: add managed instances and check for patch compliance in just a few clicks! Don’t forget to do this in all regions and accounts you want Explorer to manage.
If you set these services up later, you’ll have to wait for a little while for data to be retrieved and displayed.
Now, let’s head out to the AWS console for Explorer.

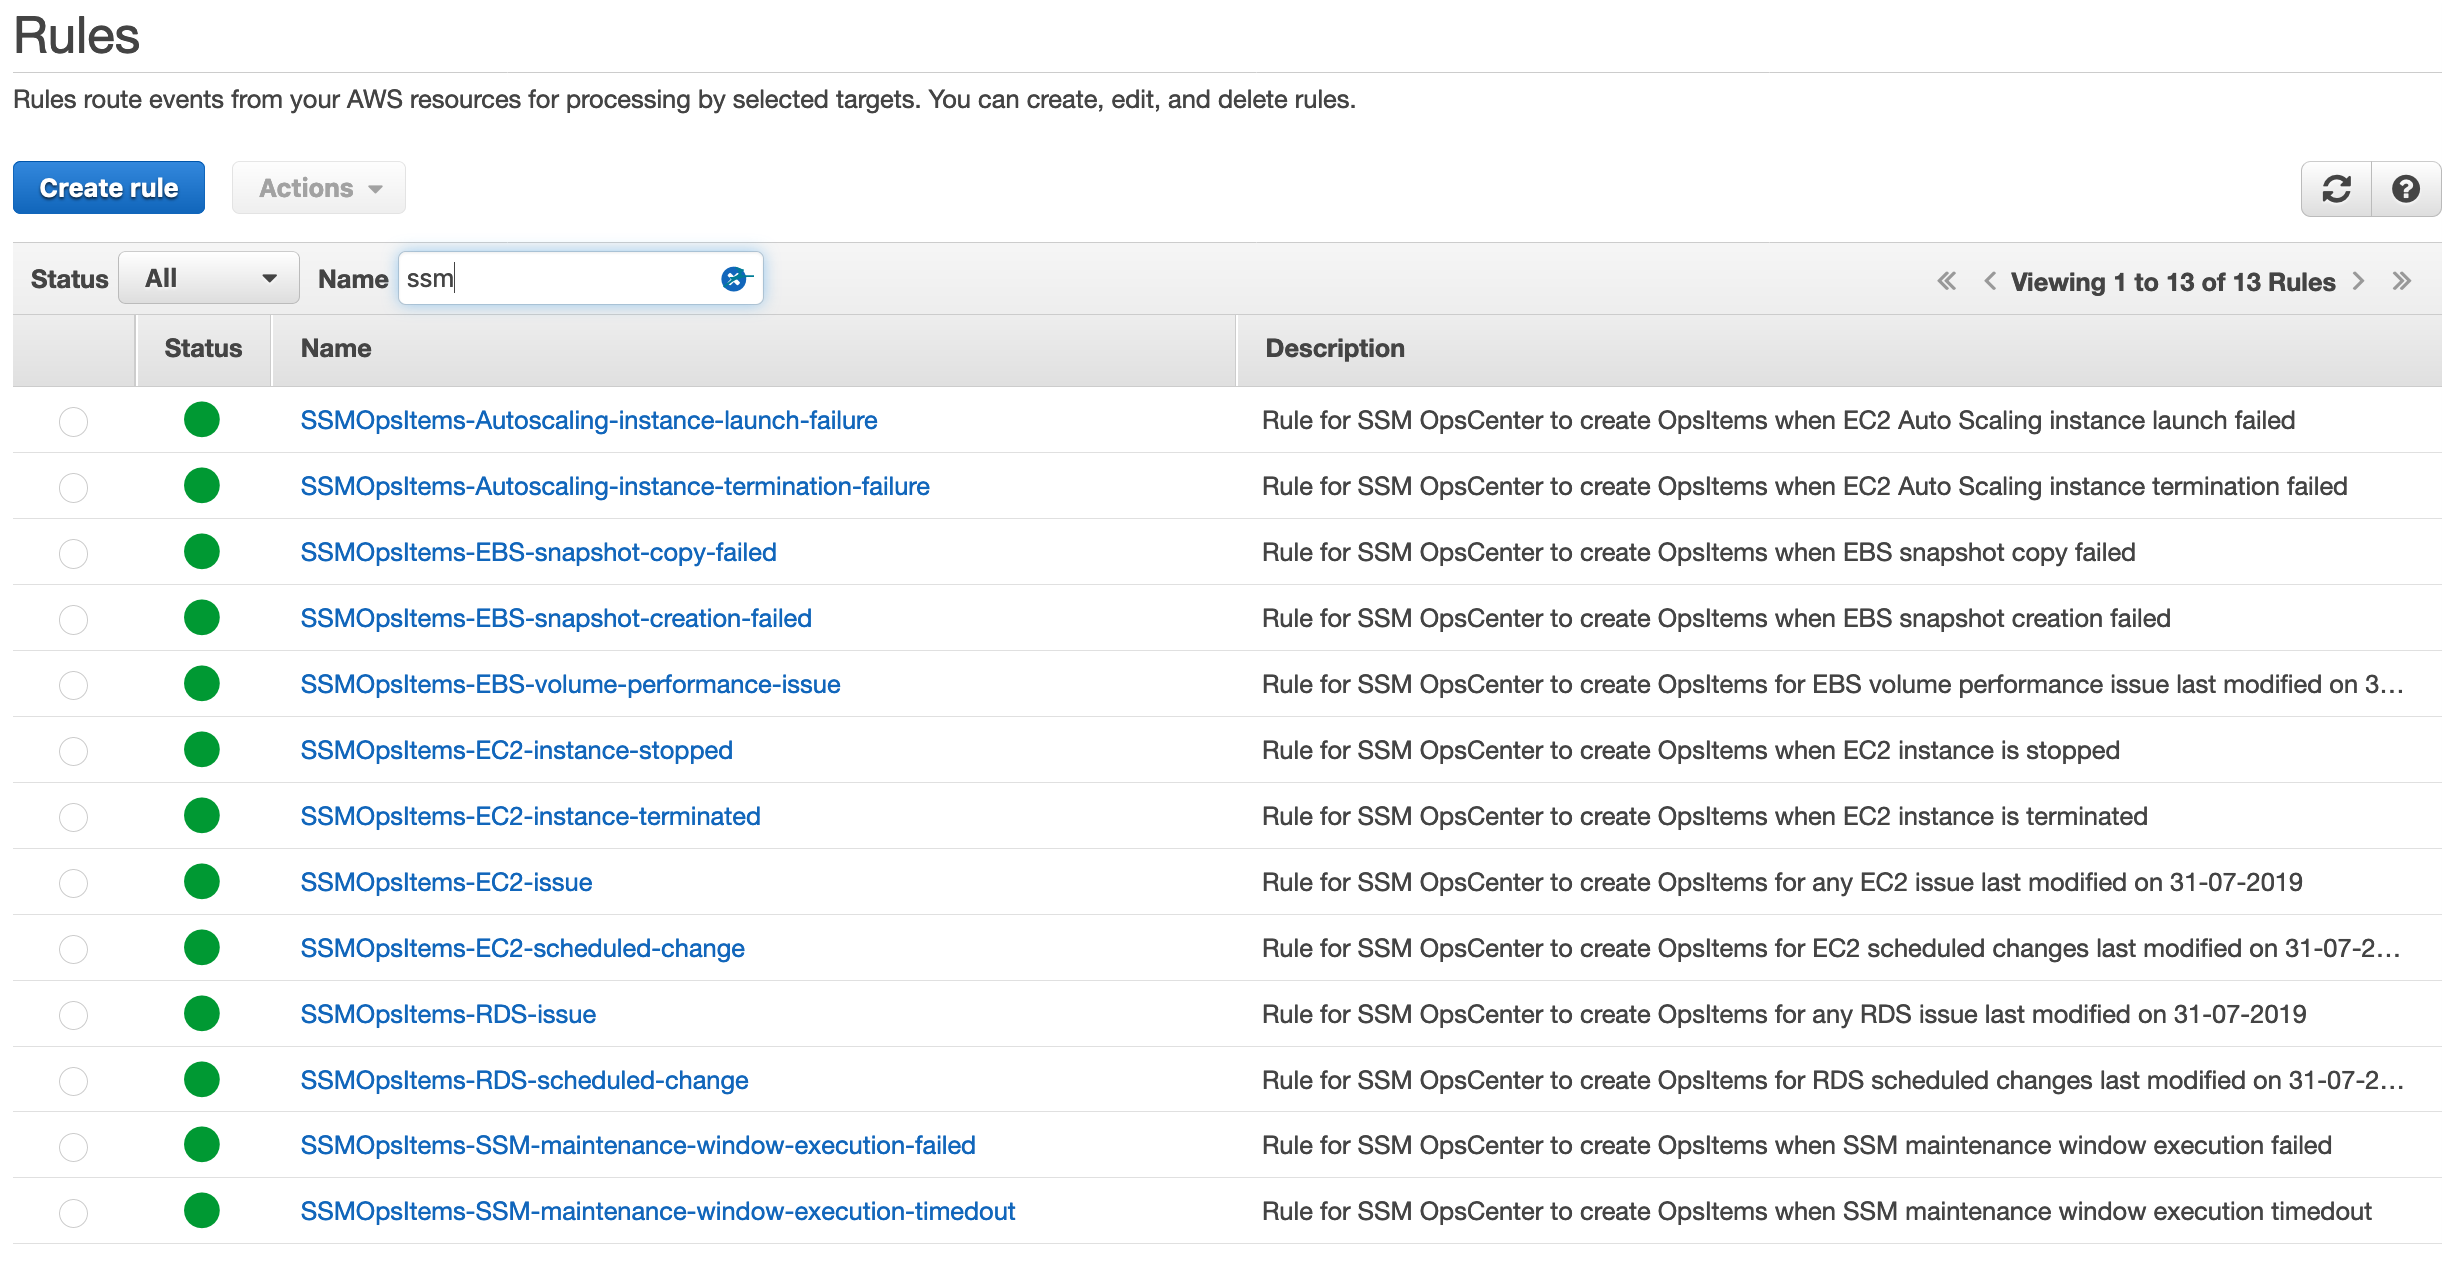
Once I’ve completed the one-click setup page creating a service role and enabling data sources, a quick look at the CloudWatch Events console confirms that rules have been created automatically.
Explorer recommends that I add regions and accounts in order to get a unified view. Of course, you can skip this step if you just want a quick taste of the service.
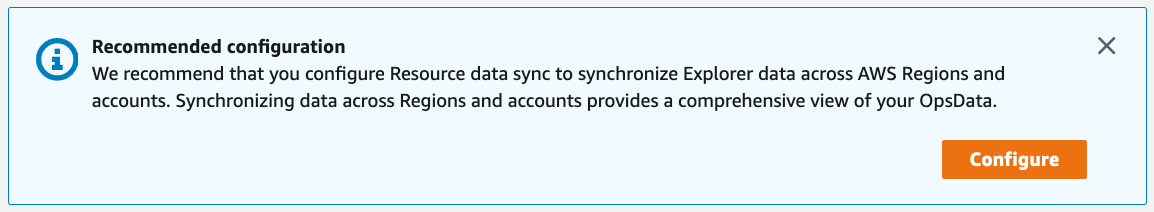
If you’re keen on synchronizing data, you can easily create a resource data sync, which will fetch operations data coming from other regions and other accounts. I’m going all in here, but please make sure you tick the boxes that work for you.

Once data has been retrieved and processed, my dashboard lights up. Good thing it’s only a test account!

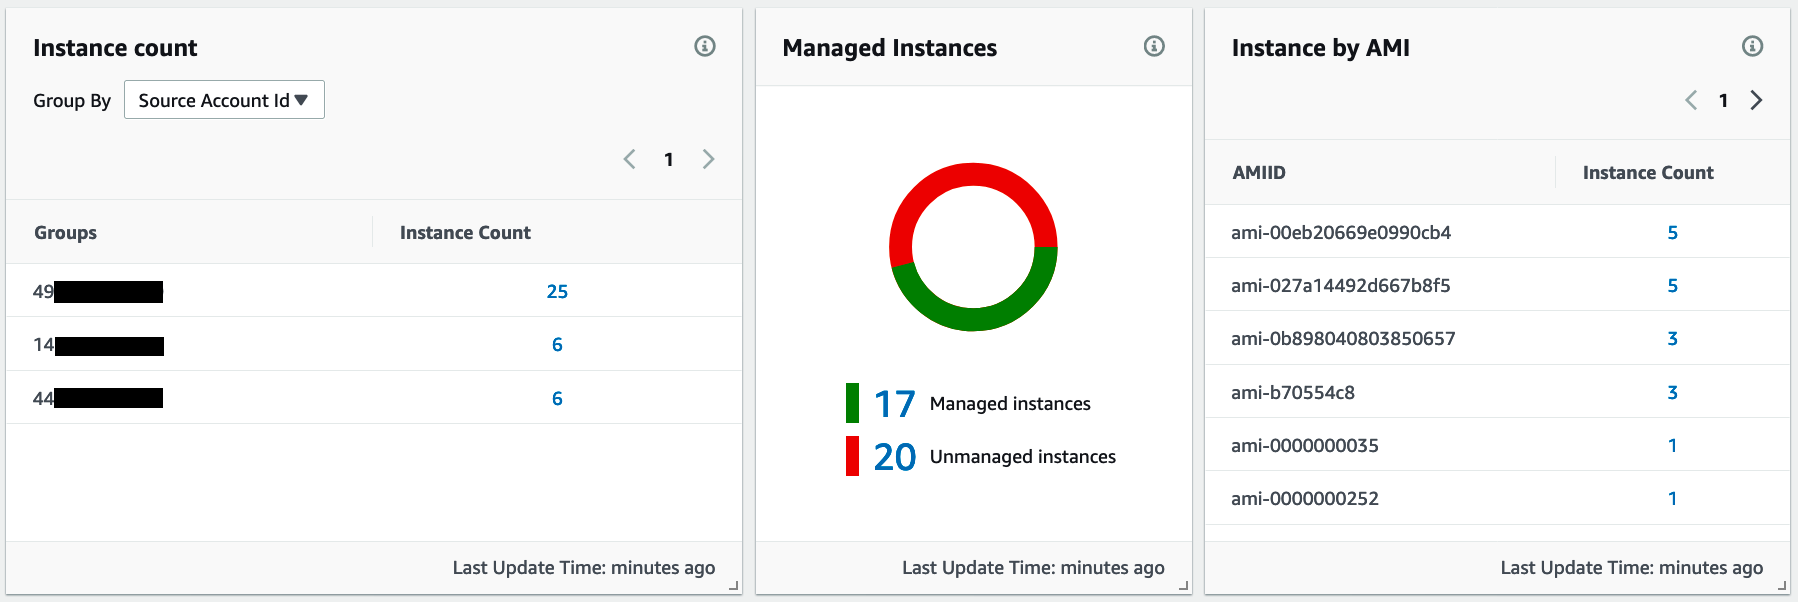
I can also see information on all EC2 instances.
From here on, I can group OpsItems and instances according to different dimensions (accounts, regions, tags). I can also drill down on OpsItems, view their details in Opscenter, and apply runbooks to fix them. If you want to know more about Opscenter, here’s the launch post.
Now Available!
We believe AWS Systems Manager Explorer will help Operations teams find and solve problems easier and faster, no matter what the scale of their AWS infrastructure is.
This feature is available today in all regions where AWS Systems Manager OpsCenter is available. Give it a try, and please share your feedback in the AWS forum for AWS Systems Manager, or with your usual AWS support contacts.
– Julien