AWS for Industries
WirelessCar built automotive connected mobility dashboard services using Amazon QuickSight
WirelessCar has created data-driven services like a data lake and dashboard for multiple use cases and is in the process of creating services based on artificial intelligence (AI) and machine learning (ML). WirelessCar has created a multitenant data lake solution as explained in our last blog post, “Automotive data lake solution with Amazon S3, Amazon RedShift by WirelessCar”. The automotive industry has a large amount of mobility data. Its value is still untapped because it is stored in silos and not immediately available to the people in roles that would benefit from it. Dashboards provide near-real-time visualization for business matrices, costs, performance, errors, and predictions. Automated reporting frees human resources from tedious and manual error-prone Excel sheets. Dashboards make developer teams aware of their service cost for optimizations. They also provide original equipment manufacturers (OEMs) with insights into vehicle errors, product design, user vehicle usage and cost, and service usage predictions based on current data.
This blog post will show you how to build connected mobility dashboard services using Amazon QuickSight, a popular cloud-native, serverless business intelligence solution, as well as highlight and showcase dashboard findings.
Overview of solution
WirelessCar had a goal to become a data-driven company in 2020. WirelessCar worked alongside Amazon Web Services (AWS) to make this possible in four stages. The first step was to identify datasets at WirelessCar with the highest collection value across the company. Examples of these datasets include, for example, vehicle information and operational metrics such as AWS costs associated with tagged resources. The second step was to create a data lake to break down data silos and create a multitenant data lake that is compliant with the European Union’s General Data Protection Regulation. The third step was to create an Amazon QuickSight–based dashboard to find insights from data. We are working on the fourth step to create AI/ML-based services with data in the data lake.
WirelessCar defined two main types of dashboard users: readers and authors. All employees and consultants are automatically granted reader status as part of the automatic onboarding, as well as access to certain foundational datasets. The Amazon QuickSight user role and the dataset access are controlled through Active Directory (AD) group membership, through the use of an AD Connector to the corporate Active Directory. More sensitive datasets have a request for approval flow integrated in the regular process at the company and are approved by a designated owner for each dataset. As a starting point, only the WirelessCar data management team members have the user role of authors to have a group of expert creators of dashboards. Readers can view dashboards and use the dashboard-specific filter controls but cannot make changes visible to others.
Datasets are sourced from a set of Amazon Redshift clusters. Amazon Redshift helps users accelerate their time to insights with fast, easy, and secure cloud data warehousing at scale. In these Amazon Redshift clusters, data is continually imported by batch jobs running either every 15 minutes or, in the case of more slowly changing data, nightly. WirelessCar has prepared datasets for overall OEM-level statistics such as vehicles per market, geospatial information such as vehicle service activity, trip metrics such as fuel/energy consumption, and AWS Cost & Usage Reports, which help users dive deeper into their AWS cost and usage data, with team tagging.

Solution
Tagging strategy
With a large number of teams and hundreds of AWS accounts in its AWS Organization, which helps the company centrally manage and govern its environment as it scales its AWS resources, WirelessCar needed to define a uniform tagging strategy for use across the company. AWS CloudFormation stacks in the AWS accounts are automatically tagged with the team and program information from ownership metadata of the originating GitHub repository. AWS CloudFormation helps users speed up cloud provisioning with infrastructure as code. Example tags are wcar.team=California and wcar.program=VW, which signal that the resource is owned by the California team and dedicated for the OEM customer VW. Although these tags are automatically populated by the continuous integration and continuous delivery pipeline, there are some tags that must be specified by the owning team. The intention is to put policies in place to make it impossible to deploy AWS CloudFormation stacks without a standard set of tags.
Cost and usage dashboard

The WirelessCar data management team has log data from AWS Cost Explorer—which helps users visualize, understand, and manage their AWS costs and usage over time—for all AWS Regions including the AWS China Region for billing available in the data lake. WirelessCar exports its AWS China Cost & Usage Reports and other data—limited to that permitted by regulation—from a bucket in Amazon Simple Storage Service (Amazon S3), object storage built to retrieve any amount of data from anywhere, in the AWS China Region to the data lake account in Ireland. This would normally be done using Amazon S3 Replication with cross-account trust, but due to the separation of China and the rest of the world, it is done by a function in AWS Lambda, which lets users run code without thinking about servers or clusters, that prompts Amazon S3 in the AWS China Region to replicate the object into an Amazon S3 bucket in the data lake account. This data exchange is typically for high-level metrics such as AWS cost, number of vehicles in the different OEM programs, and regional service metrics.
Using these datasets, the data management team prepares cost per vehicle per year, cost distribution across different WirelessCar programs, cost per program per WirelessCar service per year, AWS services cost split, and period-on-period changes. Catching trends early on is important, because escalating costs can indicate inefficient service use as well as act as a warning signal of potential bugs or service misuse. To make apples-to-apples comparisons and avoid seasonality effects, the data management team is using sliding 28-day periods, which combine quick reaction times with the smoothing of an interval. This is helping WirelessCar with cost optimizations. The OEM program teams are aware of the costs they are incurring and can prioritize their cost-optimization efforts. The finance teams used to prepare Excel sheets and manually prepare all the above reports on a monthly basis, but the teams can now access costs directly using Amazon QuickSight and do not need to wait for a monthly report. The majority of Amazon QuickSight use is interactive, but there are also some users opting to receive weekly PDF reports in their mailbox for certain dashboards. The WirelessCar finance teams and executives export the reports they need from Amazon QuickSight directly. This has made WirelessCar teams and executives self-aware about all costs and has reduced manual, error-prone work. This way WirelessCar is first internally becoming a data-driven company and benefiting from democratized data.
Maps
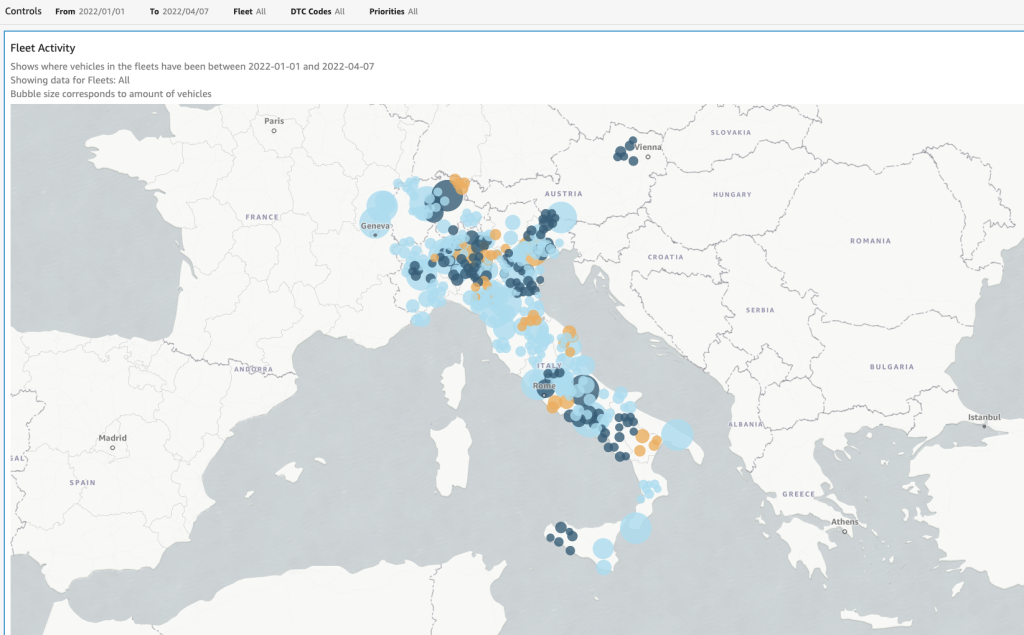
Maps dashboards are visual representations of geospatial data. Examples include spending by region, average vehicle trip count, and anonymized grid activities data for visualizations. Spend by region shows on the map in which AWS Regions we are spending the most. Trip and service data visualizations show areas of high activity, which sometimes can provide valuable insights on service usage. For example, a high number of call center services were found to originate in a limited number of locations. On closer investigation, this proved to be car dealerships where salespeople were demonstrating the service to prospective customers.
Generally, with geospatial data, there is a need to aggregate data into grids for both performance and privacy reasons. Amazon QuickSight has support for showing geospatial bubble charts as well as heatmaps on a US zip code level, but our preferred solution is to first preprocess the data into an Uber Engineering H3 hexagonal grid while in Amazon Redshift. In doing so, we can control the grid resolution, and we can then provide the data to Amazon QuickSight for display in geospatial bubble charts.
OEM dashboards

We are in the process of providing OEMs with dashboard as a service. We extract many datasets from our Position and Journey service like distance driven, trips taken, battery levels, and grid activities. Typical privately owned vehicles take about five trips per day on average, and thus we have hundreds of millions of trips streaming to our data lake per month. Distilled information from trips can be important for OEMs to develop new services and vehicles. Real-world distance driven per vehicle per day has implications for battery sizing, sharing services, and construction of charging infrastructure. Findings from the study of trips sometimes confirm initial theories, but sometimes the results go against what many think would be “obvious.” For example, the amount of time people spend in their vehicles, and the distances they drive, is surprisingly similar across rural and urban areas.
Error codes and forecasting
Error code and forecasting dashboards are on our roadmap for going forward. We are working with OEMs to collect diagnostic trouble code (DTC) data and prepare a dataset out of it. Having access to a dataset of DTCs will help OEMs to understand consumer vehicles in the field as well as their internal test fleets for models under development. We will extend this idea to build predictive maintenance use cases.
Having the history of vehicle volumes, it is natural to also look to extending this into forecasts for the future. WirelessCar aims to combine history-based methods with external information such as knowledge of new factories coming online and new markets being introduced. This will help with provisioning and reserving AWS resources and general capacity planning for new and existing customers alike. With more detailed knowledge of future requirements, WirelessCar is able to make strategic decisions such as whether to use additional AWS Regions or to purchase up-front reservations.
Conclusion
In this blog post, we demonstrated how WirelessCar is using a data lake and tagging strategy to build cost and billing, OEM, maps, error code, and forecasting dashboards to extract business insights and create value from data for WirelessCar and OEMs. If you wish to learn more about this or have any questions, then please reach out to us. We will continue working on becoming a data-driven company and tell you about how we are using AI/ML services on AWS to build new use cases in our next blog post.