Artificial Intelligence
Create a dashboard with SEC text for financial NLP in Amazon SageMaker JumpStart
Amazon SageMaker JumpStart helps you quickly and easily get started with machine learning (ML) and provides a set of solutions for the most common use cases that can be trained and deployed readily with just a few clicks. JumpStart also includes a collection of multimodal financial text analysis tools, including example notebooks, text models, and solutions, which use APIs from a JumpStart SDK. This post demonstrates how to use these APIs to create dashboards from Securities Exchange Commission (SEC) filings. For more examples of working with the JumpStart SDK, see Finance.
SEC filings are very important in finance. Companies file these reports with the SEC, which notifies the world about their business conditions and the future outlook of the companies. Because of their potential predictive value, these filings are good sources of information for many people, ranging from your average high-school investor to executives of large financial corporations. These filings are freely available to all investors. Although these SEC filings are publicly available to anyone, downloading parsed filings and constructing a clean dataset with added features is a time-consuming exercise, even for good technologists. We make this possible in a few API calls.
There are numerous types of filings, but the three that we focus on here are 10-Ks, 10-Qs, 8-Ks. 10-Ks are annual reports of the company and are quite detailed. 10-Qs are quarterly reports, except in the quarter in which a 10-K is filed and are less detailed than 10-Ks. Finally, 8-Ks are filed any time there is a change in business conditions that is material and needs to be reported. Numerous 8-Ks can be filed throughout the year. The functionality we discuss in this post provides an overall dashboard to represent these three types of filings with attribute scoring. We use specialized word lists derived from natural language processing (NLP) techniques to score the actual texts of these filings for several characteristics like risk, uncertainty, readability, litigiousness, and sentiment, providing accessible numbers to represent these traits. With this dashboard, anybody can pull up information and related statistics about any companies they have an interest in, and digest it in a useful way, rather than read voluminous filings that are often 50–100 thousand words in length.
This post demonstrates how to do the following in a notebook titled Dashboarding SEC Filings available from SageMaker JumpStart:
- Retrieve parsed 10-K, 10-Q, 8-K filings. Retrieving these filings from SEC’s EDGAR service is complicated, and parsing these forms into plaintext for further analysis can be very time-consuming. You now have the ability to create a curated dataset in a single API call.
- Create separate dataframes for each of the three types of forms, along with separate columns for each extracted section.
- Combines two or more sections of the 10-K forms. We implement this (as shown in the following sections) and save the combined text in a column called text2score. We demonstrate how to use the NLP scoring API to add numerical scores as new columns or features that may be used to construct a dashboard.
- Add a column with a summary of the text2score column.
- Prepare a final dataframe that can be used as input for a dashboard.
- Prepare an interactive (in the browser) data table.
One of the features of this dashboarding process shown in the notebook is breaking out the long SEC filings into separate sections, each of which deals with different aspects of a company’s reporting. This makes accessing and processing parts of the text of each filing easily available to investors or their algorithms.
Financial NLP
Financial NLP is a subset of the rapidly increasing use of ML in finance, but it is the largest. The starting point for a vast amount of financial NLP is text in SEC filings. SEC filings report different types of information related to various events involving companies. For the full list of SEC forms, see Forms List.
SEC filings are widely used by financial services companies as a source of information about companies in order to make trading, lending, investment, and risk management decisions. They contain forward-looking information that helps with forecasts and are written with a view to the future. In addition, in recent times, the value of historical time series data has degraded, since economies have been structurally transformed by trade wars, pandemics, and political upheavals. Therefore, text as a source of forward-looking information has been increasing in relevance.
There has been an exponential growth in downloads of SEC filings. How to Talk When a Machine is Listening: Corporate Disclosure in the Age of AI reports that the number of machine downloads of corporate 10-K and 10-Q filings increased from 360,861 in 2003 to 165,318,719 in 2016.
A vast body of academic and practitioner research is based on financial text, a significant portion of which is based on SEC filings. A recent review article summarizing this work is Textual Analysis in Finance (2020).
We describe how a user can quickly retrieve a set of forms, break them into sections, score the text in each section using the provided word lists, and then prepare dashboard elements to analyze the data.
This post shows how to curate a dataset of SEC filings with a single API call. This can save financial analysts weeks of work in creating a pipeline to download and curate SEC text, especially given its huge scale.
Install the smjsindustry library
We deliver the APIs through the smjsindustry client library. The first step requires pip installing a Python package that interacts with a SageMaker processing container. The retrieval, parsing, transforming, and scoring of text is a complex process and uses many different algorithms and packages. To make this seamless and stable for the user, the functionality is packaged into an Amazon Simple Storage Service (Amazon S3) bucket. For installation and maintenance of the workflow, this approach reduces your effort to a pip install followed by a single API call.
The following code blocks copy the wheel file to install the smjsindustry library. It also downloads a synthetic example dataset and dependencies to demonstrate the functionality of curating the TabText dataframe.
This also installs all the necessary packages and APIs that are needed to construct the financial NLP dataset.
Special functions
We created various helper functions to enable sectioning the SEC forms, each of which has their own sectioning structure, with sections assigned item numbers. The following code invokes various helper functions needed to parse out the various sections in the 10-K, 10-Q, and 8-K forms:
After this, import the necessary libraries as follows:
Next, we load the S3 bucket from the SageMaker session:
Note that we have loaded the SageMaker Python SDK Boto3 and classes from smfinance. You’re now ready to download SEC filings for curating your text dataframe. As we discuss next, this is done in a single API call.
Download the filings you want to work with
Downloading SEC filings is done from the SEC’s Electronic Data Gathering, Analysis, and Retrieval (EDGAR) website, which provides open data access. EDGAR is the primary system under the SEC for companies and others submitting documents under the Securities Act of 1933, the Securities Exchange Act of 1934, the Trust Indenture Act of 1939, and the Investment Company Act of 1940. EDGAR contains millions of company and individual filings. The system processes about 3,000 filings per day, serves up 3,000 terabytes of data to the public annually, and accommodates 40,000 new filers per year on average. For more information, see Accessing EDGAR Data. In this section, we provide a single API call that creates a dataset in a few lines of code, for any period of time and for a large number of tickers.
We wrapped the retrieval functionality into a SageMaker processing container and provide an example notebook in JumpStart so you can download a dataset of filings with metadata such as dates and parsed plaintext, which you can then use for ML using other SageMaker tools. You only need to specify a date range and a list of ticker symbols, and this API does the rest.
The extracted dataframe is written to Amazon S3 storage as a CSV file.
The following API specifies the machine to be used and the volume size. It also specifies the tickers or CIK codes for the companies to be covered, as well as the three form types (10-K, 10-Q, 8-K) to retrieve. The date range is also specified as well as the file name (CSV) where the retrieved filings are stored.
The API is in three parts:
- The top part specifies the following:
- The tickers or SEC CIK codes for the companies whose forms are being retrieved
- The SEC forms types (in this case 10-K, 10-Q, 8-K)
- Date range of forms by filing date
- The output CSV file and S3 bucket to store the dataset
- The middle section shows how to assign system resources and has default values in place
- The last part runs the API
This kicks off the processing job running in a SageMaker container and makes sure that even a very large retrieval can run without the notebook connection.
This example notebook uses data obtained from the SEC EDGAR database. Note that you are responsible for complying with EDGAR’s access terms and conditions. For more information, see Accessing EDGAR Data.
For this post, we downloaded three types of filings for seven companies for a period of 2 years. The completed dataset is stored in Amazon S3 as a CSV file titled 10k_10q_8k_2019_2021.csv. You can copy the file from the S3 bucket into your notebook instance and read it into a pandas dataframe to see the curated dataset:
The following screenshot shows our results.

The dataset has 248 rows and 6 columns. The column text contains the full plaintext of the filing. The column mdna is for the Management Discussion and Analysis section and is only present in the 10-K and 10-Q forms, not in the 8-K form.
Create the dataframe for the extracted item sections from the 10-K filings
Next, we create the dataframe for the extracted item sections.
- Subset the dataframe for the 10-K filings.
- Extract the sections for each 10-K filing and put them in columns in a separate dataframe.
- Merge this dataframe with the dataframe from Step 1.
You can examine the cells in the following dataframe to see the text from each section:
The following screenshot shows our results.
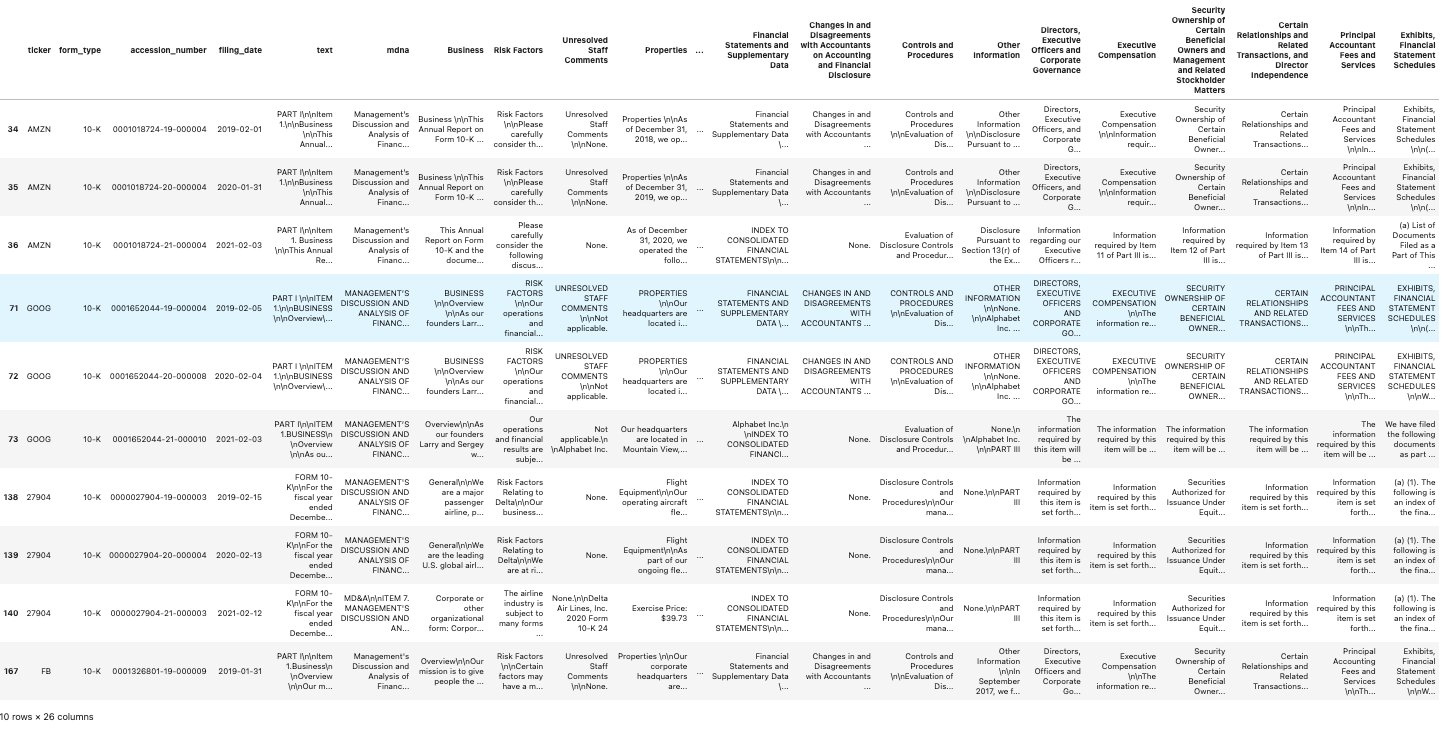
Visit the example notebook Dashboarding SEC Filings in JumpStart to see similar section extraction for the 10-Q and 8-K forms. For the latter, not all sections are populated. This is because 8-K forms are usually filed for reporting one type of material event that impacts a company, such as Bankruptcy/Receivership, Termination of a Material Definitive Agreement, Regulation FD Disclosure, and so on.
NLP scoring of the forms for specific sections
Financial text has been scored using word lists for some time. For a comprehensive review, see Textual Analysis in Finance.
The smjsindustry library provides 11 NLP score types by default: positive, negative, litigious, polarity, risk, readability, fraud, safe, certainty, uncertainty, and sentiment. Each score (except readability and sentiment) has its own word list, which is used for scanning and matching with an input text dataset.
NLP scoring delivers a score as the fraction of words in a document that are in the relevant scoring word lists. You can provide your own custom word list to calculate the NLP scores. Some scores like readability use standard formulae such as the Gunning-Fog score. Sentiment scores are based on the VADER library.
These NLP scores are added as new numerical columns to the text dataframe; this creates a multimodal dataframe, which is a mixture of tabular data and long-form text, called TabText. When submitting this multimodal dataframe for ML, it’s a good idea to normalize the columns of NLP scores (usually with standard normalization or min-max scaling).
You can automatically score any chosen text column using the tools in JumpStart. We demonstrate this with the following code example. We combine the MD&A section (Item 7) and the Risk section (Item 7A), and then apply NLP scoring. We compute 11 additional columns for various types of scores.
To begin, earmark the text for NLP scoring by creating a new column that combines two columns into a single column called text2score. A new file is saved in your Amazon S3 bucket.
NLP scoring can be slow for massive documents such as SEC filings, which contain anywhere from 20,000–100,000 words. Matching to long word lists (usually 200 words or more) can be time-consuming.
The input to the API requires the following:
- Specification of system resources, such as the number and type of machine instances to be used
- What NLP scores to generate, each one resulting in a new column in the dataframe
- The S3 bucket and file name in which to store the enhanced dataframe as a CSV file
- A section that kicks off the API
The output file name used in the following example is all_scores.csv, but you can change this to any other file name. It’s stored in the S3 bucket and then, as shown in the following code, we copy it into SageMaker Studio to process it into a dashboard.
The API call is as follows:
The API allocates rows of the dataframe to the chosen machine instance, and the processing logs show the progress of the session.
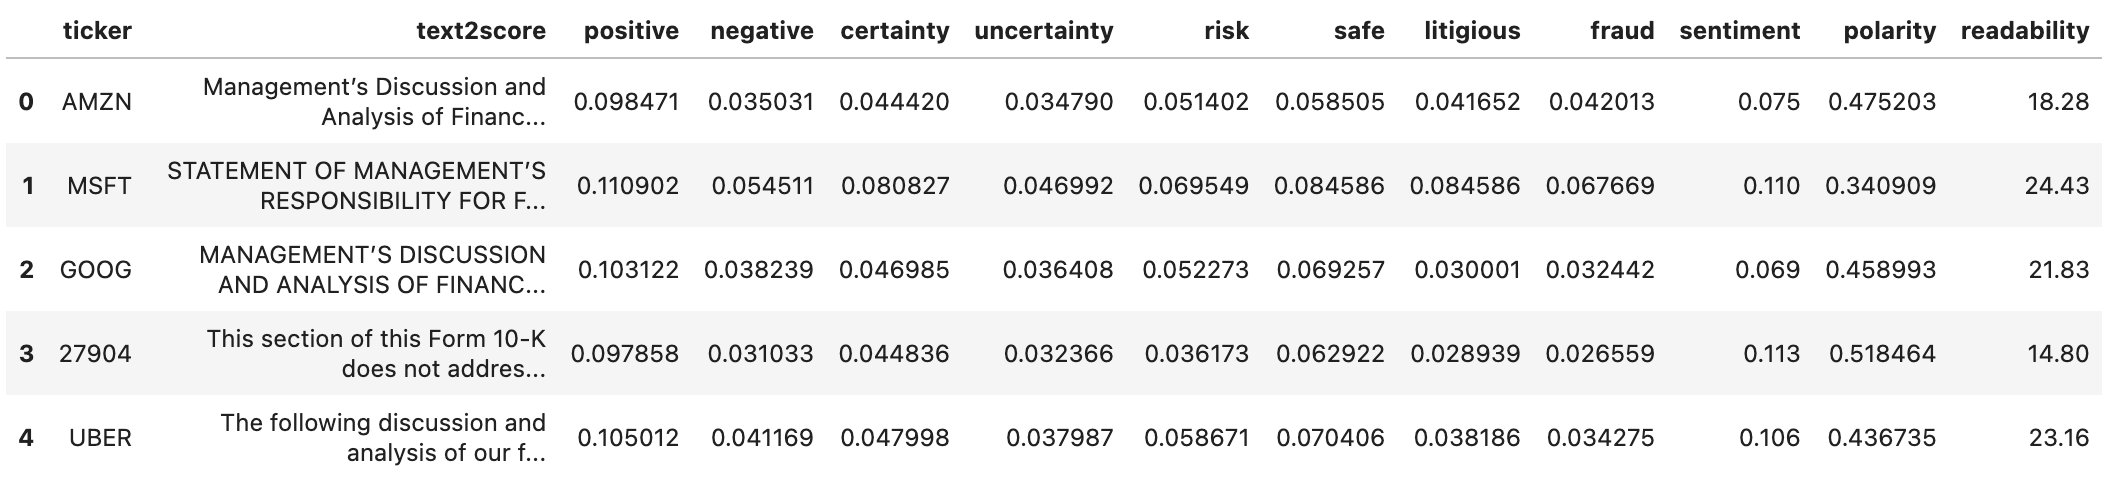
We write the file to Amazon S3. Now let’s look at the dataframe.
For example, the readability score mentions the number of years of schooling needed to read the material. The higher this value, the lower the readability.
Add a column with summaries of the text being scored
We can further enhance the dataframe with summaries of the target text column. As an example, we used the abstractive summarizer from Hugging Face. Because this summarizer can only accommodate roughly 300 words of text, it’s not directly applicable to our text, which is much longer (thousands of words). Therefore, we applied the Hugging Face summarizer to groups of paragraphs and pulled it all together to make a single summary. This happens automatically in the summary function in the following code.
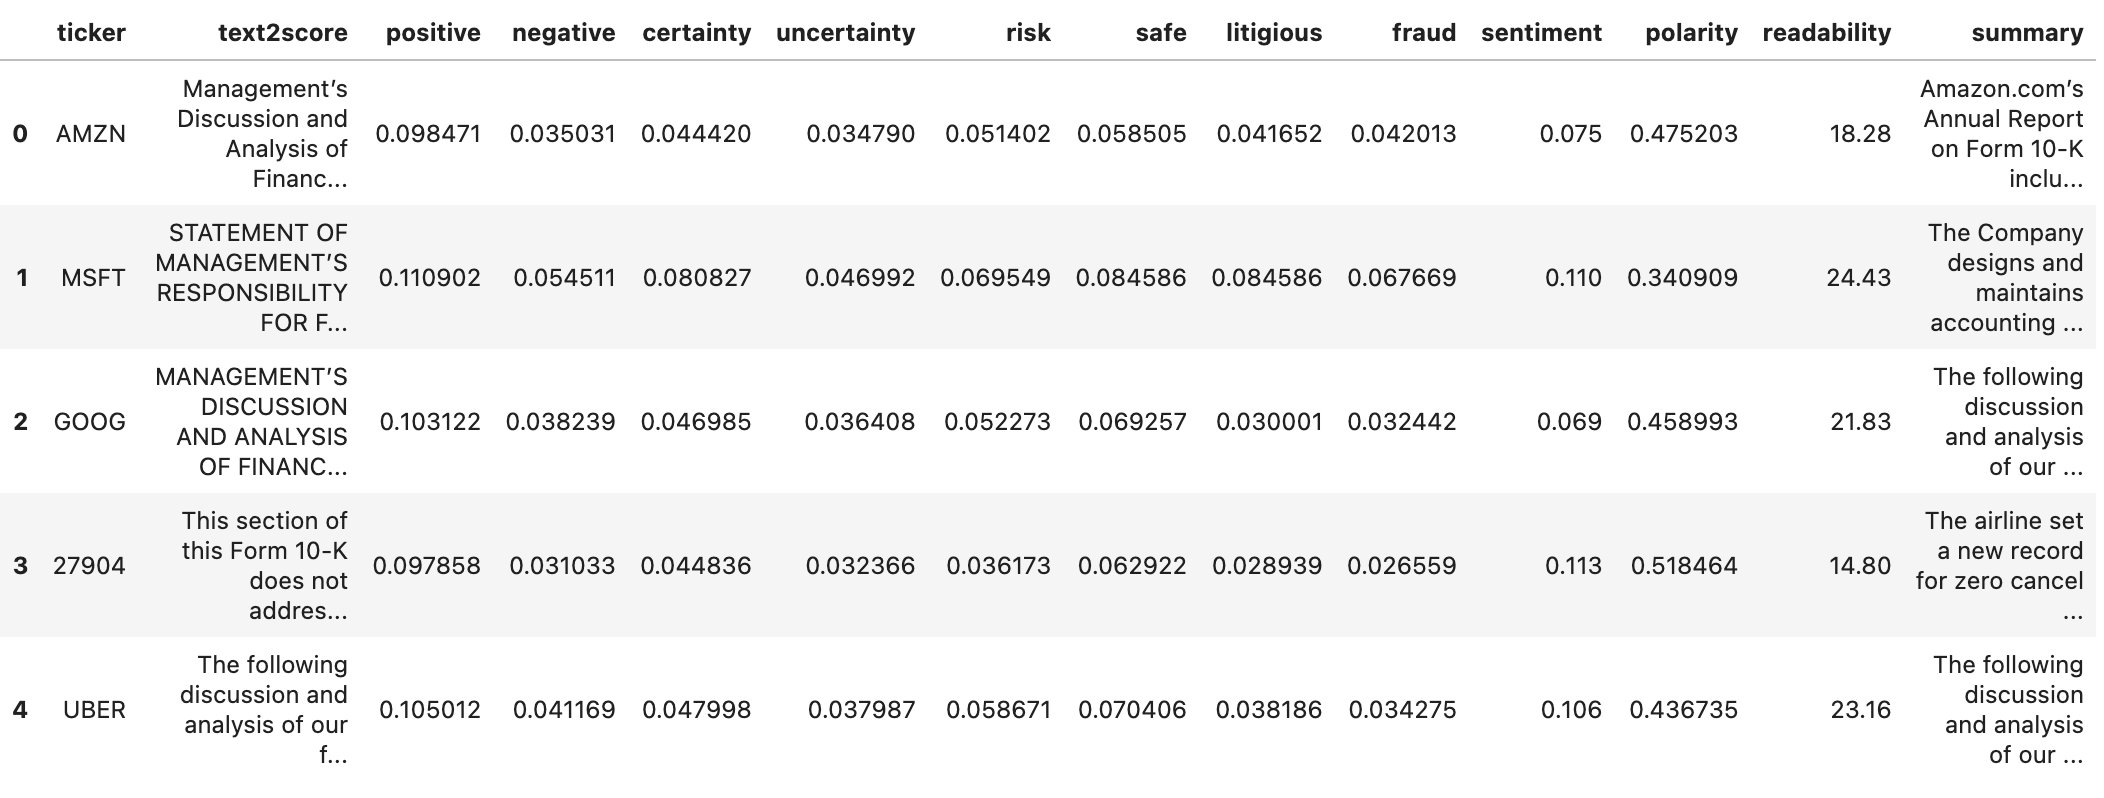
The dataframe is now extended with an additional summary column. Note that an abstractive summarizer restructures the text and loses the original sentences. This is in contrast to an extractive summarizer, which retains the original sentence structure.
The code for this is as follows:
You can see the new column added in the following screenshot.
Prepare a dashboard of an interactive screening table and visualize the data
After you curate this dataframe, wouldn’t it be great to interact with it? This can be done in a few lines of code. We need the R programming language, specifically the DT package to get this working. We use this last CSV file to construct the screening table. The file stock_sec_scores.csv is the same as all_scores.csv except without the text2score and summary columns.
Use the following code in R to construct the dashboard:
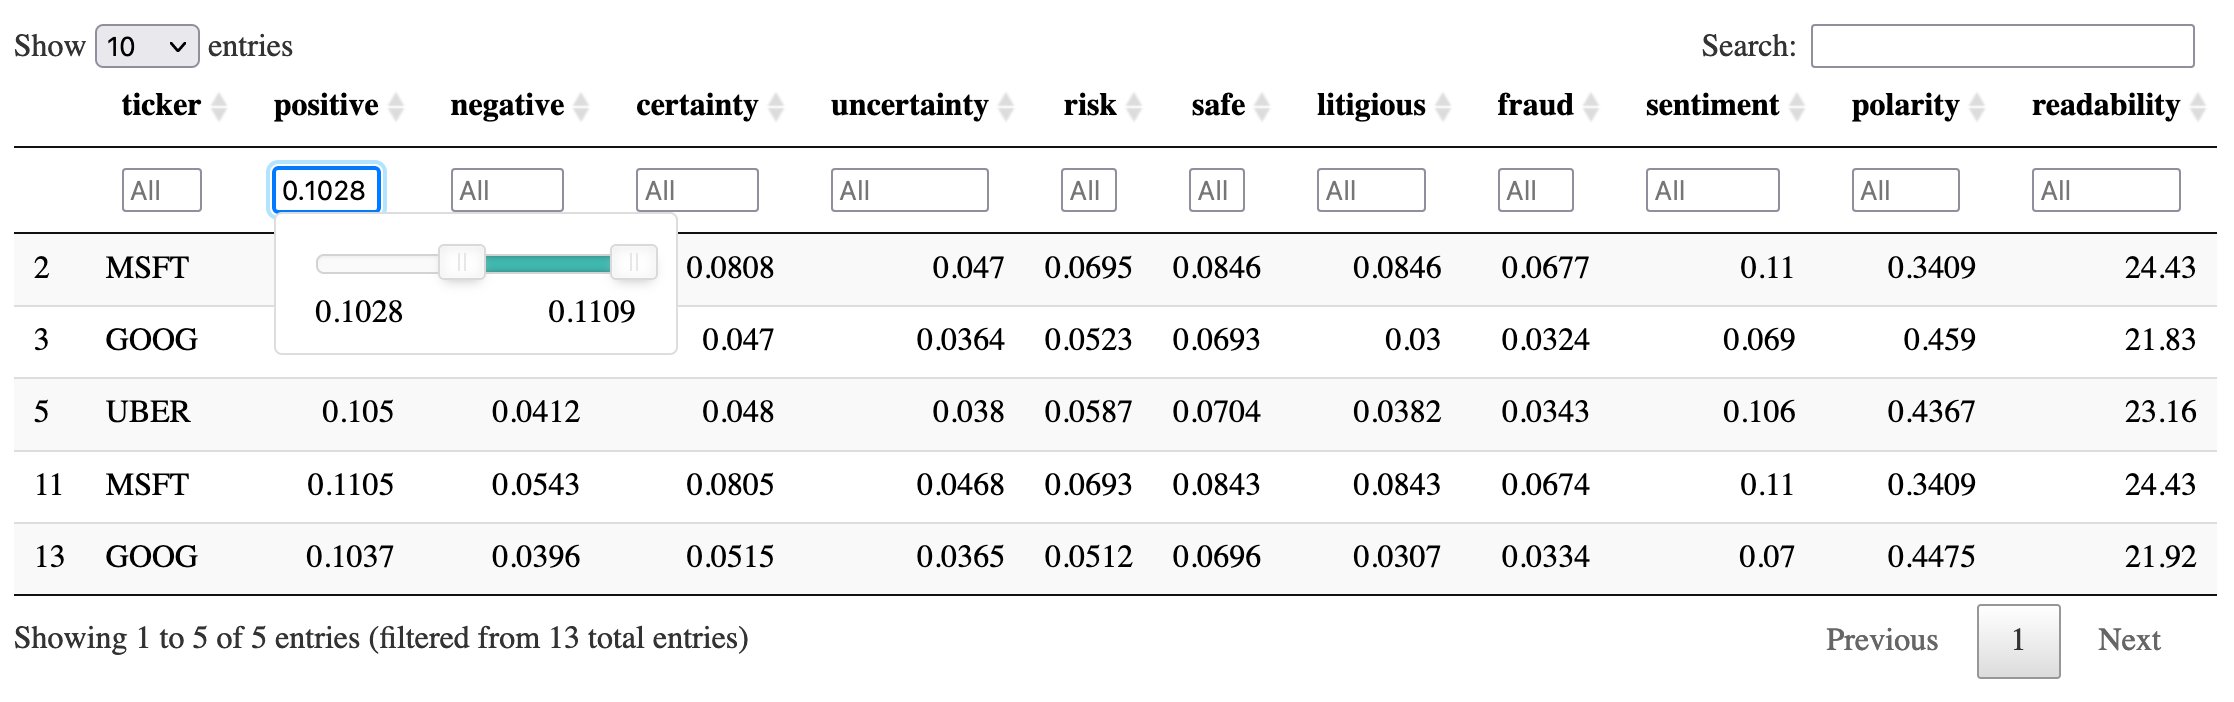
This is saved as an HTML file, and you can choose the file in Studio and open it in your browser. Then you can filter, sort, and search the table interactively in your browser. Both search boxes and sliders provide interactivity.
The following is a sample table with example numbers, which are only for illustration.
A comparison of scores from two documents is obtained using a radar plot, for which the function createRadarChart is provided in the helper notebook. This is useful to compare two SEC filings using their normalized (min-max scaling) NLP scores. The scores are normalized using min-max scaling on each NLP score. See the following code:
The radar plot shows the overlap (and consequently, the difference) between documents on various attributes.

Conclusion
In this post, we showed how to curate a dataset of SEC filings, use NLP for feature engineering on the dataset, and present the features in a dashboard.
To get started, you can refer to the example notebook in JumpStart titled Dashboarding SEC Filings. You can also refer to the example notebook in JumpStart titled Create a TabText Dataset of SEC Filings in a Single API Call, which contains more details of SEC forms retrieval, summarization, and NLP scoring.
For an overview of financial ML tools in JumpStart, see Amazon SageMaker JumpStart introduces new multimodal (long-form text, tabular) financial analysis tools.
For related blog posts with use cases to start with, see Use SEC text for ratings classification using multimodal ML in Amazon SageMaker JumpStart and Use pre-trained financial language models for transfer learning in Amazon SageMaker JumpStart.
For additional documentation, see SageMaker JumpStart Industry Python SDK and Amazon SageMaker JumpStart Industry.
Important:
- This post is for demonstrative purposes only. It is not financial advice and should not be relied on as financial or investment advice.
- This post uses data obtained from the SEC EDGAR database. You are responsible for complying with EDGAR’s access terms and conditions.
About the Authors

Derrick Zhang is a Software Development Engineer at Amazon SageMaker. He focuses on building machine learning tools and products for customers.
 Daniel Zhu is a Software Development Engineer Intern at Amazon SageMaker. He is currently a third-year Computer Science major at UC Berkeley, with a focus on machine learning.
 Bodhisatta Saha is a high-school senior at the Harker School in San Jose, California. He enjoys working on software projects in the areas of social benefit, finance, and natural language.
 Dr. Sanjiv Das is an Amazon Scholar and the Terry Professor of Finance and Data Science at Santa Clara University. He holds post-graduate degrees in Finance (M.Phil and PhD from New York University) and Computer Science (MS from UC Berkeley), and an MBA from the Indian Institute of Management, Ahmedabad. Prior to being an academic, he worked in the derivatives business in the Asia-Pacific region as a Vice President at Citibank. He works on multimodal machine learning in the area of financial applications.