Artificial Intelligence
How NSF’s iHARP researchers are enabling active learning for polar ice analysis using Amazon SageMaker and Amazon A2I
The University of Maryland, Baltimore County’s Bina lab is a multidisciplinary research lab for employing advanced computer vision, machine learning (ML), and remote sensing techniques to discover new knowledge of our environment, especially in the Arctic and Antarctic regions. The lab’s work is supported by NSF BIGDATA awards (IIS-1947584, IIS-1838230), the NSF HDR Institute award (OAC-2118285), and the Amazon ML research award for climate change. Recently, the Bina Lab was awarded by National Science Foundation’s Harnessing the Data Revolution (NSF HDR) to support the institute for Harnessing Data and Model Revolution in the Polar Regions (referred to as iHARP). To learn more and contribute to ML research activities, visit iHARP’s website at i-harp.org.
iHARP collaborates actively with NASA, Amazon Research, and AWS to conduct advanced research in data analysis and modeling in the Arctic and Antarctic regions using data science, ML, and AI. The team of scientists at iHARP, under the leadership of Dr. Maryam Rahnemoonfar and Dr. Masoud Yari, are working to uncover data insights on trends related to the thickness of the ice sheets, the level of snow accumulation, and the melt velocity. All of these factors provide important indicators on climate change patterns. The process of data collection and preparation continues to be highly labor intensive in spite of significant technological advancements in remote sensing techniques. The challenges are exacerbated by the need to sift through massive volumes of images collected over years to detect meaningful pattern changes. Furthermore, images of varying quality introduce degradation in the analysis process. While training local semantic segmentation and contour detection models, the iHARP researchers were unable to extract the layer boundary and contour predictions with the accuracy they needed in spite of comprehensive image preprocessing tasks.
With the democratization of technologies making it possible to run deep learning training in the cloud at a fraction of the cost and time compared to on-premises, the iHARP researchers decided to build their ML workflows on Amazon SageMaker. This enabled the team to address scalability requirements, improve their existing auto-labeling models, and accelerate active learning with human in the loop, which enabled collaboration among domain scientists and data scientists. The end goal was to make polar ice layer tracking more accurate and less time-consuming. In this post, we document the results of the collaboration between researchers at iHARP and AWS to solve the Arctic ice analysis use case. Specifically, we walk you through the following topics:
- What is Arctic ice analysis?
- An approach for using ML for Arctic ice analysis
- Scalable ML with SageMaker
- Active learning workflow with Amazon Augmented AI (Amazon A2I) and SageMaker
What is Arctic ice analysis?
Glaciology is a branch of environmental science focusing on ice and its properties. 71% of our planet is made up of water, so ice has an important role to play in impacting the global climate (more on the topic can be found in Six ways loss of Arctic ice impacts everyone). The melting of polar ice caps (Arctic and Antarctic) leads to our planet being exposed to increased heat because we now have less ice to reflect heat back into space. When ice melts, it causes an increase in sea level rise (SLR), which is a global concern. Rising water levels can lead to dangerous floods, especially in coastal areas and islands.
Per a United Nations 2019 study, people have an average life span of 72.6 years. Our time on this planet is limited. According to the article Ice core basics, we have access to ice core (cylindrical blocks drilled through ice sheets, with the youngest ice layer on top and the oldest layer at the bottom) records that go back by at least 800,000 years. For research to be effective, we need to access and analyze as much data as we can to uncover relationships between ice layer pattern changes and past climatic events. However, it is mathematically impossible for us to analyze all the data available. This is where ML and AI come in to lend a neural net or two to speed things up!
So, what do we really mean by analysis of ice data? It is the labor-intensive process of going through millions or even billions of radar, spectroscopic, photographic images, tabular data, and climatology data to map out ice layers, look for changes in ice layers over time, identify climatic events, and find patterns that prove the relationship between what happens to ice and its effect on the climate. To accelerate this task, we need a powerful computer, the ability to read, understand, and interpret images, the ability to look for seemingly minuscule changes in these images that happen gradually through thousands of images, the ability to relate these changes to events noticeable in mathematical, tabular, and sensor readings, and more. With the recent advancements in ML algorithms and techniques, and the availability of supercomputers at a fraction of the cost with cloud computing, scientists are eager to take advantage of cloud-based ML to explore and mine Arctic and Antarctic data.
One of the first and perhaps most important steps in the Arctic ice analysis process is to distinguish the different layers of ice with considerable accuracy. This is because this step informs the rest of the steps in the process. We can achieve this by training an ML model using supervised learning to detect ice layers from radar images, for example. To get to the accuracy we need, we require large amounts of annotated data. The challenge was not the availability of data; there is a large amount of heterogeneous radar data from the polar regions that has been gathered through expensive missions. However, during our experimentation, we realized that the quality of annotations for this data wasn’t sufficient to train a model with the accuracy we needed. In the next few sections, we walk you through how we solved this challenge.
An approach for Arctic ice analysis using ML
In the IEEE Big Data conference in 2019, our researchers, Dr. Maryam and Dr. Masoud, along with colleagues from University of Kansas and University of Colorado, published the paper Smart Tracking of Internal Layers of Ice in Radar Data via Multi-Scale Learning. This paper detailed experimentation using ML, specifically edge detection models using multi-scale deep learning models (such as Holistically-Nested Edge Detection (HED)), to track the layer boundaries in radar images of ice layers. The extended version of this research is published in Deep multi-scale learning for automatic tracking of internal layers of ice in radar data in the Journal of Glaciology in 2020.
NASA has been gathering data from polar regions for many decades. NASA’s ICESat and ICESat-2 and Operation IceBridge are prominent examples of those efforts. Operation IceBridge was conducted as a bridge between the two ICESat missions for 11 years to collect polar surveys using airborne sensors, such as radar. The benefit of using radar sensors is that its waves can penetrate underneath the ice surface. However, this data represents a snapshot in time, and is tied to geospatial coordinates. Operation IceBridge provided petabytes of publicly available raw data, and manual analysis was a huge challenge. For example, the following figure displays a radar image segment that was collected in Greenland in 2012. The horizontal direction is the flight track, and the vertical direction is the depth of snow. The units per image pixel are displayed on the image.

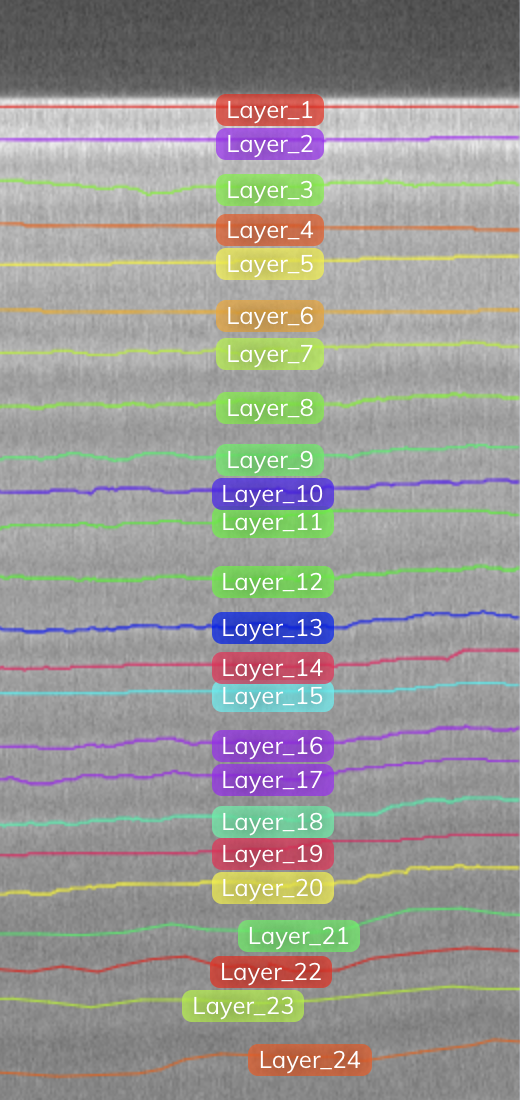
The following figure shows the same image with the layer annotations that were drawn manually. The very first boundary line (marked as Layer-1) is the snow surface; each consecutive layer underneath it represents the annual accumulation of snow in previous years. Our goal is to detect the layers and eventually calculate the thickness of layers, but this was only for one segment of just one frame! We wanted to be able to scale and map the ice layers across all of Greenland!

Essentially, we want our models to be able to predict all the layers, as depicted in the following figure (which includes the original image and an annotated image of all the layers). This is an example of an image with very tight and faded layers. However, there are other problems to watch out for, such as noise and artifacts, the discussion of which is outside the scope of this post.
 |
 |
In summary, in their IEEE 2019 and JOG 2020 paper, the researchers recorded the following observations from their experiments on the efficacy of using deep learning for radar image labeling:
- Most of the well-known deep learning approaches work very well on normal images, but weren’t found to produce acceptable results in the presence of noise. The fact that deep learning models aren’t robust with respect to noise is discussed in various works.
- Transfer learning approaches don’t work well for radar images, whereas training from scratch yields far better results.
- Training from scratch requires annotated data provided by the domain experts. Generating good synthetic data might be a solution for lack of annotated data.
Based on these observations, we realized we needed to account for certain considerations:
- Our dataset during experimentation would be of low size (approximately 5,000 images). However, we needed to future proof the architecture to scale on demand.
- We needed to weave in our existing semi-automatic solution for layer tracking (using the model mentioned in the IEEE paper).
- The approach should use a partially annotated dataset we had (we don’t have the time or resources to human annotate the dataset fully).
- We needed the ability to deploy an active learning framework such that the model can evolve by using feedback from human reviewers. The active learning approach would find a middle ground allowing domain scientists to modify model predictions.
The end goal was of course to maximize the model accuracy in layer predictions.
Scalable ML with SageMaker
SageMaker is a fully managed ML service. SageMaker provides an integrated Jupyter environment for authoring and experimentation, and a web-based visual interface called SageMaker Studio, where you can perform all ML development steps with complete access, control, and visibility. SageMaker provisions and manages the infrastructure required for training and hosting. SageMaker also provides common ML algorithms that are optimized to run efficiently against extremely large data in a distributed environment. With native support for bring-your-own-algorithms and frameworks, SageMaker offers flexible distributed training options that adjust to customized workflows. Training and hosting are billed by minutes of usage, with no minimum fees and no upfront commitments.
We found SageMaker well suited for our requirements due to its ability to scale, its flexibility in supporting our custom ML algorithms, the fact that we could get started quickly due to ease of use, and more importantly the ability to set up active learning using Amazon A2I. To continue experiments with our semantic segmentation model using SageMaker, we designed the following architecture.
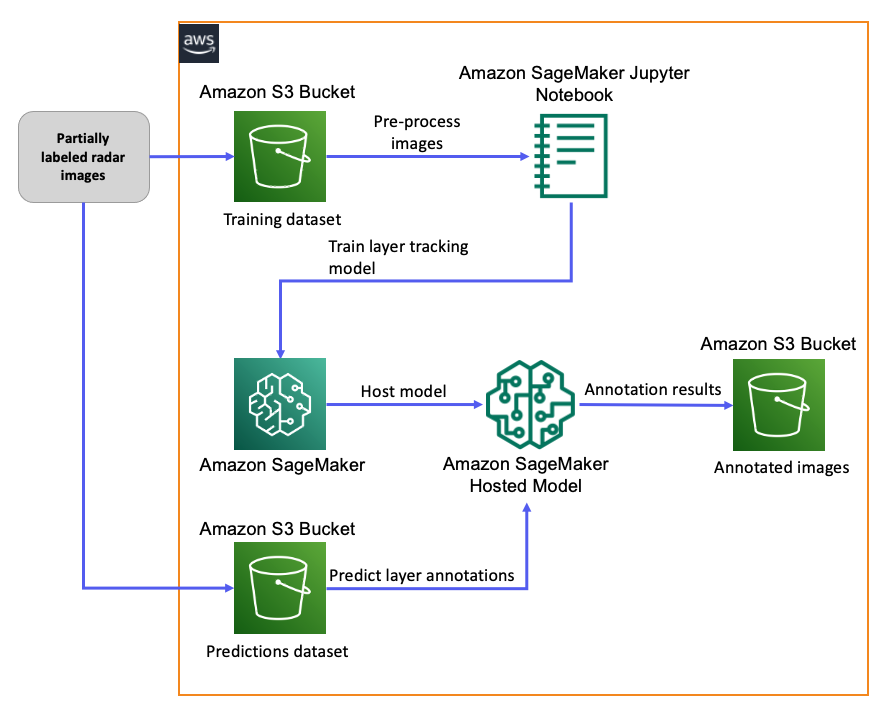
Download and preprocess images
We use publicly available data. For training our model, we used radar data available on the National Snow & Ice Data Center. Partial annotations of the ice layers are available for use. However, not all layers are present in the annotation, which may skew the results. As a first step, we downloaded the raw dataset into an Amazon Simple Storage Service (Amazon S3) bucket. We provisioned a SageMaker Jupyter notebook, with which we retrieved the images, and converted them into the RecordIO format, which optimizes storage and enables streaming data in pipe mode for faster training. The RecordIO files are then uploaded back to Amazon S3 as train and test datasets.
Train the multi-scale layer tracking model on SageMaker
We created a Python file as an entry point that contained the code for our multi-scale layer tracking algorithm. We used the SageMaker MXNet estimator as a wrapper for our CNN, and we used the SageMaker Python SDK for initializing the estimator, configuring the hyperparameters, and running the training. We performed hyperparameter optimization with the SageMaker automatic model tuner to determine the optimal settings that gave us the best results.
Host the model on SageMaker and run predictions
When the model training was complete, the artifacts were automatically sent to an S3 bucket by SageMaker. Before we could run bulk prediction of annotations for our images, in the experimental stage we wanted to set up a real-time endpoint, run tests on prediction quality, and enable active learning. To set up real-time inference, we first created the model package, then created an endpoint configuration that specified the instance type we wanted for hosting, along with details on whether we wanted to run multiple versions at the same time. We didn’t select this option as we were in the experimental stage, but for more details, see Deploy a Model in Amazon SageMaker. Finally, we created the endpoint. For running predictions, we used a preprocessed test dataset of images that we sent to the hosted endpoint. The model returned the JSON annotations for the layer boundaries from our input image, and we persisted the annotation coordinates and the image into an S3 bucket.
Of course, bringing our model to SageMaker was the initial step, but this gave us the foundation we needed to quickly innovate and accelerate our experimentation. In the next section, we walk you through how we used Amazon A2I with SageMaker to create a fully functional active learning workflow.
Set up an active learning workflow with Amazon A2I
Amazon A2I makes it easy to add human review into your ML workflow. Amazon A2I provides built-in human review workflows for common ML use cases, such as content moderation and text extraction from documents. You can also create your own workflows for ML models built on SageMaker or any other tools. With Amazon A2I, you can allow human reviewers to step in when a model is unable to make a high-confidence prediction or audit its predictions on an ongoing basis. Amazon A2I provides pre-built templates to create task UI pages for reviewing audio, images, text, and video, and you can customize the templates for your needs. For our use case, we created a custom liquid template using a crowd-polyline element. This enabled implementation of active learning because human reviewers (our researchers) could now interact with a task UI (a webpage) to complete the following steps:
- Evaluate the original partially annotated input image.
- Compare the predicted annotations from the model with the original partially annotated input image.
- Use the interactive task UI to update or modify the predicted annotations and image, and submit for retraining.
First, we walk you through how to set up a human review with Amazon A2I. Then we show you how to enable retraining and complete the active learning workflow.
Create a worker task template
First ensure all Amazon A2I prerequisites are met. This includes setting up S3 buckets for input and output, AWS Identity and Access Management (IAM) roles, and a workforce for the human review workflows.
Next, we create the task UI using a worker task template in SageMaker. The worker task template is an HTML file that allows the UI to be tailored to fit the human review use case. To get started, SageMaker includes a wide range of HTML components for building a custom worker UI. For this use case, we need the reviewer to be able to update line segments on the UI that correspond to snow layers in an image. We chose to use the crowd-form and crowd-polyline elements. The crowd-form element provides basic controls for the UI, such as submitting results. The crowd-polyline element allows the user to interact with line segments on the UI, which is used to fit lines on the individual snow layers.
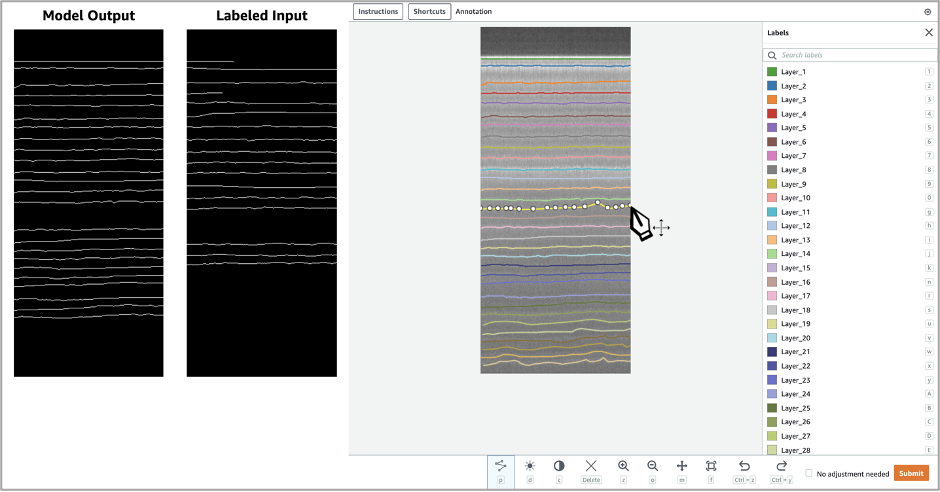
Now that we have identified the UI components to use, we need to include the model data to interact with via the UI. The crowd-polyline component includes fields for populating the initial value, labels, and source image. These fields are used to populate the snow layer data as well as the image of the snow layers. After the worker UI is rendered, the reviewer can edit and add additional line segments. To aid the reviewer, we also included the original model output and labeled input images alongside the crowd-polyline editor.
The following screenshot shows the task UI when activated.
The following is a code snippet of the template:
Create the human review workflow
With the task template complete, we move on to creating the human review workflow. This specifies the following:
- The workforce that tasks are sent to
- The task template created in the previous step
- The result output location
We can create the workflow via API or the Amazon A2I console. See Create a Human Review Workflow for details.
Start human review loops
At this point, we have our task template and human review workflow created, which defines how we want our review UI to look and function. Starting human review loops is the last step in the Amazon A2I process. For each set of labeled data and images, we create a human review loop to create the environment for our workforce reviewers. See Create and Start a Human Loop for a Custom Task Type for details.
The individual reviewers create an account and log in to perform any reviews that have been created. Then they select from a list of tasks assigned to them, as seen in the following screenshot.
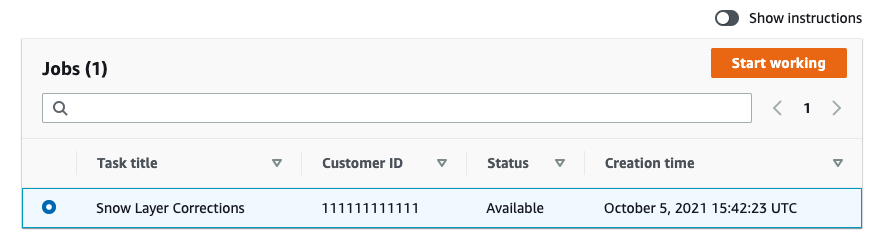
After selecting a task, they see the task UI that was built using the custom HTML components. Finally, the user submits their updates after fitting the polylines to the snow layers.

Enable retraining
The following diagram shows the updated architecture with active learning implemented.
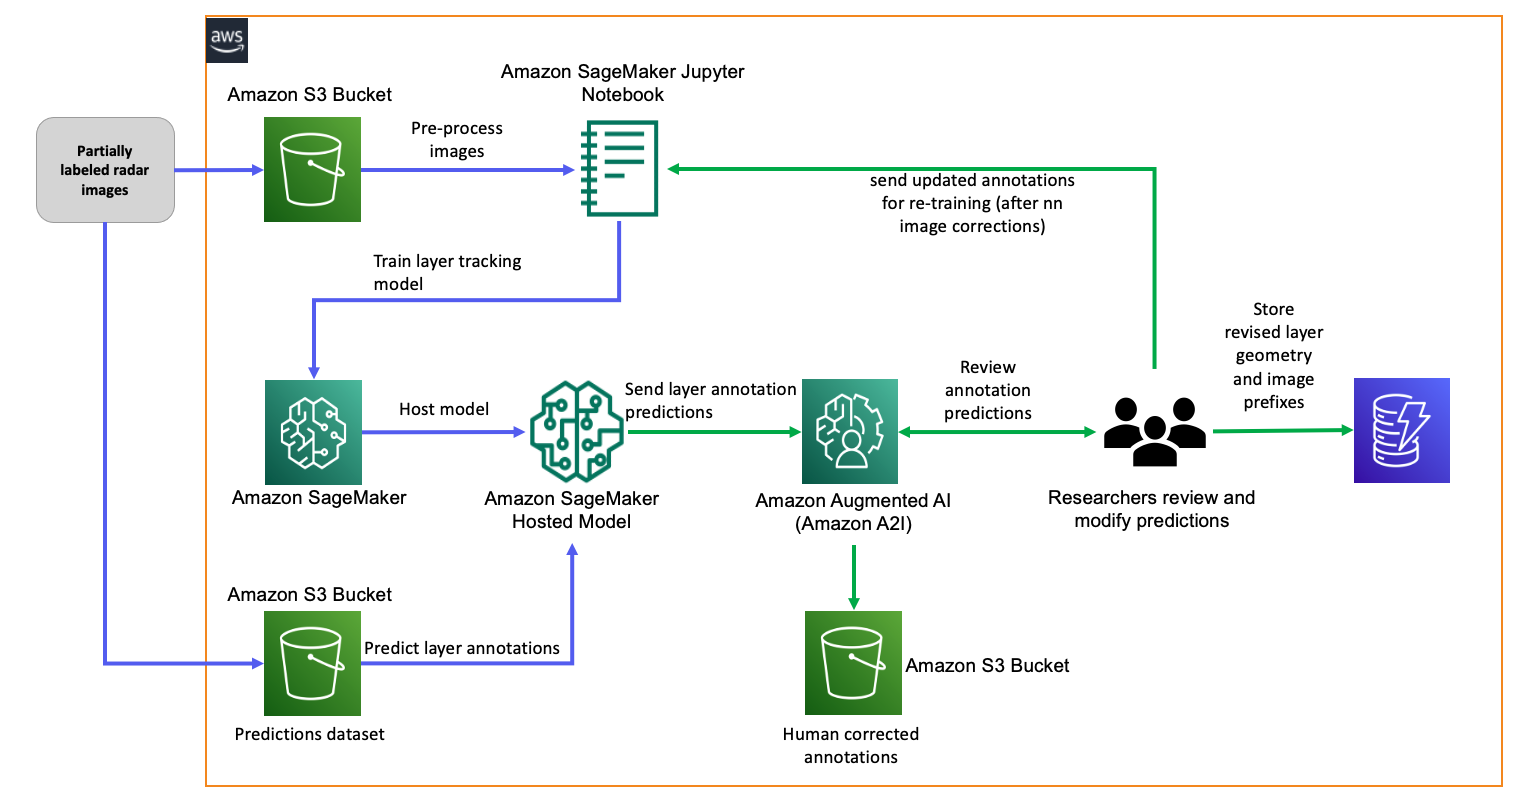
Now that the human review loop is in place to modify annotations, we need to send the results back to the process for implementing automated retraining after a critical mass of images have been corrected by the reviewers. When we complete this step, our architecture is fully enabled for active learning. In our case, we decided that retraining should be triggered after every 100 image corrections. The images with the corrected annotations overlaid are stored in an S3 bucket, and we also store the annotation coordinates along with their corresponding S3 image prefix in an Amazon DynamoDB table for easy retrieval and indexing.
Conclusion and next steps
In this post, we walked through how we used SageMaker and Amazon A2I to set up an active learning ML workflow for improving annotation accuracy of Arctic ice layer tracking. This is an ongoing experimentation for us, and we plan to publish a companion post to share the results in the form of a highly accurate annotated dataset of polar ice layers. We are always on the lookout for collaborators, so if this sounds interesting, look us up at i-HARP.org or leave us feedback in the comments.
About the Authors
 Prem Ranga specializes in ML and AI at AWS with a passion in helping customers solve NLP, CV and deep learning problems. Prem built the Alexa controlled beer stations in Houston and other locations. Prem is a Packt author. You can read about this and other publications at https://www.linkedin.com/in/premkr/
 Dr. Masoud Yari is a research professor at iHARP Data Science institute and Bina lab at College of Engineering and Information Technology, University of Maryland, Baltimore County, MD. His research interests include machine learning, computer vision, remote sensing, mathematical modeling, and dynamical systems. He is passionate about discovering actionable insights in data and leading interdisciplinary research teams and projects to solve environmental and humanitarian problems.
 Brett Seib is an AWS Enterprise Solutions Architect based out of Austin, TX. He is passionate about innovating and solving business challenges with customers. Brett has several years of experience in the IoT and Data Analytics industries helping customers innovate with data.
 Morgan Dutton is an AWS Technical Program Manager with the Amazon Augmented AI and Mechanical Turk team based in Seattle, WA. She works with academic and public sector customers to accelerate their use of human-in-the-loop ML services. Morgan is especially interested in collaborating with academic customers to support adoption of ML technologies by researchers, students, and educators.
 Maryam Rahnemoonfar, Ph.D., is the PI and Director of NSF data science institute-iHARP, Director of Computer Vision and Remote Sensing Laboratory (Bina lab), and Associate Professor of AI and Data Science at College of Engineering and Information Technology, UMBC. Her research interests include Deep Learning, Computer Vision, Data Science, AI for Social Good, Remote Sensing, and Document Image Analysis. Her research projects have been funded by several awards, including the NSF HDR institute Award, NSF BIGDATA award, Amazon Academic Research Award, Amazon Machine Learning award, Microsoft, and IBM.