AWS Cloud Operations Blog
Monitoring Data Ingestion Tasks with Amazon CloudWatch Metrics and Alarms
Data is produced every day in increasing volumes and varieties in on-premises and cloud environments. Data ingestion into AWS is a common task and there are many services and architecture patterns that customers use to bring in data. In this post, we provide a guide for establishing monitoring and alerting on a data ingestion workload using the Amazon CloudWatch embedded metric format.
Telemetry is a vital component that must be included when designing your data ingestion workloads. To help our customers design for operational excellence, AWS has created services and mechanisms to emit and collect logs, metrics, and traces to enable you to understand the internal state and health of the workload. Amazon CloudWatch launched the embedded metric format in November 2019, which enables the ingestion of complex high-cardinality application data in the form of logs. These logs in the embedded metric format can be used to easily create custom metrics without having to use multiple libraries or maintain separate code.
This post includes an architecture of a common data ingestion pattern and an enhanced monitoring approach using the CloudWatch embedded metric format. We also provide a link to the open-source GitHub repository containing the AWS CloudFormation template and steps to create the solution in your own account.
Solution overview
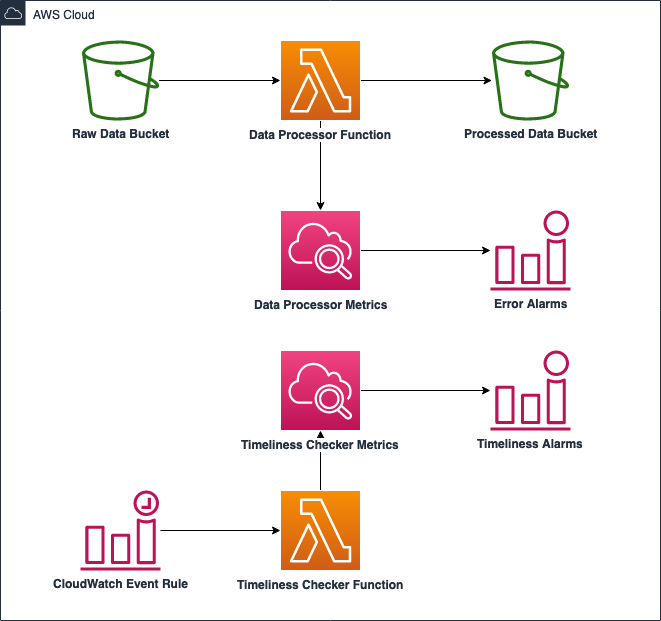
Figure 1: Objects are uploaded into Amazon S3. An S3 Event Notification triggers an AWS Lambda Function. The Lambda Function ingests the object and creates custom Amazon CloudWatch metrics. The Timeliness Checker Function runs on an interval and populates Timeliness Checker Metrics.
Walkthrough
In the architecture provided, JSON files from two vendors are uploaded to the raw Amazon Simple Storage Service (Amazon S3) bucket. The files are partitioned by the vendor name and the date. After a vendor file is uploaded, an S3 event triggers an AWS Lambda function which reads the JSON file, performs validation checks, and writes to the processed S3 bucket if the data fields and types are valid.
Vendor A JSON Sample:
Vendor B JSON Sample:
This solution provides monitoring for the following scenarios:
- Errors
- KeyError or TypeError from data quality checks
- Any other exceptions raised in the Lambda function for data processing
- Successful file ingestion within expected timeframe for each vendor
- Vendor A = at least one file ingested in the past 1 hour
- Vendor B = at least one file ingested in past 24 hours
Steps
These are the high-level steps and components needed to build the solution in your own account. The following sections have details and screenshots for reference.
- Create the CloudFormation stack.
- View CloudWatch Alarm for alerting on exceptions raised in Lambda data processor function.
- View Lambda function instrumentation.
- View Lambda function for monitoring the file ingestion within the expected timeframes.
The GitHub repository containing the scripts and templates required to build the solution is located here.
To avoid unexpected charges, make sure to follow the clean-up procedures at the end of this post.
Prerequisites
The following prerequisites are required for this post:
- An AWS Account
- AWS Command Line Interface (AWS CLI) installed and configured. User guide here.
- AWS Serverless Application Model (SAM). Overview and user guide here.
- An Amazon S3 Bucket for storing SAM-generated packaged templates. Overview here.
Create the CloudFormation stack
The following commands can be used to deploy the solution into your AWS account:
- Configure the AWS CLI with your AWS account and preferred region. Refer to the guide here for different methods and detailed instructions.
- Run the following command to initialize the AWS SAM project from the GitHub source:
- Run the following command which processes the AWS SAM template file, application code, and dependencies:
- Run the following command to package the AWS SAM application as a .zip file and upload to Amazon S3:
- Run the following command to deploy the AWS SAM application which includes all of the required infrastructure:
View CloudWatch Alarm for alerting on Data Processor Function errors
Once the solution infrastructure has been deployed, you should be able to navigate to the CloudWatch service and see three different CloudWatch alarms. The CloudWatch alarm in the following screenshot enters the ALARM state if one or more errors occur in the past five minutes for the Lambda function which processes the data.
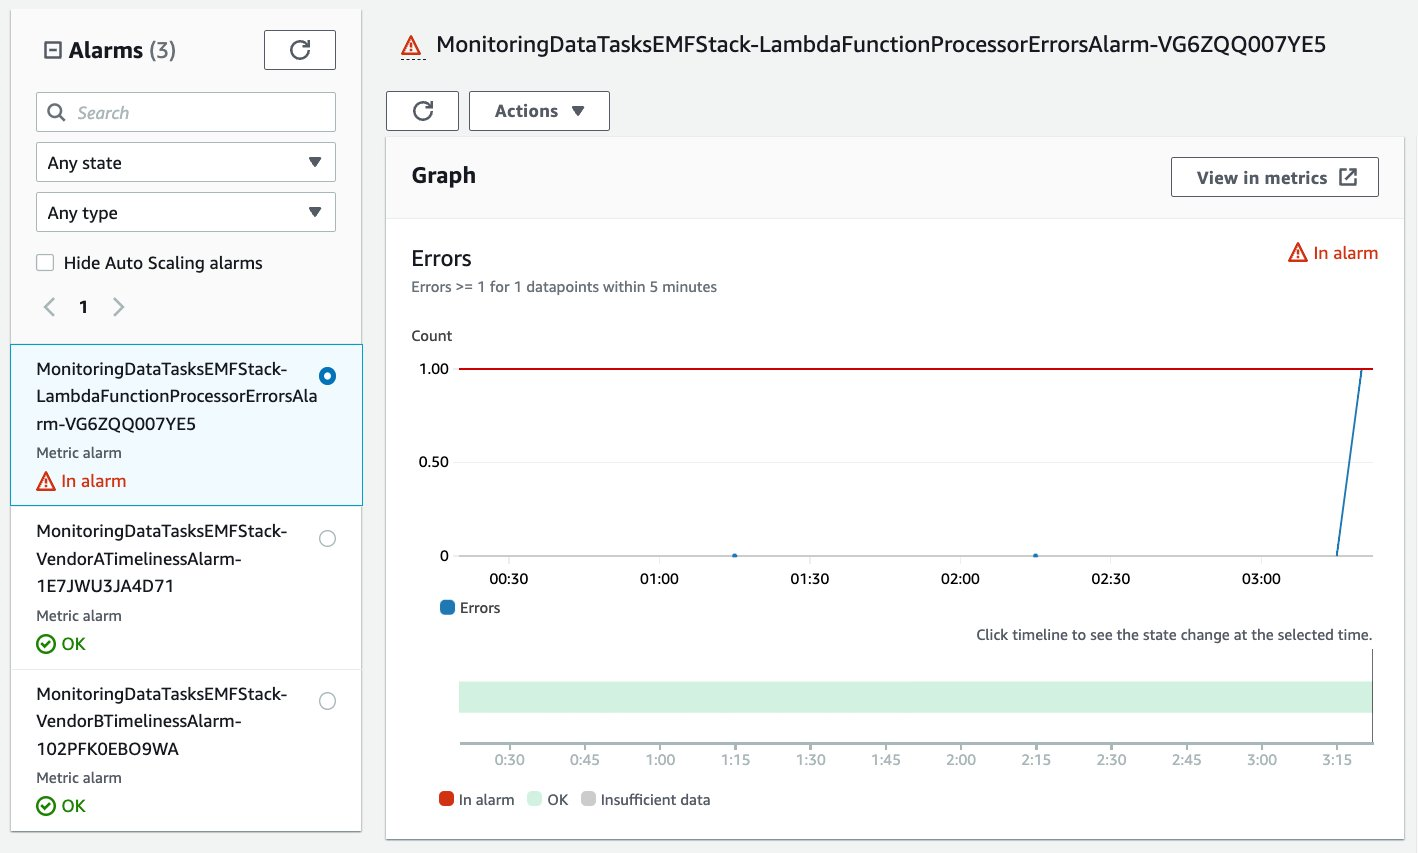
Figure 2: The CloudWatch alarm is in the ALARM state due to an error encountered in the last five minutes
In this example, a KeyError exception was raised when the Lambda function was processing a data file which was missing the required key “object_id” and contained an invalid key. The CloudWatch metric for this Lambda function’s error triggered the CloudWatch alarm. The following is part of the traceback uploaded to CloudWatch Logs.
View Lambda function instrumentation
There are several methods you can use to generate logs in the CloudWatch embedded metric format. In this solution, the client library for Python is used to generate the logs and send to CloudWatch. The list of available languages that Amazon has created open-sourced client libraries for, and instructions on how to use them, are located here. Alternatively, you can manually generate the log using the specified format and leverage the PutLogEvents API or use the CloudWatch agent to send the embedded metric format logs.
In the following code snippet, the metric_scope decorator from the aws_embedded_metrics library is used on the Lambda function’s handler to get a metric logger object. The dimension is set to the ingestion data source for the metric, which in our solution would be either vendor_a or vendor_b. The put_metric call adds the Success metric of 1 to the current logger context. Note that when additional dimensions are added, every distinct value will result in a new CloudWatch metric. If the cardinality of a particular value is expected to be high, then you should consider using set_property instead.
The following screenshot displays the graphed metric of Vendor A’s successful data processing over the span of a week.
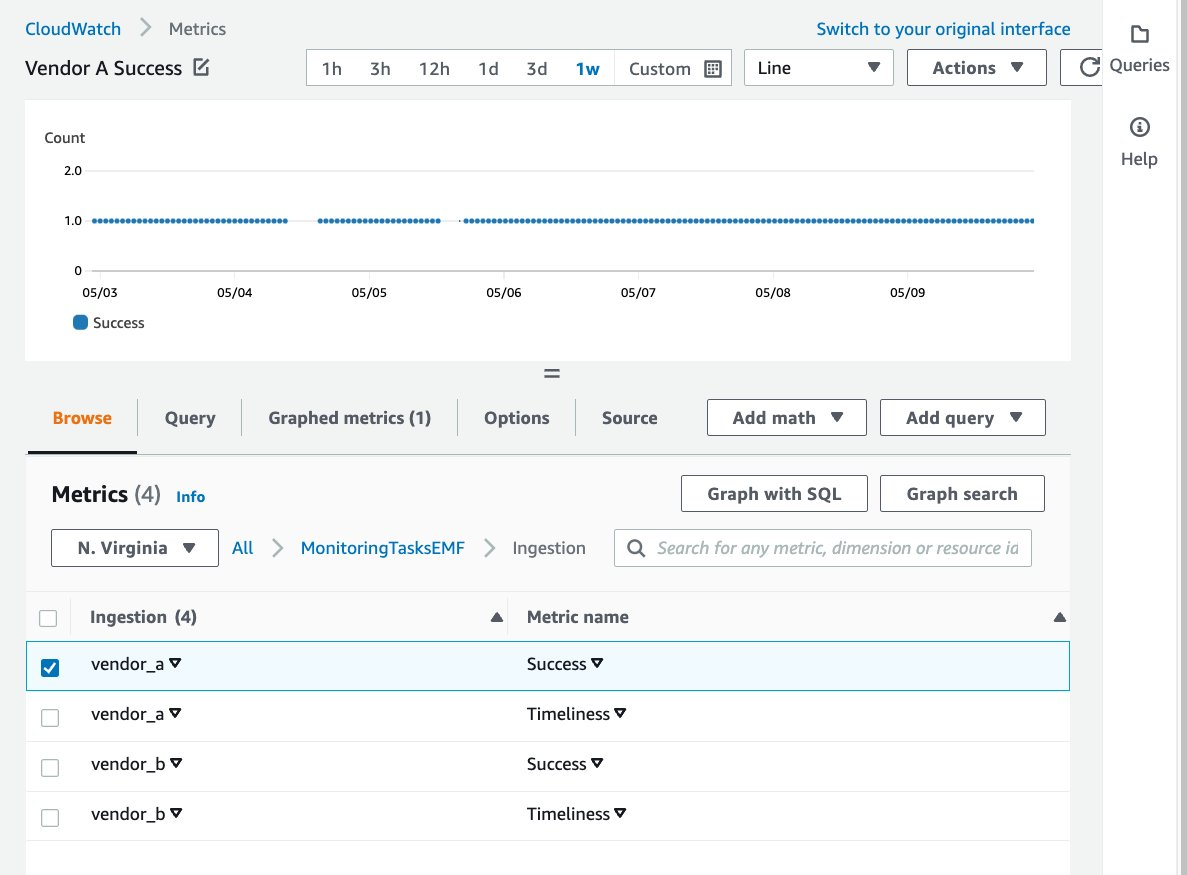
Figure 3: The graphed metric of Vendor A’s successful data processing over the span of a week
The following screenshot displays the graphed metric of Vendor B’s successful data processing over the span of two weeks.
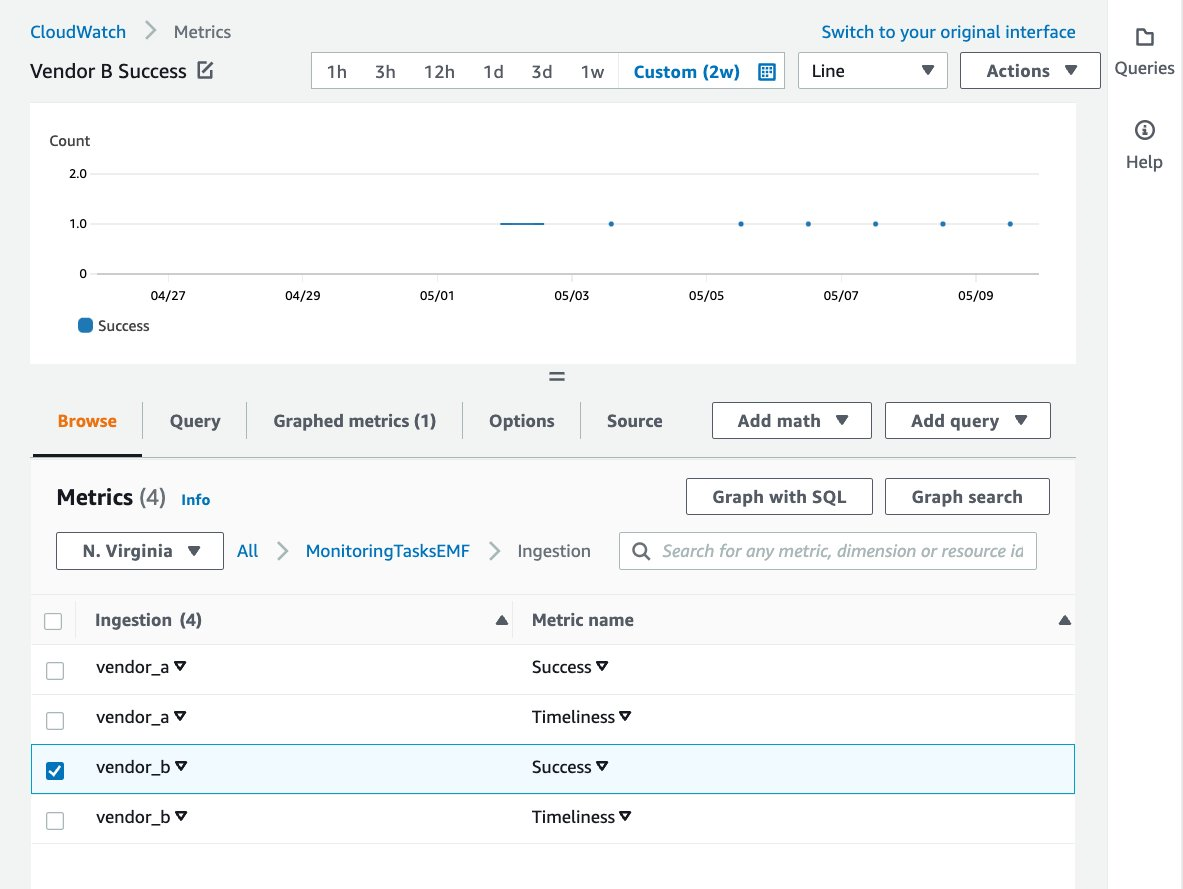
Figure 4: The graphed metric of Vendor B’s successful data processing over the span of two weeks.
The following is the log output from CloudWatch Logs for the data processing Lambda function which successfully ran. You can see the format and additional context injected into the log from the embedded metric format client library.
CloudWatch Logs Insights enables you to interactively search and analyze your log data in CloudWatch Logs. The following example shows the daily total count of successfully processed files from vendor_a over the span of a week. See this page for additional information on CloudWatch Logs Insights.
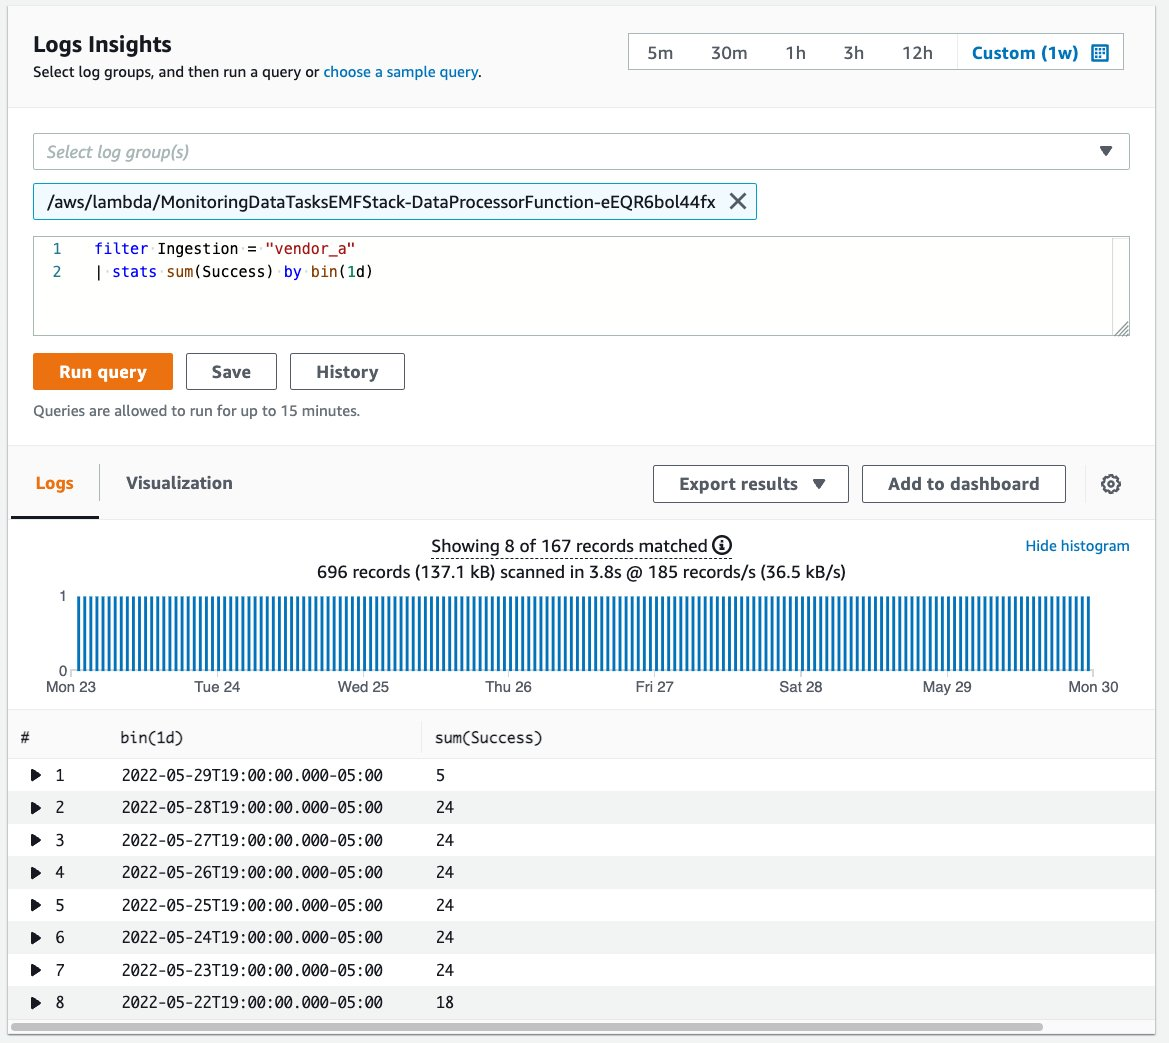
Figure 5: Query interface for CloudWatch Logs Insights displaying results for Vendor A ingestion over the span of one week
View the Lambda function for monitoring ingestion within expected timeframes
This is the expected timeframe for successful file ingestion for each vendor:
- Vendor A = at least one file ingested in the past 1 hour
- Vendor B = at least one file ingested in past 24 hours
The Data Processing Function in the previous section emits the Success metric after each successful run. The Timeliness Checker Function runs every hour, queries CloudWatch for each vendor’s Success metric statistics for their expected timeframes, and emits a Timeliness metric of 1 or 0 with 1 indicating that at least one file has been successfully ingested in the timeframe.
The following is the call to CloudWatch to get the Success metric statistics, which contains an array of “Datapoints” that shows whether or not at least one successful file ingestion has occurred in the expected timeframe.
In the following code snippet, the metric logger is created and used by the function which emits the Timeliness metric. The dimension is set to the ingestion data source which would be either vendor_a or vendor_b. Since the two vendors have different expected timeframes for file ingestion, a property is added to include the timeframe in the logger context. The put_metric call adds the Timeliness metric of 0 or 1.
The following screenshot displays the graphed Timeliness metric for Vendor A over the timespan of almost two days. From the graph, you can see the periods of time in which the data ingestion process for Vendor A failed to meet the Timeliness expectation.
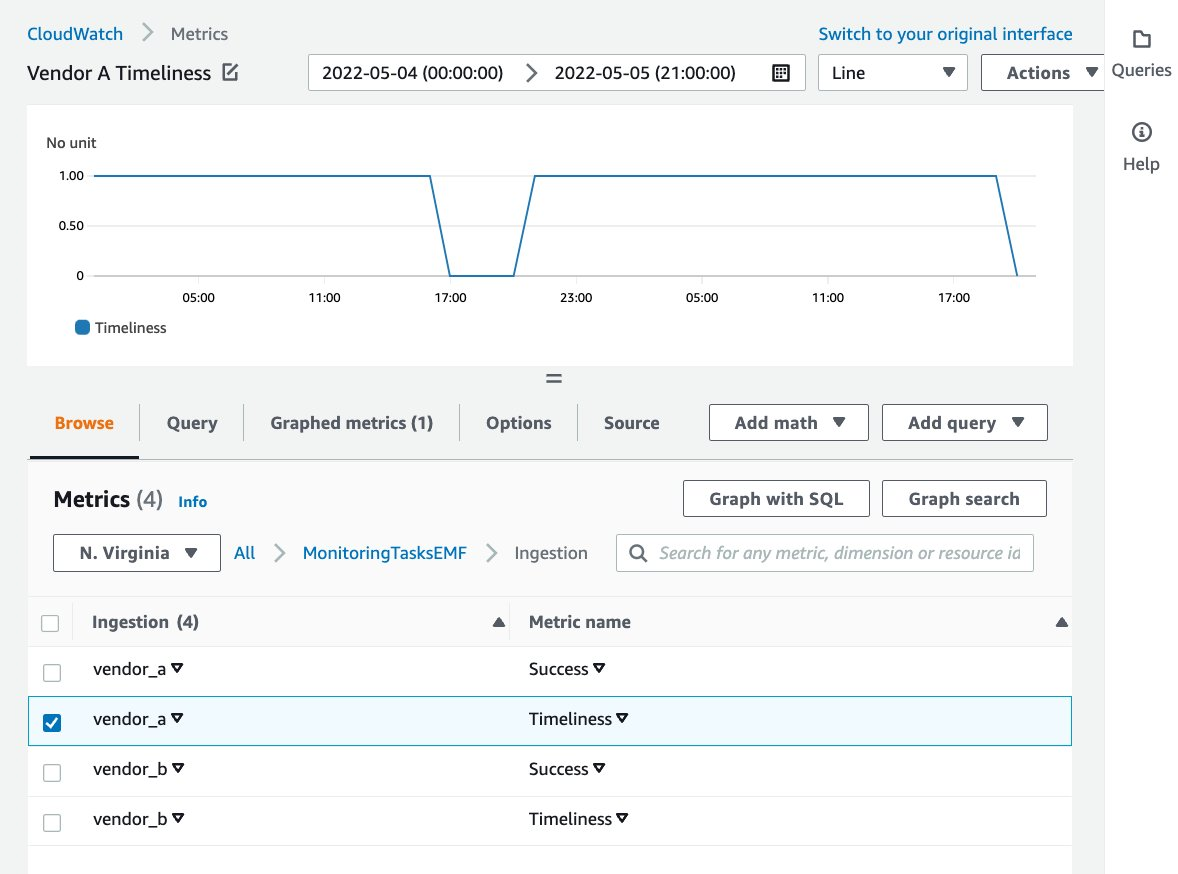
Figure 6: The graphed Timeliness metric for Vendor A over the span of two days
The following screenshot displays the graphed Timeliness metric for Vendor B over the timespan of a week. From the graph, you can see the periods of time in which the data ingestion process for Vendor B failed to meet the Timeliness expectation.
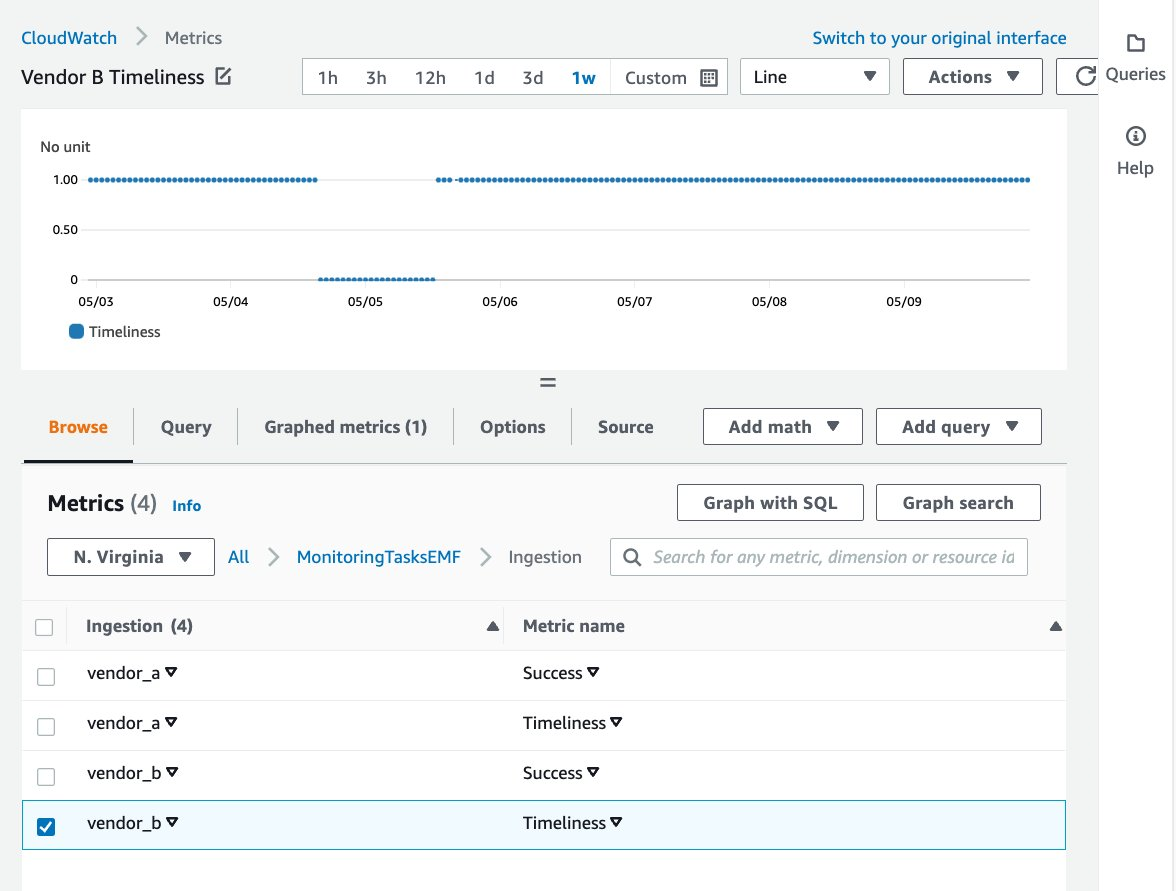
Figure 7: The graphed Timeliness metric for Vendor B over the span of one week
A CloudWatch alarm is created in the solution for each vendor to alarm when the Timeliness expectation has not been met. In the following you can see the Alarm set off due to a Timeliness metric of 0 for Vendor A.
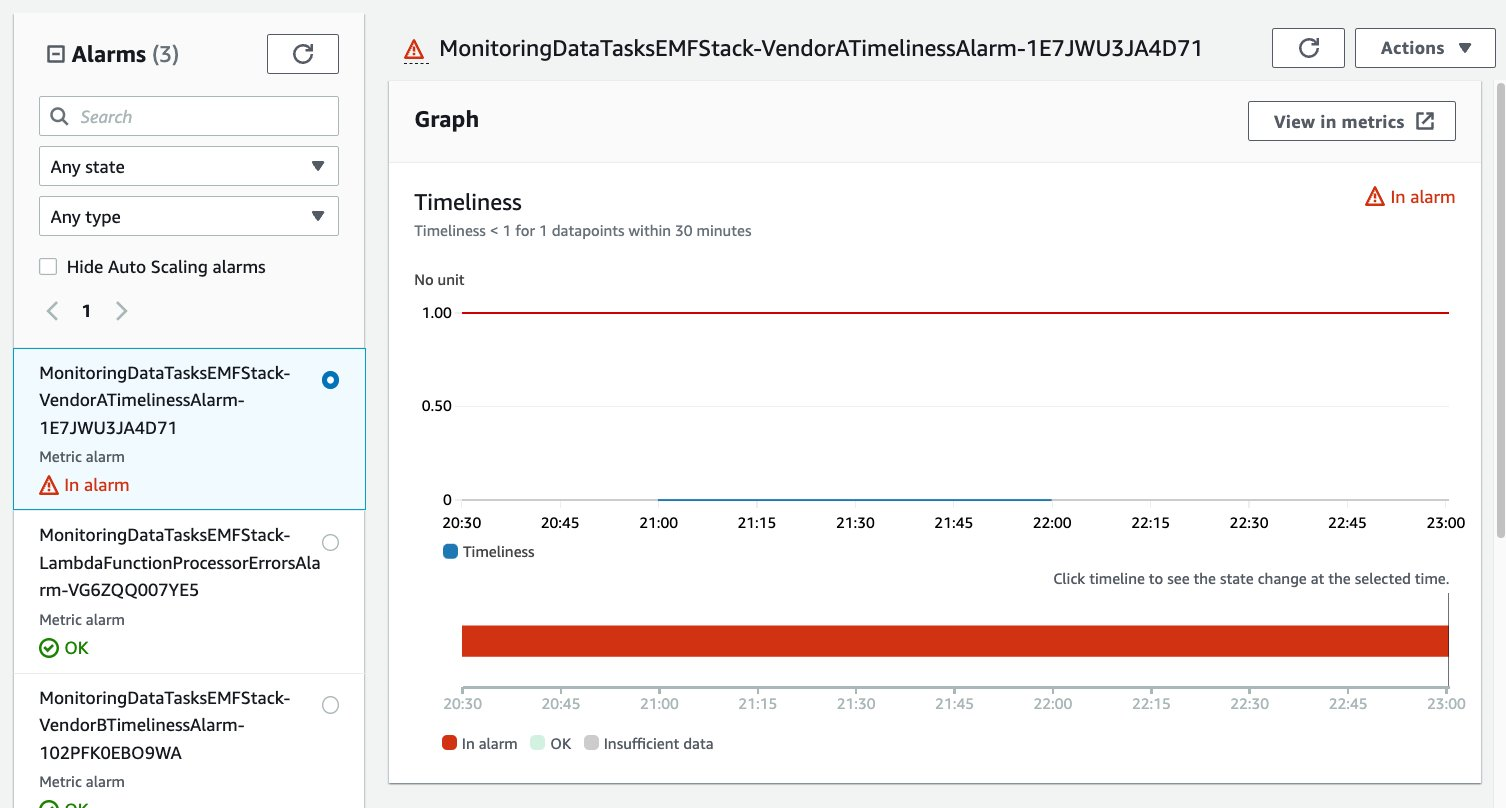
Figure 8: Timeliness Alarm in ALARM state due to no successful ingestion activity within expected timeframe.
Cleaning up
To avoid incurring further charges, use the following instructions to delete all of the resources created from this solution.
Run the following command to delete the resources with the SAM CLI:
Alternatively, use the steps here to delete the resources on the AWS Console.
Conclusion
This post walks through implementing monitoring and alerting on a data ingestion workload using CloudWatch embedded metric format. We demonstrate an approach on monitoring data ingestion tasks with CloudWatch metrics and alarms and monitoring file ingestion activity within an expected timeframe.
For more information on the CloudWatch Logs embedded metric format, visit the service documentation and related AWS post.
For more granular monitoring, consider creating additional custom metrics measuring object attributes, such as object size or row count, and then create a CloudWatch alarm that uses anomaly detection to identify outliers.
About the authors: