AWS Public Sector Blog
How Times Higher Education accelerated their journey with the AWS Data Lab
Times Higher Education (THE) is a data-driven business that, with the help of Amazon Web Services (AWS), is now realising the value of their data, which enables them to be better informed and make faster decisions for customers.
THE reports on news and issues related to higher education in a magazine supplement. They provide a broad range of services to help set the agenda in higher education. Their insights help universities improve through performance analysis. THE worked with the AWS Data Lab to create a centralised repository of their data. Launching a data lake helped with providing a cost-effective platform and cataloguing data so they could understand their data and design new products to make use of it.
Working with the AWS Data Lab
Some of THE’s data already resided in Amazon Redshift, Amazon Simple Storage Service (Amazon S3), Amazon RDS for PostgreSQL, and more. THE wanted to better understand how using other AWS services could drive efficiencies and support activities like dashboarding, reporting, and data science requirements to incorporate analytics more deeply into their operations.
“Many organisations like THE have legacy systems and solutions. We need to have a solution that is fit for purpose for the future and move away from doing things the known way. Working with the AWS Data Lab programme enabled us to accelerate our journey to become a data company by creating our own THE DataLab,” stated Freddie Quek, chief technology officer (CTO).
AWS Data Lab offers accelerated, joint-engineering engagements between customers and AWS technical resources to create tangible deliverables that accelerate data and analytics modernization initiatives.
Engaging the AWS Data Lab team gave this project focus and helped it accelerate, said Quek. “In any organisation, you need a catalyst for change. In this case, it helps to bring together both the data and engineering teams. This is our new joint baby, rather than being wedded to past systems and processes which are no longer working well anyway.”
Ingesting and consolidating multiple data sources into a central data repository
Over four days, THE and the AWS Data Lab worked together to design a solution that was capable of:
- Ingestion, cataloguing, and storage: To bring together data that wasn’t in a single place and enable teams to easily understand it.
- Syndication: To make data available to whoever needed it so users anywhere could quickly discover and analyse data.
- Insights: To help them innovate by more quickly analysing changing business conditions.
Using the AWS Data Lab Build Lab offering, THE and AWS worked together to build a prescriptive architectural guidance. AWS solutions architects also shared tips and helped remove any technical roadblocks to implementation. This included helping design a framework and addressing data governance and security. The following diagram demonstrates the proof of concept THE implemented.
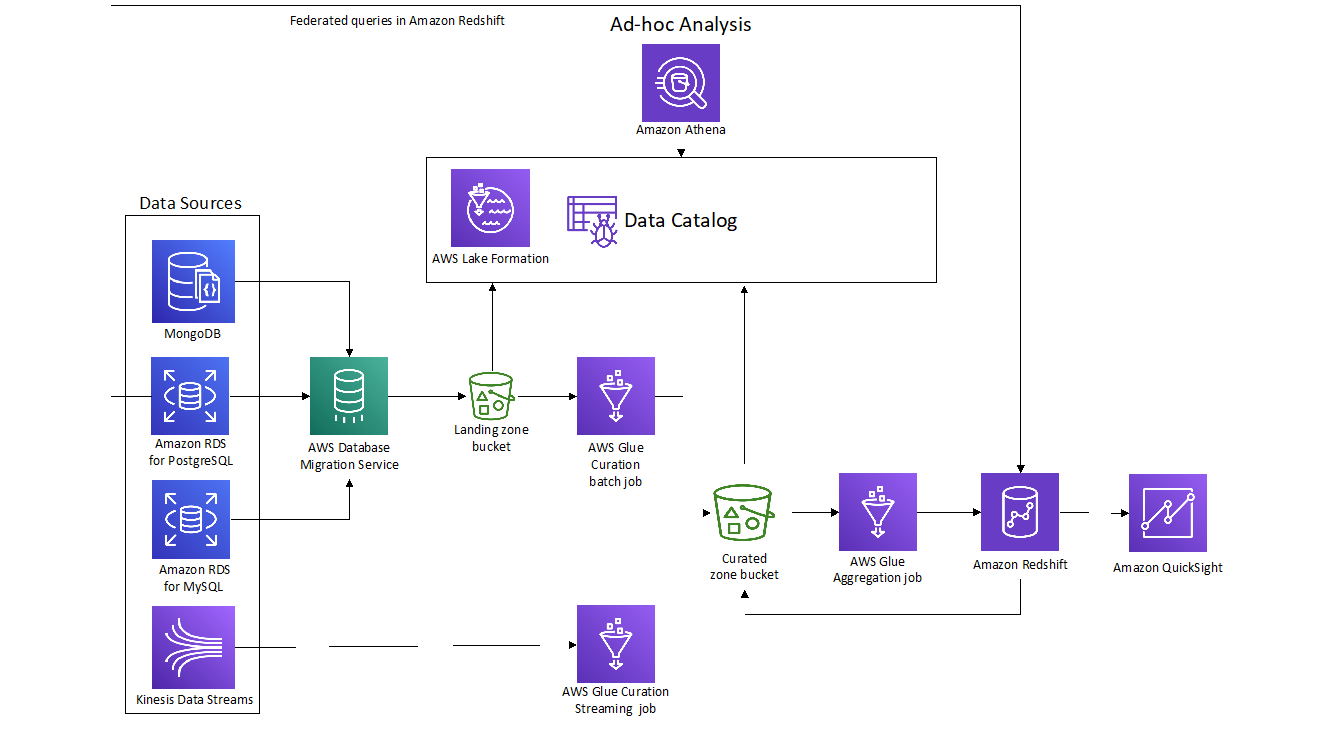
Figure 1: THE architecture diagram of the proof of concept built during the AWS Build Lab
Combining the benefits of data lake and data warehouse with a lake house architecture
THE’s use of various relational and NoSQL databases highlighted their need to build a centralized data repository. The first component of the data pipeline involved using AWS Database Migration Service (AWS DMS) to move data from those databases to the landing zone bucket in Amazon Simple Storage Service (Amazon S3). AWS DMS offers support to most widely used commercial and open sources databases, so it they could use it to capture data from MongoDB and Amazon Relational Database Service (RDS) for both PostgreSQL and MySQL.
AWS Glue extracts data from the landing zone, populating the Glue Data Catalog with metadata and enabling exploratory queries using Amazon Athena. The next task was to clean and curate the raw data from the landing zone, apply business rules, and store them to our curated zone bucket. This layer of data acts as the source of truth, known as a data lake. To make subsequent use of the data lake more efficient, the team used a year/month/day partition and stored the result of the extract, transform, and load (ETL) jobs in parquet format.
THE also captured their website clickstream events using Amazon Kinesis Data Streams. They implemented a serverless streaming ETL, using AWS Glue, to read the nested JSON events coming from Kinesis Data Streams and flattened, partitioned, and stored data in parquet format in the data lake. At this point, THE could use Athena on top of their data lake to query data coming from homogeneous sources and get valuable data insights.
The next step was to ingest data into THE’s Amazon Redshift data warehouse for performance advanced analytics. The team created a subsequent AWS Glue batch job to transform the data lake data to a dimensional model and ingest it to the data warehouse as facts and dimensions. We used INSERT to external table to demonstrate how to move warm or cold data to Amazon S3 to optimize the use of Amazon Redshift’s capacity by only keeping hot data stored locally. We used Amazon Redshift Spectrum to union data stored in internal and external tables. Finally, we enabled federated querying to directly query data from the source Amazon RDS PostgreSQL databases, giving THE the ability to explore ways of putting different data sources together to gain insights such as a holistic view of user activity and how demographics affect usage patterns. Putting together data stored in internal Redshift tables, Amazon S3 backed external tables queried by Spectrum and Amazon RDS PostgreSQL tables with federated queries—all accessed via the Amazon Redshift cluster. THE implemented the lake house architecture that makes it easy to query data stored in different data layers from a single endpoint, using familiar SQL statements in a cost-efficient way.
To showcase strategies for this data pipeline, the AWS team used Amazon QuickSight to build some sample dashboards. They connected QuickSight to both Athena and Amazon Redshift and were able to create some useful visualizations around user activity per geographic region.
Learn more about how the AWS Data Lab can help your cloud journey.