AWS Storage Blog
Query Amazon S3 Analytics data with Amazon Athena
I recently had a customer explain that they were aware of the benefits of various Amazon S3 storage classes, like S3 Standard, S3 Infrequent-Access, and S3 One-Zone Infrequent-Access, but they were not sure which tiers and lifecycle rules to apply to optimize their storage. This customer, and others like them, have multiple buckets and various data access patterns. We ended up working together to get them using S3 Analytics reports, which made it easy for them to determine optimal lifecycle policies. This blog post summarizes our lessons learned and provides a technique that makes it easier to inspect many analytics reports at once.
When Amazon S3 Analytics was released in November 2016, it gave you the ability to analyze storage access patterns and transition the right data to the right storage class. You could also manually export the data to an S3 bucket to analyze, using the business intelligence tool of your choice, and gather deeper insights on usage and growth patterns. This helped you reduce storage costs while optimizing performance based on usage patterns.
Next, Amazon QuickSight was released as an update in November 2017. With a few clicks from the S3 console, QuickSight enables you to visualize your S3 analytics for a given S3 bucket. This can be done without the need for manual exports or additional data preparation.
In this post, we will show you an alternative method of reviewing your analytics reports. This method uses Amazon Athena, a serverless interactive query service, and AWS Glue, a fully managed ETL (extract, transform, and load) and Data Catalog service. Together, those services are used to run SQL queries directly over your S3 Analytics reports without the need to load into QuickSight or another database engine.
This allows you to quickly and easily identify storage class cost savings opportunities across all of your buckets at once. This is more efficient than inspecting the reports individually within Amazon S3 or linking them individually to QuickSight reports.
Architecture
Below is an overview of the architecture we will build:

We start by configuring each Amazon S3 source bucket we want to analyze to deliver an S3 Analytics report [1] as a CSV file to a central Amazon S3 reporting bucket [2].
When the analytics reports are delivered to our reporting bucket, an S3 Event Notification triggers an AWS Glue Crawler [3] to map each analytics report as a new partition in a single logical analytics table within AWS Glue Catalog [4].
Next, our users or applications submit SQL queries to Amazon Athena [5]. Amazon Athena uses the AWS Glue Catalog [6] to determine which files it must read from Amazon S3 and then executes your query [7].
You will create some of this information manually following the guide below. Other components, such as the database and table definition in the AWS Glue catalog, will be created for you using AWS CloudFormation, an automated infrastructure as code service.
Prerequisites
This guide assumes you have one or more source buckets in Amazon S3 that you will configure to generate S3 Analytics reports. Additionally, you must have one report bucket in S3 to which these reports will be delivered. It’s ok if one of your source buckets is also your reporting bucket. Your source buckets must also be in the same Region as your report bucket for the analytics reports to be delivered.
Step 1: Enable S3 Analytics
First, we will enable S3 analytics on our source buckets and configure each analytics report to be delivered to the same reporting bucket and prefix. We do this because AWS Glue crawlers may be configured to treat objects in the same location with matching schemas as a single logical table in the Glue Data Catalog.
For each source bucket you want to analyze, follow the How Do I Configure Storage Class Analysis guide while adhering to these requirements:
- Configure the Destination bucket to output results to your reporting bucket.
- Configure the Destination prefix with a value equal to
s3_analytics/bucket=SOURCE_BUCKET.
Within the destination prefix, the s3_analytics/ portion may be any folder or series of folders of your choice, as long as there is at least one folder. The bucket=SOURCE_BUCKET portion is a firm requirement in order for AWS Glue to later properly crawl the reports. For example, if I am enabling S3 Analytics for a bucket named werberm-application-data, and I want to send my reports to a bucket named werberm-reports, the analytics configuration would look like this:

If you use the S3 web console to configure S3 Analytics, your report destination bucket will be automatically configured with a bucket policy that allows your source buckets to deliver their reports. If you use a programmatic method like CloudFormation, CLI, or SDK, you must configure the proper bucket policy. Click here for an example policy.
Your S3 Analytics reports will be delivered daily and it may take up to 24 hours for the first report to be delivered. Once delivered, the contents of s3://your_report_bucket/s3_analytics/ folder should look similar to this:

Within each folder above, you should see a single CSV file containing that bucket’s Amazon S3 Analytics report:
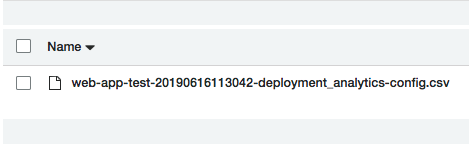
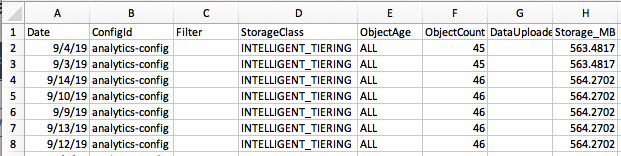
If you download one of these files and open it, you will see that it contains your analytics report. An example is shown below (for brevity, not all columns are shown):
Step 2: Crawl and Catalog with AWS Glue
In additional to fully managed serverless Apache Spark ETL jobs, AWS Glue provides an Apache Hive Metastore-compatible Data Catalog. When data in S3 is added to this catalog, it is immediately available for querying using Amazon Athena (as well as several other AWS services including Amazon EMR and Amazon Redshift Spectrum).
Click this link to launch a CloudFormation stack in us-east-1 that contains a pre-defined Glue database and table for your S3 Analytics reports. The stack will also include a crawler that will automatically catalog each new S3 Analytics report and add it as a partition to your catalog table.
If you are using AWS Lake Formation, a service that makes it easy for you to set up, secure, and manage data lakes, the CloudFormation stack above may fail. This depends on how you have configured your data lake permissions. Specifically, if you receive an error of Insufficient Lake Formation Permissions: Required Create Database on Catalog when it attempts to create the S3AnalyticsDatabase stack resource, then the Lake Formation administrator must grant you permission to create a database in the AWS Lake Formation catalog. Afterward, you should be able to deploy the CloudFormation stack. You can read more about the AWS Lake Formation and AWS Glue permission model at this link.
Step 3: Query your S3 Analytics Reports
Open the Amazon Athena console and select the s3_analytics database from the drop-down on the left of the screen.
Verify that the AWS Glue crawlers have detected your Amazon S3 analytics reports and updated the Glue catalog by running the command below:
>>> Show partitions s3_analytics_report;
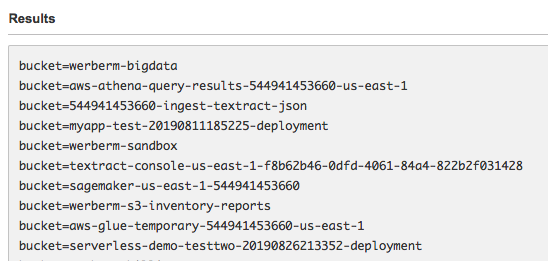
If you see that your source bucket names appear as table partitions, your analytics reports have been successfully cataloged, as shown below:
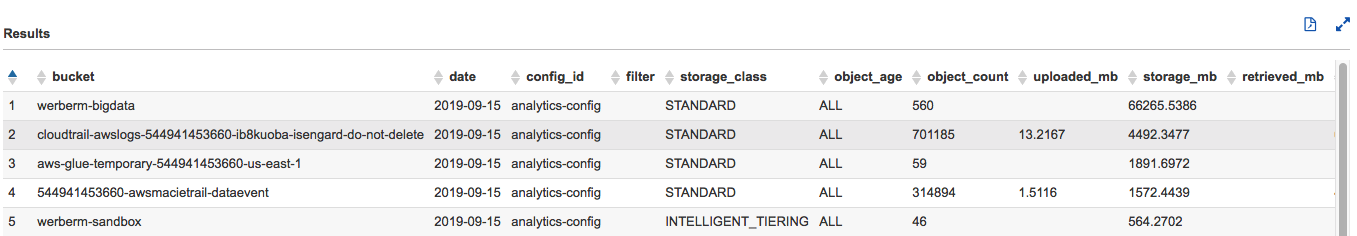
You may now query your analytics reports using standard SQL, such as the example below:
SELECT bucket, *
FROM s3_analytics
WHERE object_count IS NOT NULL
ORDER BY storage_mb DESC
Example results from Amazon Athena are below:
Automating Analysis of Amazon S3 Analytics
Above we demonstrated how you can run improvised Amazon Athena SQL queries over your S3 Analytics data in the Athena web console. However, you may want to automate the review and response to S3 Analytics, such as alerting your infrastructure team when new S3 storage tier recommendations exist, to further save on storage costs. Though outside the scope of this post, as a next step you could explore Amazon Athena’s AWS CLI and SDK query capability to do just this.
Amazon S3 Intelligent Tiering
Though this blog focuses on Amazon S3 Analytics, its worth noting that S3 offers S3 Intelligent-Tiering (launched in November 2018). Amazon S3 Intelligent-Tiering is an S3 storage class designed for customers who want to optimize storage costs automatically when data access patterns change, without performance impact or operational overhead. S3 Intelligent-Tiering stores objects in two access tiers: one tier that is optimized for frequent access and another lower-cost tier that is optimized for infrequent access. For a small monthly monitoring and automation fee per object, S3 Intelligent-Tiering monitors access patterns and moves objects that have not been accessed for 30 consecutive days to the infrequent access tier. There are no retrieval fees in S3 Intelligent-Tiering. If an object in the infrequent access tier is accessed later, it is automatically moved back to the frequent access tier. You can read more about S3 Intelligent-Tiering here.
Cost and Cleanup
By creating the demo architecture in this blog post, you will incur a small charge for the services used. For example, at the time of this writing, Amazon S3 Analytics charges $0.10 per million objects monitored per month. For the latest costs, refer to these pricing pages: Amazon S3, Amazon Athena, AWS Glue.
To clean up resources and stop incurring cost, you should:
- Disable Amazon S3 Analytics reports for any bucket you had enabled it on.
- Delete the analytics reports delivered to your central Amazon S3 reporting bucket.
- Delete your AWS Glue resources by deleting the demo AWS CloudFormation stack.
Conclusion
This post shows you how to use AWS Glue to catalog your S3 Analytics reports as a single logical table. Additionally, this post demonstrated how to use Amazon Athena to easily run SQL queries across that table. These reports help you determine how to reduce storage costs while optimizing performance based on usage patterns.
If you have questions or suggestions, please comment below.