AWS Partner Network (APN) Blog
Capturing and Visualizing Multi-Tenant Metrics Inside a SaaS Application on AWS
By Anubhav Sharma, Sr. Partner Solutions Architect – AWS SaaS Factory
By Tod Golding, Principal Partner Solutions Architect – AWS SaaS Factory
 |
The activity and consumption patterns of customers (tenants) in a software-as-a-service (SaaS) environment is often difficult to assess in a multi-tenant environment.
The number of tenants in your system, the varying nature of their workloads, and the fact that some or all of the tenant infrastructure may be shared makes it especially challenging to determine how tenants are using your SaaS application.
As a SaaS provider, it’s essential to have a clear picture of how tenants are exercising your system. Being able to model the functional and operational profile of tenants and tenant tiers is critical to evolving the business and technical strategies of a SaaS organization.
While the value of capturing metrics is easy to understand, instrumenting and surfacing this data does require teams to invest in creating the infrastructure and mechanisms that can enable the capture and analysis of this metrics data.
In this post, we’ll look at the role metrics play within a SaaS-based application and dive deep into a solution that provides all of the infrastructure that will support the ingestion, aggregation, and analysis of SaaS metric data.
We’ll also explore strategies for instrumenting your SaaS application to publish metrics. The goal here is to highlight the value and importance of metrics. This will give you a better perspective of how this solution works in your environment and provide a head start to implementing SaaS metrics on Amazon Web Services (AWS).
Why Metrics Matter
Metrics play a vital role in the success of a SaaS business. They empower business and technical teams to gather rich insights into how tenants are using and placing the load on the system.
This data gives business, operational, and architectural teams views into metrics that play a vital role in shaping the technical and strategic direction for your SaaS offering.
From a business team perspective, metrics can help determine which features are being used by tenants or tenant tiers. They also provide rapid insight into the impact and adoption of new product features. Product managers can use these insights to influence the overall product strategy and business priorities.
Metrics can also have a significant influence on the architecture of a SaaS environment. This data enables SaaS architects to build a richer view of how tenants are imposing load on the system, and how the system is responding to the continually evolving nature of multi-tenant workloads.
SaaS operations teams can use this data to assess the overall health of the system at any given time and identify bottlenecks that may be created by individual tenants or tenant tiers.
Building a Metrics Architecture
To help illustrate how you might implement metrics in your own environment, we’ve created a sample solution, available on GitHub, that captures, stores, and surfaces SaaS metrics.
This diagram provides a high-level view of the architecture of this solution.

Figure 1 – High-level metrics architecture.
The flow of this solution is pretty straightforward. At the left of the diagram, you’ll see that tenants are consuming a SaaS application. As they consume different features and resources of your application, they will trigger the publication of metric events.
Next, you’ll see that we have used common AWS services for ingesting and aggregating these metric events. Amazon Kinesis Data Firehose sits at the front of this ingestion process, providing a scalable and serverless way of ingesting metric events.
Your application can publish these events directly to Kinesis Data Firehose, or it can just use the metrics manager we created as part of this solution, to simplify this effort. We’ve used Java to implement this sample metrics manager, but you may choose to create a library or helper of your own that best aligns with your language/stack.
Once the data is ingested into Kinesis Data Firehose, it’s then streamed to Amazon Redshift. Data Firehose achieves this through its direct integration with Amazon Redshift, but it first streams the data to an Amazon Simple Storage Service (Amazon S3) bucket.
After the data lands in S3, Data Firehose issues an Amazon Redshift COPY command to load data from your S3 bucket into a metrics table inside Amazon Redshift. In this model, Amazon Redshift becomes the data warehouse for all metrics, supporting a range of business intelligence (BI) tools that can be used to analyze your SaaS application trends.
The last piece of the puzzle is Amazon QuickSight, which sits on top of your Amazon Redshift metrics data, allowing you to build custom views of tenant trends and activities. Each role within your business could presumably use QuickSight to build the dashboards that would target their specific needs.
Instrumenting Your Application
Once you have the metrics infrastructure in place, you need to look at how you’ll instrument your SaaS application to capture and publish metrics.
To get to the detailed metrics needed by a SaaS business, you’ll need to start by identifying the workflows and resources in your application that represent opportunities to capture metric data. As part of this exercise, you’ll have to think about which types of metrics (search latency, result count, data usage, query duration) fits best with the scenario you’re instrumenting.
Let’s start by walking through an example of a multi-tenant application we’ll use to capture tenant metrics. The diagram in Figure 2 provides a view of an application that uses Amazon DynamoDB to manage its data. The service relies on a data access layer (DAL) to manage access to this database.
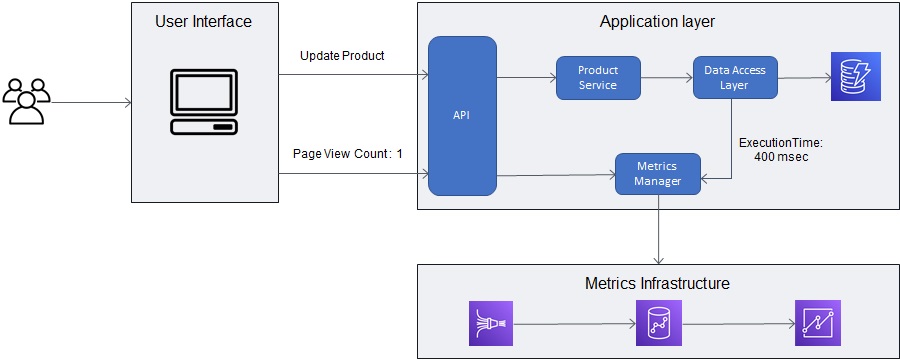
Figure 2 – Instrumenting your SaaS application.
You’ll notice this example adds metrics instrumentation at different layers within the application. The user interface (UI) publishes a metric to indicate the Update Product page was used. Then, the backend service captures the time required to update a product inside the DynamoDB table.
For this workflow, there may be multiple parts of our application that need to be instrumented.
This gives you an idea of how this may work conceptually. However, let’s look at what it means to introduce these metric instrumentation calls into the code of one of our microservices. The goal is to make this instrumentation as lightweight and non-invasive as possible.
To achieve this, we’ve created a metrics manager that can be used to publish metrics without adding lots of code to your solution. We’ve also created a sample client that uses the metrics manager to publish the metrics. The complete code for metrics manager and sample client are available on GitHub.
Below is a snippet of code from this sample client. Here, you can see how it captures and publishes metrics without adding too much complexity to your code:
In this example, you’ll see we capture the execution time using the ExecutionTimeMetric Instant class. Then, we called an instance of the metricPublisher to publish the metric. You can imagine similar code being instrumented inside your data access layer, where you capture the start and end time of your query and use that to record your execution time.
Another important thing to note is the jwtTokenManager and jwtToken being passed to the metricsPublisher. In a typical SaaS application, your jwtToken has user/tenant information as part of custom claims.
The metricsPublisher supports accepting the jwtToken and extracts tenant information from these custom claims. This not only means that tenant details are captured as part of each metrics, but it further ensures your application developers don’t have to pass tenant details as part of each metric call.
Finally, use the last argument of publishMetricEvent to pass any additional information related to metrics as a key value pair.
The idea here is to create a reusable library that all of your services will consistently use to publish metrics.
Structuring Your Metrics Events
As part of this solution, we’ve created a universal metric format that’s meant to represent each of the different metric events you may want to publish. Figure 3 provides an overview of the contents that would be placed in a metrics event.
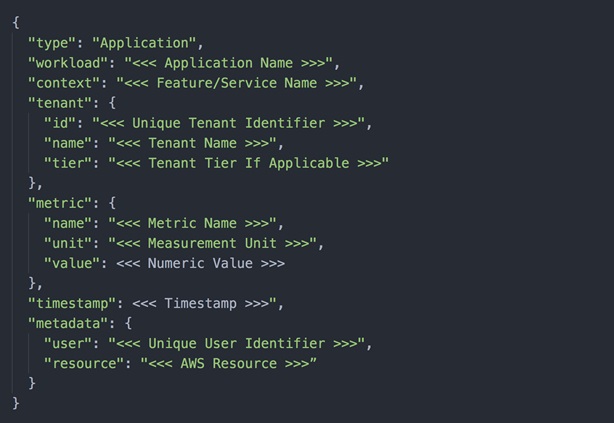
Figure 3 – JSON metric message.
The “type” attribute can be used to categorize the metrics as “Application”, “Business KPIs”, “Infrastructure”, and so on. Since we are targeting application-level metrics, default this to “Application” for now.
The “workload” and “context” fields can support multiple use cases. For example, in a microservice-based environment, you can use the “workload” field to capture the application name, such as ProductApplication, whereas the “context” field captures more fine-grained details about the workload, such as ProductService or CatalogService in our example.
The “tenant” object in JSON payload is used to capture tenant information. Tenant context is used to associate tenants to the emitted metrics. This enables us to build richer visualization through the lens of individual tenants.
The “metric” attribute is used to capture the metric data that needs to be emitted. It’s important to have a consistent unit value for emitted metrics—storage metrics are usually captured in megabytes, for example—so the emitted metric can either use “MB” or “Megabytes” as its unit. However, it needs to be consistent across all of the captured metrics.
You can send additional information in the “meta-data” field, which can also be used to build various visualizations. In this scenario, we are sending “resource” to capture the AWS services for which the metric was captured, and “user” to capture the user interacting with the system.
Ingest and Aggregate Data
Now that we understand how metrics are captured and published, let’s look at how this data will be ingested and aggregated.
In our solution, the Amazon Kinesis Data Firehose stream is configured to publish the data to Amazon Redshift. However, Amazon Redshift relies on JSONPaths file that specifies how to parse and map JSON data. Figure 4 shows the JSONPath file used for mapping metrics JSON payload.
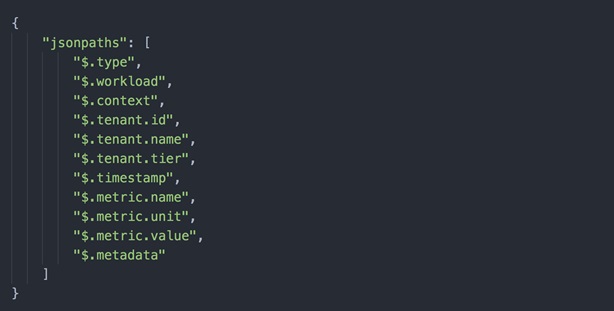
Figure 4 – JSONPath file for metrics JSON.
After the data lands in the Kinesis Data Firehose stream, it’s temporarily stored in an S3 bucket before the Amazon Redshift COPY command consumes it.
This table shows how metrics are represented in the metrics table of the Amazon Redshift cluster.
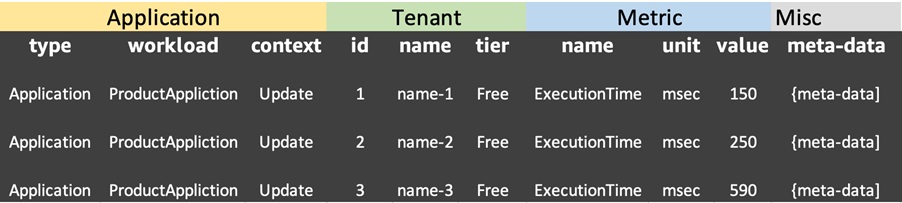
Figure 5 – Metrics in Amazon Redshift table.
One thing to note is that the “meta-data” object is stored as a JSON string in a single column. This is done with future extensibility in mind, allowing developers to add any relevant data that can help them create custom visualizations pertinent to their environments
The key here is that we now have one universal representation of our metrics that spans tenant activity, consumption, and more. The data also include tenant identifier and tiers. With these pieces in place, we can build dashboards that let us ask key questions of the system through the lens of tenant and tenant tiers.
SaaS Metric Visualizations
Now that we have ingested the data, we can use Amazon QuickSight to build interesting views of the data. The visualizations you create will depend directly on the nature of the data you choose to publish and how you group these metrics.
To give you a better sense of how these metrics can turn into compelling views, our sample solution creates a handful of views that are powered by the same metrics data. These views provide some concrete examples of how this data can be used to analyze the trends in your SaaS environment.
You can refer to our metrics and analytics GitHub repository for step-by-step instructions on setting up QuickSight and be able to build some sample views.
In looking at these sample visualizations, you’ll see how we created views that are specific to a multi-tenant experience. These dashboards give you mechanisms to evaluate the trends of all tenants, individual tenants, and tenant tiers. The data also span features, resource consumption, and so on.
As you begin to apply this to your own environment, the different roles on your team will begin to determine which view of this data are most valuable. You’ll also find that, as more metrics are published, more consumers and use cases will emerge that will create more demand for new metrics.
Running the Sample Solution
Now that you’ve seen the core concepts, you can explore the moving parts of this solution by installing and running the metrics infrastructure in your own AWS account. The details on how to create the environment can be found in the README of a GitHub repository.
This README file also walks you through the steps to deploy the solutions using an AWS CloudFormation script that provisions all of the elements of the architecture outlined above. The setup script offers you a variety of options to customize the experience.
This repository comes with a metrics generator to generate sample metrics and test your architecture deployment. The README file also contains the instructions on how to use this metrics generator.
Setting up Amazon QuickSight is a bit more involved, since its dashboards can’t be fully configured via CloudFormation. However, by following the instructions documented in the README file, you’ll have a correctly set up Amazon QuickSight account with the necessary data source created to access metrics data inside your Amazon Redshift cluster.
You will still have to create the dashboard manually, however, by referring the visuals presented inside the README file.
Don’t Underestimate the Value and Impact of Metrics
At the start of this post, we talked about the importance of metrics in a SaaS business. We talked about the value this adds from both technical and business perspective, but the reality is that we have only scratched the surface of what you can achieve.
Many SaaS providers want to correlate consumption inside their SaaS application with tenants. Businesses want to understand the profitability on per-tenant basis, but the only way to achieve this is by collecting metrics related to consumption across tenants and apportioning your AWS cost based upon that consumption.
The AWS SaaS Factory team recently worked with CloudZero, an AWS Advanced Technology Partner, and helped them build a SaaS Solution that provides a way to determine cost-per-customer by collecting metrics and mapping those to your AWS costs.
SaaS providers can also predict future consumptions, detect anomalies, and make business projections based upon metrics collected over a period of time. Once you have the metrics collected in a central repository, you can use the machine learning abilities inside AWS services such as Amazon QuickSight, Amazon Forecast, and Amazon SageMaker to provide insights on top of these metrics.
Conclusion
In this post, we discussed the importance of collecting useful metrics for the success of a SaaS organization and how these metrics can be used to empower multiple teams within your organization. Metrics can provide valuable insights that further help move your SaaS business in the right direction and give it a competitive advantage.
It’s important to note the reference architecture presented here is one out of many ways of achieving the same goal. As an example, some customers may choose Amazon S3 or Amazon CloudWatch over Amazon Redshift to store metrics. There can be various technical and business factors within your organization that may influence your choice of technology.
Regardless of which AWS services you choose, the reference architecture we presented here can help you achieve your goals by providing a central approach for metrics collection and visualization.

About AWS SaaS Factory
AWS SaaS Factory helps organizations at any stage of the SaaS journey. Whether looking to build new products, migrate existing applications, or optimize SaaS solutions on AWS, we can help. Visit the AWS SaaS Factory Insights Hub to discover more technical and business content and best practices.
SaaS builders are encouraged to reach out to their account representative to inquire about engagement models and to work with the AWS SaaS Factory team.
Sign up to stay informed about the latest SaaS on AWS news, resources, and events.