AWS Partner Network (APN) Blog
Ensuring Successful Cloud Migrations with Cross-Platform Visibility from Datadog
By Ilan Rabinovitch, VP of Product Management at Datadog
By Jim Huang, Sr. Partner Solutions Architect at AWS
 |
 |
Migrating customer workloads to the Amazon Web Services (AWS) Cloud typically comprises several phases: migration readiness assessment, migration planning, the actual migration of applications, and post-migration application optimization.
At each of these phases, there are tools and services to help you automate and accelerate migration tasks. This includes discovery for identifying IT assets and application dependencies, Total Cost of Ownership (TCO) analysis for developing the business case for migration, and mobility for migrating servers and databases.
Application profiling is a class of technology for guiding customers across migration phases from end to end—prior to migration, during migration, and post-migration.
In this post, we’ll walk through an application profiling solution developed by Datadog, an AWS Partner Network (APN) Advanced Technology Partner with the AWS Migration Competency. Datadog provides cross-platform visibility so companies migrating to AWS can build a full understanding of their assets, and then migrate to the cloud with confidence.
We’ll also provide a customer case study to demonstrate how Datadog’s cross-platform visibility facilitated a seamless migration process for one e-commerce platform provider.
Application Profiling Technology and Characteristics
Application profiling technologies help customers obtain visibility into all phases of the migration, from mapping out legacy systems at the outset, to performance monitoring in the cloud after the migration is complete.
The application profiling technology exhibits the following characteristics:
- Application instrumentation end-to-end: Allows instrumentation of common and customer applications end-to-end, following business transactions from user device to application, infrastructure, and database. A business transaction is made up of the required services in a customer’s environment that are called upon to fulfill and deliver a response to a user-initiated request.
- Application performance profiling: Provides application baseline, peak, and trend-based performance profiling prior to migration, and post-migration. Examples of application performance metrics include latency at each application processing component, and the response time to an application’s client API call.
- Discovery of business transactions: Traces business transactions across all applications in the dependency chain for a full view of application usage and performance profiling prior to migration.
- Unified monitoring: Provides a single-pane-of-glass view of application performance, from user device to application, infrastructure, and database in real-time.
- Cross-environment monitoring: Provides monitoring of components and resources running on-premises and in the cloud at the same time.
- Validation during migration: Simulates and measures user experience on AWS during migration by injecting synthetic application traffic or emulating user behaviors and monitoring performance of synthetic applications and detecting issues quickly.
- Validation post migration: Compares application performance and user experience in the source environment that was previously baselined, as well as the AWS environment post-migration.
Let’s take a look at how Datadog’s solution provides application profiling functions for workload migration to AWS.
Datadog is a hosted software-as-a-service (SaaS) platform for cloud-scale monitoring and analytics. With infrastructure monitoring, application performance monitoring, log management, network performance monitoring, and user-experience testing, Datadog provides a comprehensive view of application performance in a single pane of glass.
Datadog Solution Architecture
Datadog brings together data from both the source environment and the target environment of a workload migration, as illustrated in the architecture diagram in Figure 1.
The Datadog platform provides migration monitoring through several core features and functions:
- Datadog Agent: Enables data ingestion from hosts and applications in any environment. The Agent collects metrics from servers, containers, and hundreds of infrastructure technologies, as well as process data, network performance data, logs, and distributed tracing data in both the source and target environments.
- Datadog API Crawlers: Obtains AWS service data through Amazon CloudWatch to complement the data collected from the Agent in the target environment.
- Datadog Synthetics: Generates test requests and carries out test workflows against HTTP endpoints in both the source and target environments to assess and compare application performance and detect issues in either environment.
- Datadog Log Management: Provides centralized monitoring and analytics on log data from both the source and target environments. Whether or not the logs are retained in Datadog for analysis, all logs from the source and target environments are automatically archived in Amazon Simple Storage Service (Amazon S3), and can be retrieved via Log Rehydration for analysis at a later date.

Figure 1 – Datadog unifies data from on-premises data centers (left) and the AWS Cloud (right).
All of Datadog’s monitoring and visualization features are tightly integrated, so users can pivot seamlessly from a distributed trace describing a business transaction to the correlated logs or infrastructure metrics pertaining to that same transaction.
By providing comprehensive visibility into cloud and on-premises environments alike, Datadog enables customers to migrate to the cloud with confidence.
Visualizing Application Architecture and Dependencies
At the outset of a migration project, companies often need to inventory all of their running services and dependencies to make solid architectural decisions about the new cloud environment.
The Datadog service map and network map automatically visualize data flow and dependencies between services, data centers, teams, and more, so that customers can see how their applications behave in real-world scenarios.
Post-migration, customers can visualize the architecture of the migrated application to ensure data is flowing between services as designed. Using tags automatically inherited from AWS, users can also break down network traffic between availability zones, security groups, Amazon Elastic Container Service (Amazon ECS) clusters, and more.
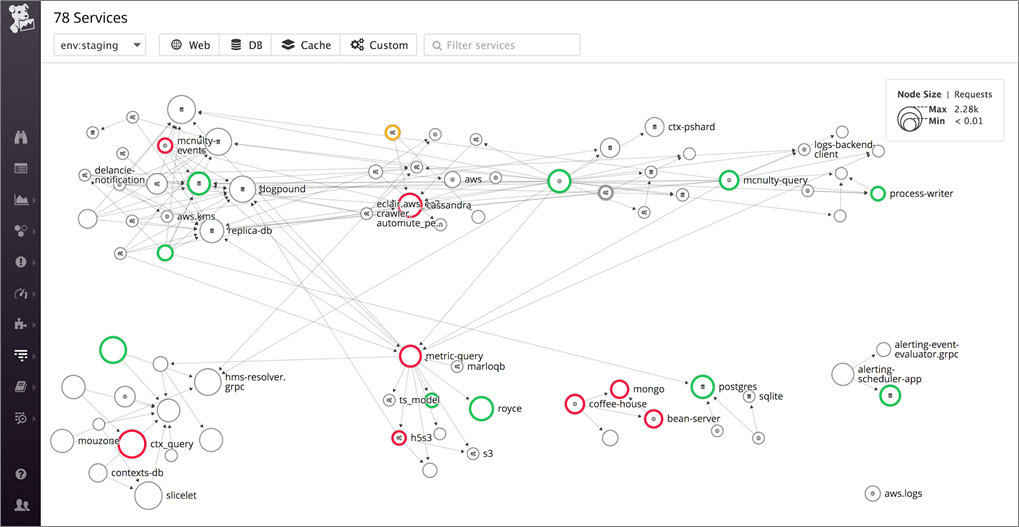
Figure 2 – The Datadog service map.
The image in Figure 2 above shows how the Datadog service map decomposes an entire application environment into its individual services and automatically groups them based on affinity. Arrows track the flow of requests from one service to another, revealing dependencies and potential bottlenecks.
Mapping Legacy and Cloud Infrastructure
The Datadog host map enables customers to visualize all of the hosts or containers in their infrastructure for a bird’s-eye view of infrastructure footprint and resource utilization.
Each host on the map is color-coded by a user-selected metric, such as CPU utilization or request throughput. Tag-based grouping and filtering allows customers to break down their hosts by infrastructure environment (e.g. AWS and on-premises data centers), or to group hosts by function (e.g. service or role) to identify hotspots in their environment.
The host map enables customers to understand their footprint before beginning a migration, to identify under- or over-provisioned services, and to visualize resource consumption across the new cloud infrastructure during and after the migration.
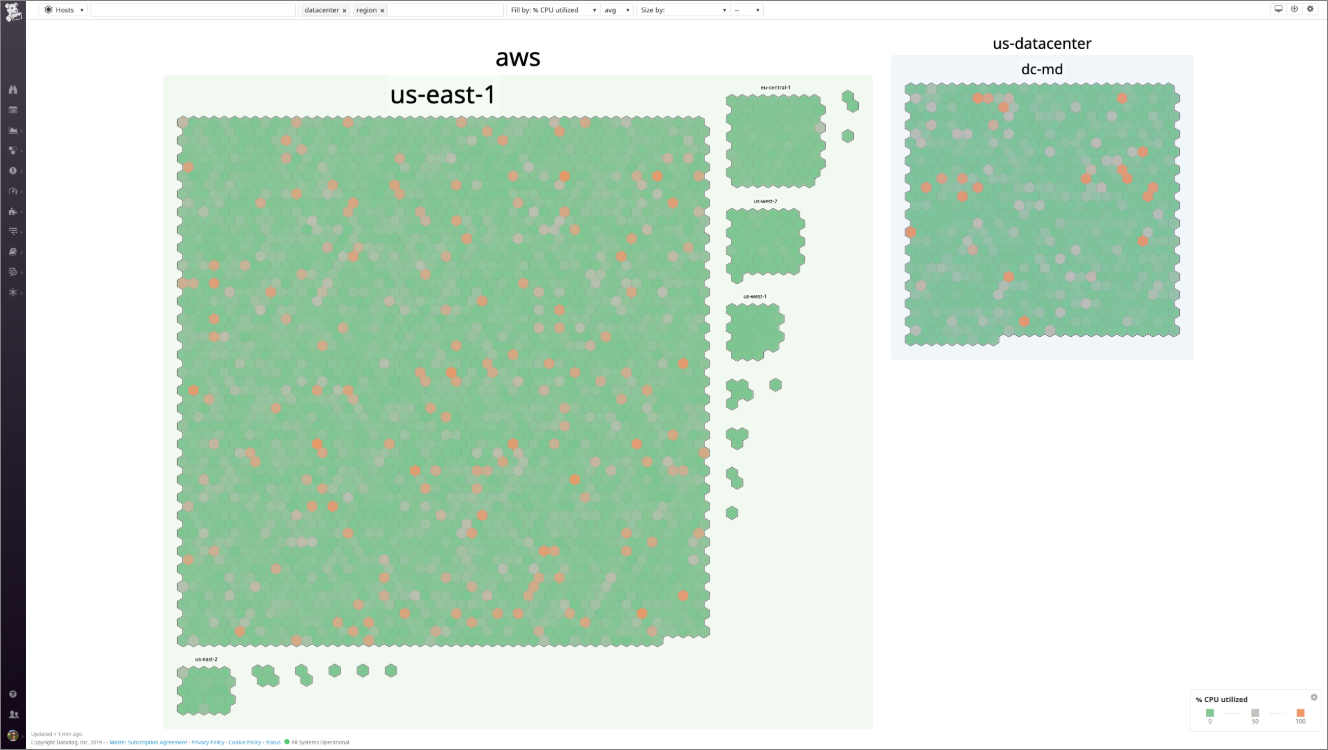
Figure 3 – The Datadog host map.
The host map in Figure 3 above shows how tags enable you to arbitrarily group and filter your infrastructure based on the attributes of your servers or cloud instances. Here, hosts are grouped by infrastructure environment (AWS versus on-premises data center) and then by region within those environments.
End-to-End Request Tracing
Datadog APM (application performance monitoring) traces application requests and business transactions from end-to-end, so customers can see how real requests are being handled.
APM provides request-level details and aggregated performance metrics so customers can set pre-migration baselines for latency, throughput, and error rates. When issues arise in either environment, distributed tracing reveals where in the request pathway the issue originated.
Datadog’s distributed tracing libraries for APM provide automatic instrumentation for many common frameworks and programming languages, so developers can start visualizing application performance in minutes. End-to-end traces visualize the full execution path of a request, from web app code to databases, caches, and serverless AWS Lambda functions.
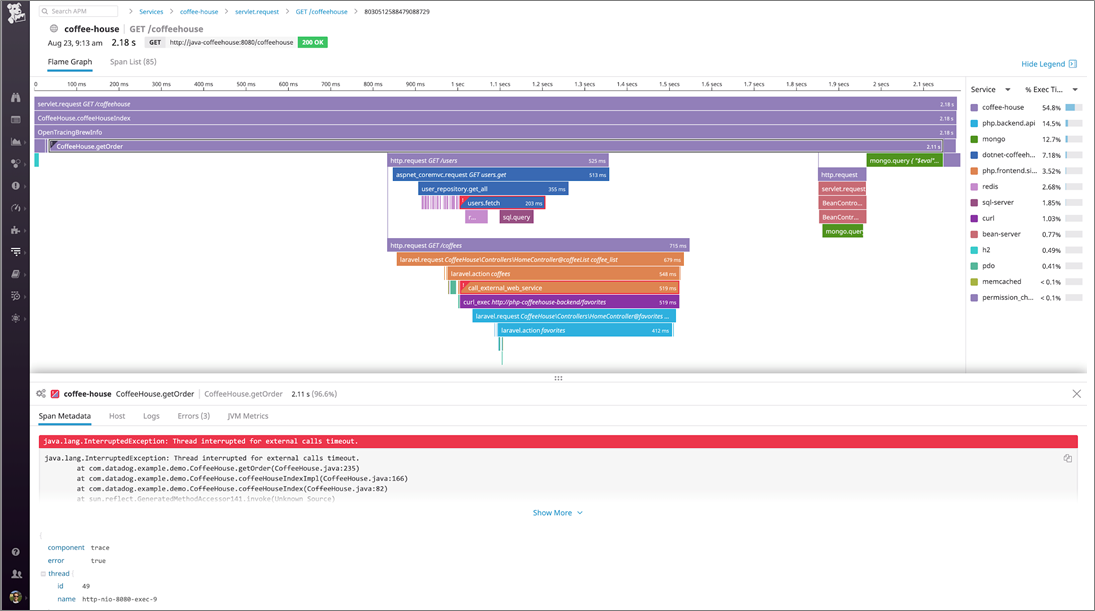
Figure 4 – An end-to-end request trace in Datadog APM.
In the trace above, you can see a timeline of how one request to an application was fulfilled—all the operations, calls, and queries that went into servicing that request.
The lower panel captures key metadata from each of those steps, including error messages and stack traces for debugging purposes. Any logs associated with that request are automatically captured and correlated as well.
Alerting and Troubleshooting
After an application’s baseline performance has been established in the on-premises environment, customers can set sophisticated alerts to notify them of any performance issues when the application is migrated to the cloud.
Datadog provides a number of detection mechanisms for alerts, including threshold and percent-change alerts, plus machine learning algorithms for anomaly detection, outlier detection, and forecasting. These alerts can be delivered via email or a variety of collaboration tools like Slack, PagerDuty, or OpsGenie.
When a responder receives an alert, they can instantly begin investigating with built-in context, such as graph snapshots, links to relevant dashboards, and the ability to pivot seamlessly between metric graphs and correlated logs or request traces.
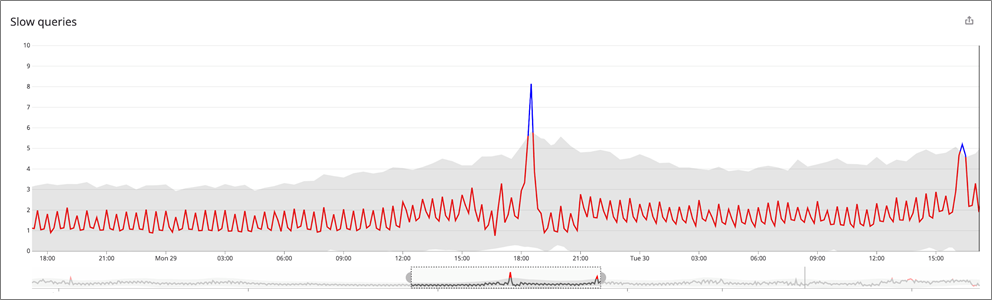
Figure 5 – Anomaly detection in Datadog.
The graph in Figure 5 above demonstrates how anomaly detection dynamically calculates an expected range for a metric (gray) and automatically flags any deviations (blue) from that range to trigger customizable notifications.
Installing the Datadog Agent
To collect detailed performance data from all of their hosts, infrastructure technologies, and services, customers can install the Datadog Agent on their hosts in both AWS and on-premises environments.
For most operating systems, installing the Agent takes only a single command. Datadog also provides deployment options for automation technologies such as Ansible, Puppet, Chef, or Kubernetes.
Installation instructions for all these platforms are available in the Datadog docs.
Integrating Datadog with Amazon CloudWatch
Datadog also integrates with Amazon CloudWatch to help customers visualize metrics from their hosted cloud services alongside all their AWS and on-premises hosts.

Figure 6 – Configuring Datadog to collect data from AWS services.
To configure data collection from Amazon CloudWatch, create a role in the AWS Identity and Access Management (IAM) console and grant Datadog read-only access to monitoring data via that role. Full step-by-step instructions are available in the Datadog docs.
Enabling Datadog APM
By enabling Datadog APM, customers can trace their transactions from end-to-end and visualize their application architecture in the service map. Auto-instrumentation enables you to start tracing requests across application stacks quickly, often with a single command or configuration change.
For example, Java applications require only the addition of a JVM argument pointing to the path of the Datadog Java client JAR, and Python applications can be configured for tracing with a single wrapper command.
Find language-specific instructions in the Datadog APM documentation.
Enabling Log Collection in Both Environments
Companies migrating to the AWS Cloud can start collecting logs from both environments using the Datadog Agent.
Enabling log collection requires a one-line change in the Agent’s main configuration file (datadog.yaml):
logs_enabled: true
Once log collection is enabled for the Agent, users can configure any of Datadog’s built-in integrations that support log collection and processing out of the box, including infrastructure technologies like MySQL, Kubernetes, Apache Kafka, and NGINX.
For more information on enabling log integrations and collecting custom logs from other services, consult the Log Management documentation.
You can also monitor and analyze logs collected from AWS services, using Datadog’s log forwarder Lambda function. The function gathers logs from AWS services that write to an Amazon S3 bucket or CloudWatch Log Group, and automatically forwards them to Datadog for centralized analysis, visualization, alerting, and troubleshooting.
Read the Datadog documentation for more details on configuring log collection from AWS.
Enabling Network Performance Monitoring
To map the flow of network traffic across on-premises and cloud environments, customers can enable Network Performance Monitoring (NPM) with a simple configuration change.
Visit the Datadog documentation for complete instructions on enabling and configuring NPM.
Customer Migration Use Case: Neto
Neto is a complete e-commerce platform for retailers, and they relied on Datadog for critical visibility during their migration to AWS, which enabled the company to maintain platform reliability and ensure business continuity for customers.
Prior to the migration, Neto had relied on a set of self-hosted, manually configured tools to monitor legacy infrastructure, but they quickly found those tools were unable to keep pace with a highly dynamic AWS environment.
Datadog’s ability to display the health of every host and service in a single interface—regardless of where they were running—meant that Neto never experienced a lapse in visibility or platform reliability during their migration. For six months, Neto’s legacy and cloud infrastructures ran simultaneously as customer assets were transferred from MySQL to Amazon Aurora databases.
Datadog helped ensure the accurate, on-time migration of these assets by collecting, aggregating, and displaying metrics from both environments on a single platform. The comprehensive visibility provided by Datadog made it easy for Neto to troubleshoot across environments and resolve issues before they affected customers.
Now that the migration is complete, Datadog tracks Neto’s highly automated infrastructure by monitoring new hosts and services as soon as they come online, so that Neto can take full advantage of the AWS cloud’s elasticity without sacrificing on visibility.
Read more about how Neto’s reached a new level of resilience with AWS and Datadog.
Summary
Cross-platform visibility helps drive successful cloud migrations at every phase of the project.
At the outset, visibility into the on-premises environment builds a full understanding of your legacy applications and dependencies. During the migration, you can monitor every cloud resource as it comes online to track progress and see the performance of your new cloud components alongside their legacy counterparts. After the migration is complete, you can ensure the migrated application is meeting targets for availability and performance.
Datadog provides this cross-platform visibility by collecting, aggregating, and visualizing data from on-premises and cloud environments alike. With dozens of integrations with AWS services, Datadog delivers a single-pane-of-glass view for your hosted cloud services alongside the rest of your applications and infrastructure.
You can take advantage of Datadog alerts to notify you of any performance anomalies, build custom dashboards that showcase KPIs from both environments, set up user-experience tests to automatically verify the functionality of your migrated applications, and more.
To visualize and monitor cloud and on-premises infrastructure in one place, visit the Datadog website to sign up for a free 14-day trial.
You can read more about monitoring for cloud migrations on Datadog’s dedicated solution page, where you can also request a consultation about your cloud migration scenario and learn how real-time, cross-platform visibility can help ensure the success of your migration project.
.

.
Datadog – APN Partner Spotlight
Datadog is an AWS Migration Competency Partner. They bring together data from servers, databases, tools, and services to present a unified view of your entire stack. Datadog is a SaaS-based data analytics platform that enables DevOps teams to work collaboratively.
Contact Datadog | Solution Overview | AWS Marketplace
*Already worked with Datadog? Rate this Partner
*To review an APN Partner, you must be an AWS customer that has worked with them directly on a project.