AWS Partner Network (APN) Blog
How to Analyze and Action Device Data Using AWS IoT and Splunk
By Devendra Singh, Partner Solutions Architect at AWS
By Harpreet Singh, Partner Solutions Architect at AWS
By Jae Jung, Global Strategic Alliances Sales Engineer – APAC at Splunk
 |
 |
The Internet of Things (IoT) connects the physical world to the internet so that you can use data from devices to increase productivity and efficiency.
Connecting “things” to the internet is possible because different connectivity options are widely available, the cost of connecting is declining, and more devices are capturing data.
All kinds of things are being used in IoT applications. This includes consumer products such as refrigerators, security cameras, and cable set-top boxes; industrial systems like conveyor belts and manufacturing equipment; and commercial devices such as traffic signals and smart meters.
The use case for IoT is very prevalent in industrial companies, but the main challenge organizations face is around gaining meaningful insights into the collected data. The volume of data is just so huge that engineers and analysts are often overwhelmed.
Splunk software collects, analyzes, and visualizes real-time and historical machine data from any source—including operational technology, connected assets, and products—enabling you to improve operations, ensure safety and compliance, perform predictive maintenance, and better manage the uptime and availability of industrial assets.
Splunk is an AWS Partner Network (APN) Advanced Technology Partner with the AWS IoT Competency. Splunk software and cloud services enable customers to search, monitor, analyze and visualize machine-generated big data from websites, applications, servers, networks, IoT, and mobile devices.
As we know, IoT devices generate a large amount of data that needs to be analyzed to take meaningful actions. In this post, we’ll see how to collect data from IoT devices using AWS IoT services and ingest that data into Splunk for meaningful and action-oriented analytics.
Solution Architecture
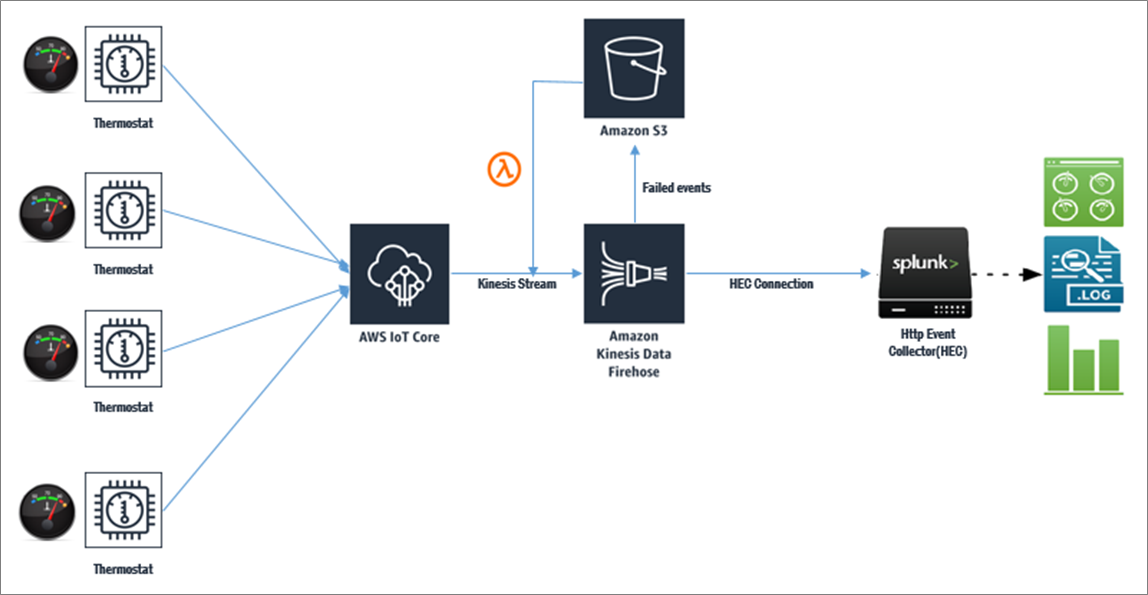
In this post, we’ll be working with real-time IoT data generated by temperature sensors. The sensor data is sent to AWS IoT services in real-time, and those services use Amazon Kinesis Data Firehose to deliver the temperature data into Splunk using its HTTP Event Collector (HEC) interface.
Once the data is ingested into Splunk it’s easy to create meaningful dashboards and act on the IoT data using the “Triggered Alert” function provided by Splunk. For example, if the temperature threshold exceeds a particular value for an industrial machine, then an action could be triggered for generating a maintenance work order through an ERP system, such as SAP, and/or sending an email to the assigned engineer to take corrective action.
There are predefined triggers in Splunk which can be extended further by using custom triggers. The diagram below depicts a complete cycle of data flow from an IoT device to Splunk.
How-to Guide for Configuration
We will see how to receive data from IoT devices and ingest that into Splunk Server for detailed analysis and actions.
The high-level steps of configurations are:
- Configure IoT devices to send data to AWS IoT services.
- Configure AWS IoT to send data to Amazon Kinesis Data Firehose.
- Configure Splunk HTTP Event Collector (HEC) to receive IoT data.
- Configure Kinesis Data Firehose to send data to Splunk HEC.
- Visualize data in Splunk and take actions.
Step 1: Configure IoT Devices to Send Data to AWS IoT Services
We assume that your IoT devices are already configured correctly and can send data to AWS IoT services. For more information on the step-by-step process of configuring an IoT device with AWS IoT service, see the documentation.
Step 2: Configure AWS IoT to Send Data to Amazon Kinesis Data Firehose
Next, we need to create Kinesis Data Streams for the raw temperature data (input). Here’s how to do it:
- Open the Kinesis Management Console.
- Click Go to Streams.
- Choose Create Stream.
- Set the Stream Name to Temperature_data_inputStream.
- Set the Number of Shards to 1.
- Click Create.
From the AWS IoT Console, we need to pipe the data from AWS IoT into the temperature_data_stream that we created above.
In this step, we will enable an IoT device to stream data to Kinesis Data Stream. To do this, we have to create an IoT policy and attach the temperature sensor (IoT device) to that policy. Follow the steps below to do so:
- Click the Create Policy button.
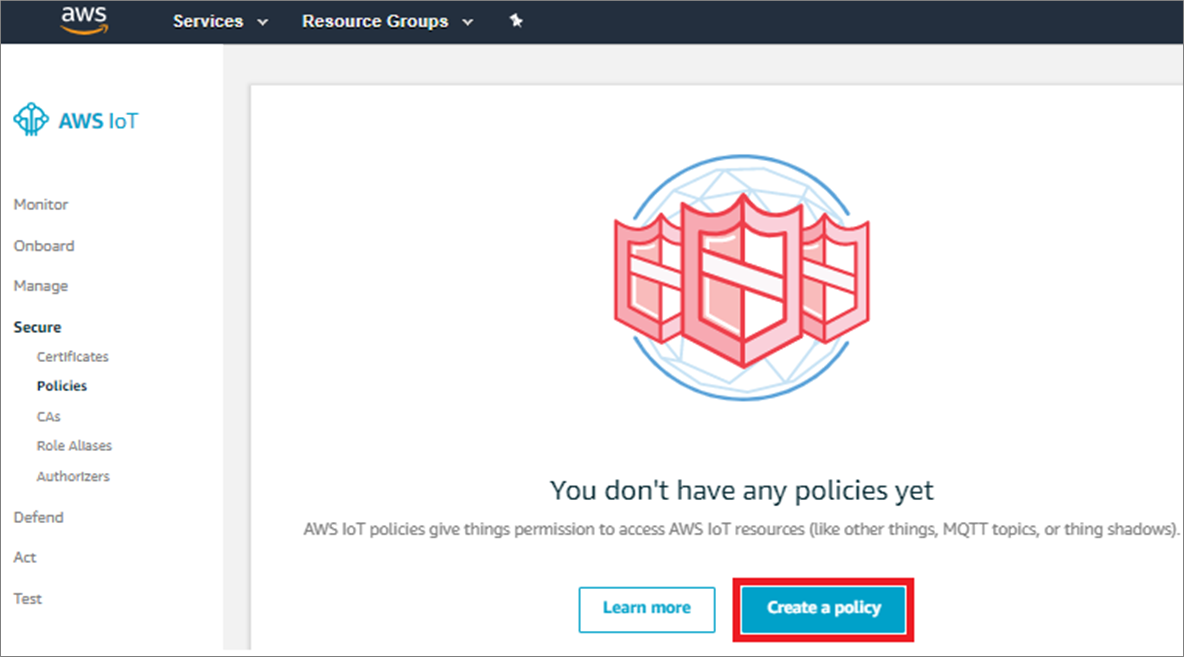
- In the next screen, name the policy as “Temperature_data_Splunk” with the action as “IoT publish.” In the Resource ARN section, specify the Kinesis stream ARN that we created in the previous step.
. - Select effect as Allow and click Create a Policy to complete the process.

Step 3: Configure Splunk HTTP Event Collector (HEC) to Receive IoT Data
This step assumes that Splunk Enterprise is already installed and configured in the environment. In case Splunk is not installed, please see detailed steps in the documentation.
The capability of Splunk to ingest data form different sources is extended by Splunk add-ons. Splunk offers an add-on for Amazon Kinesis Data Firehose as well, which helps to ingest data from Kinesis stream into Splunk. This add-on is available for download from Splunkbase.
Install the Kinesis Firehose add-on on Splunk indexers that are configured with the HEC.
Before we can use Kinesis Data Firehose to deliver data to Splunk, we have to set up the Splunk HEC to receive data.
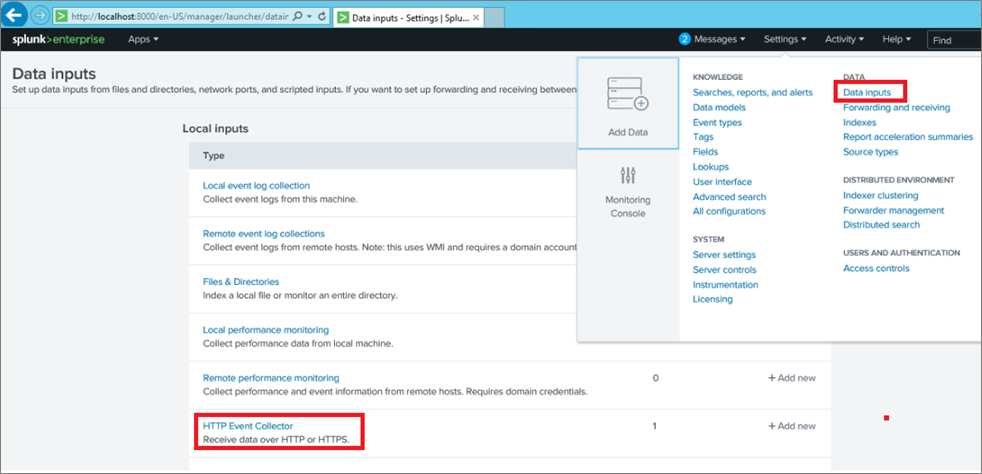
- From the Splunk Web Console, go to the Settings menu.
- Select Data Inputs, and choose HTTP Event Collector.
- Choose Global Settings.
- Ensure that All Tokens is enabled and port 8088 (default) is configured for Splunk HEC.
- Select Save.
Next, choose New Token to create a HEC endpoint and token. When you create a new token, make sure that Enable Indexer Acknowledgment is checked.
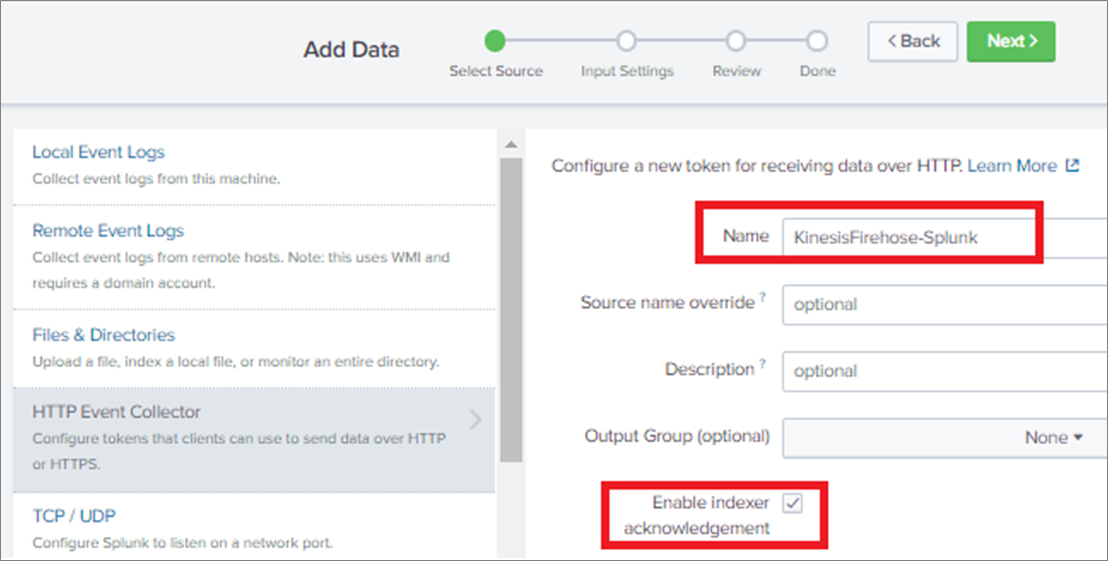
The token generated will be used for setting up a secure communication between Kinesis Data Firehose and Splunk HEC.

Step 4: Configure Kinesis Data Firehose to Send Data to Splunk HEC
The process of configuring Kinesis Data Firehose to send data to Splunk starts with creating a bucket in Amazon Simple Storage Service (Amazon S3). This bucket is used in situations where Kinesis Data Firehose can’t deliver data to Splunk HEC.
You can configure this feature to back up all data, or only the data that’s failed during delivery to Splunk.
Create an Amazon S3 Bucket
To create an Amazon S3 bucket, either use the AWS console or command line using the following syntax:
aws s3 createbucket –bucket splunk-iot-failed –create-bucket-configuration LocationConstraint=ap-southeast-1
Note that ap-southeast-1 is the nomenclature for the AWS Singapore Region. Also note that bucket names are unique and you can’t use “splunk-iot-failed” bucket name again, so choose a different bucket name for your deployment.
Create a Kinesis Data Firehose Stream
On the AWS console, open Amazon Kinesis, go to the Firehose console, and choose Create Delivery Stream.
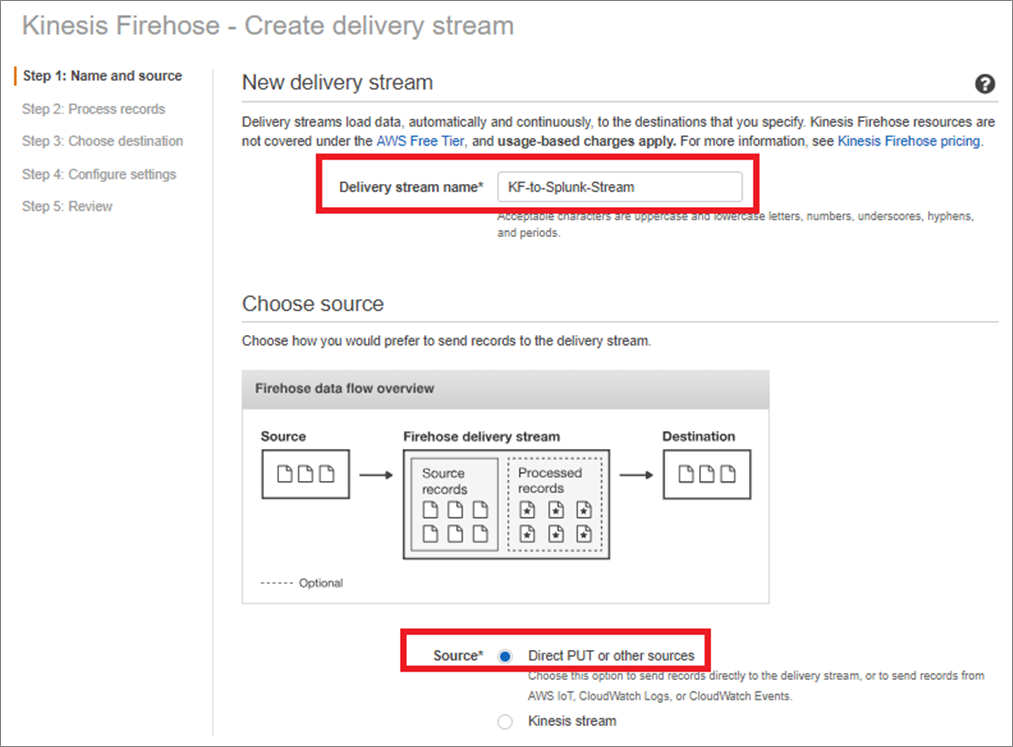
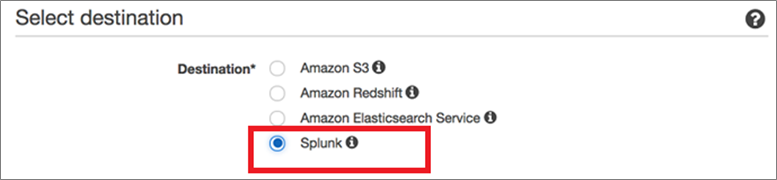
Select the destination as Splunk, which is natively supported, in the AWS Regions where Kinesis Firehose is available.
Note that Amazon Kinesis Data Firehose requires Splunk HEC endpoint to have a valid SSL certificate matching a valid DNS hostname for the Splunk HEC. You will encounter delivery errors if you’re using a self-signed certificate.
In case a valid SSL certificate is not available, then the Splunk HEC can be placed behind an Elastic Load Balancer that can use a certificate issued by AWS Certificate Manager. For more information, see the documentation.
In the event when Splunk HEC is not available, Kinesis Data Firehose will send the data to the Amazon S3 buck that is created for storing backup data. In this example, we are only backing up logs that fail during delivery in the Amazon S3 bucket. The data, which could not be ingested due to some error or non-availability of the Splunk server, can be re-ingested to the Kinesis source stream using an appropriate AWS Lambda function.

To monitor your Kinesis Firehose delivery stream, enable “CloudWatch error logging.” This will help you to monitor and record delivery errors.
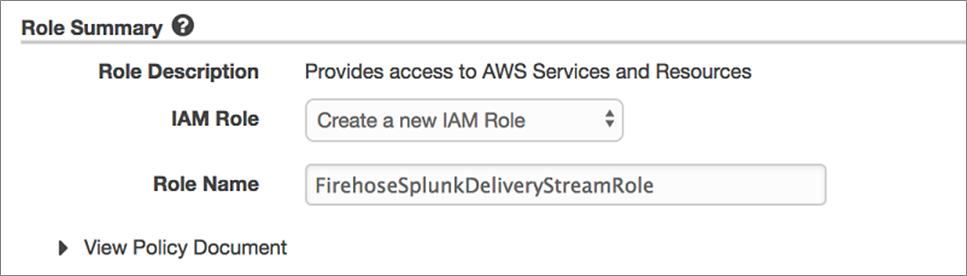
Select Create a New IAM Role, give the role a name (such as FirehoseSplunkDeliveryStreamRole), and then choose Allow.
Now, you can review the Firehose Data Stream settings. When you’re satisfied, choose Create Stream to get a confirmation once the stream is created and active.

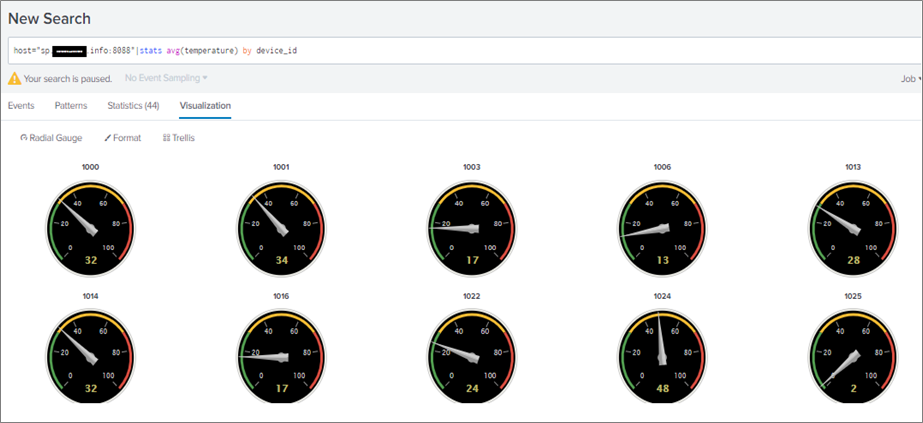
Once Kinesis Firehose starts ingesting data into Splunk HEC, the time series data will be visible in Splunk. You can visualize the data by running an appropriate query on the data stored in Splunk. Here, we have used the following query to display data from different temperature sensors:
host=”sp.xxxxxx.info:8088″|stats avg (temperature) by device_id
The following dashboard is returned for the above query depicting temperature data from different IoT devices.
In addition to displaying IoT data through intuitive dashboards, Splunk also supports initiating actions on the data by using “Alerts” functionality. An alert is a notification mechanism to let you know when an event of interest has occurred. You can configure Splunk to trigger an alert whenever a search returns a result that matches a threshold or trend setting you specify.
When getting started with alerts, consider the following:
- Conditions: What are the events you want to know about?
- Type and frequency: How often do you want to be made aware of events?
- Alert action: What should happen when an alert occurs?
You always start the alert creation process in the same way: create a search and then save it as an alert.

To learn more about Splunk Alerts, see the documentation.
Summary
In this post, we learned about configuring AWS IoT services to send IoT data to Splunk using Amazon Kinesis Data Firehose.
Splunk and AWS IoT are the right combination to generate a meaningful analysis of the IoT data and take appropriate actions if there is any breach.
This scenario is very common in manufacturing industries, wherein the IoT sensors generate large amount of data, which needs to be analyzed in real-time and meaningful actions needs to be taken.
.
|
Splunk – APN Partner Spotlight
Splunk is an AWS IoT Competency Partner. Its software and cloud services enable customers to search, monitor, analyze, and visualize machine-generated big data from websites, applications, servers, networks, IoT, and mobile devices.
Contact Splunk | Solution Overview | Buy on Marketplace
*Already worked with Splunk? Rate this Partner
*To review an APN Partner, you must be an AWS customer that has worked with them directly on a project.