AWS Marketplace
Full-stack observability of your AWS Control Tower landing zone with New Relic
Update June 16, 2021: In May 2021, AWS released an AWS Quick Start, which provides a simple, one-click implementation of New Relic’s integration with AWS Control Tower, with the following enhancements:
- Automatically enables New Relic’s AWS integration from your New Relic account. You no longer need to manually enable the integration from the New Relic account setup wizard in the UI, for every new AWS account.
- Enables you to add New Relic integration to your existing AWS accounts, in case you’ve already set up your landing zone.
The solution and the implementation guide referenced here will continue to work, but will no longer be maintained. Moving forward, use this AWS Quick Start.
As customers start their journey to the cloud, they’re faced with challenges. These can include knowledge about services, in-house technical capabilities, and the effort required to build an operational framework where they can manage their AWS environment. Having a centralized location to gain visibility into the applications running on multiple AWS accounts across Regions is a feature Tamara’s and my customers are asking for.
AWS recommends that customers adopt a multi-account strategy as a best practice to achieve higher isolation of resources and help meet security, regulatory, and compliance needs. Customers need to address questions around tracking their operational cost, identify security improvements, and ensure reliability and performance efficiency. Full-stack observability offers the troubleshooting tools needed, regardless of where problems occur.
AWS Control Tower is a service that helps customers build a scalable, secure, well-architected, multi-account environment, referred to as a landing zone. Account Factory automates the provisioning of new accounts in your AWS environment. You can enable self-service for your teams to configure and provision new accounts by using AWS Service Catalog. After you have set up your landing zone, you need visibility into your multi-account environment.
New Relic is an AWS Partner Network (APN) Advanced Technology Partner focused on delivering observability as a platform. New Relic One is New Relic’s observability platform that is open, connected, and programmable, and it’s now available in AWS Marketplace.
Customers often ask how they can integrate third-party solutions with AWS Control Tower. AWS Marketplace now offers a new category of solutions offering third-party software integrations to AWS Control Tower. In this blog post, Tamara and I show you how to deploy, activate, and configure New Relic’s AWS integration in your AWS Control Tower landing zone. This automates the integration of New Relic with your AWS accounts vended and enrolled by Account Factory.
Solution overview
New Relic’s integration with AWS Control Tower enables you to streamline the observability of your AWS multi-account environment with New Relic. With this solution, whenever a new AWS account is enrolled, it’s automatically integrated with your New Relic account using the New Relic Infrastructure integration. You can then manage all your AWS operational data and insights from one place, with no need to hop back and forth between multiple AWS accounts.
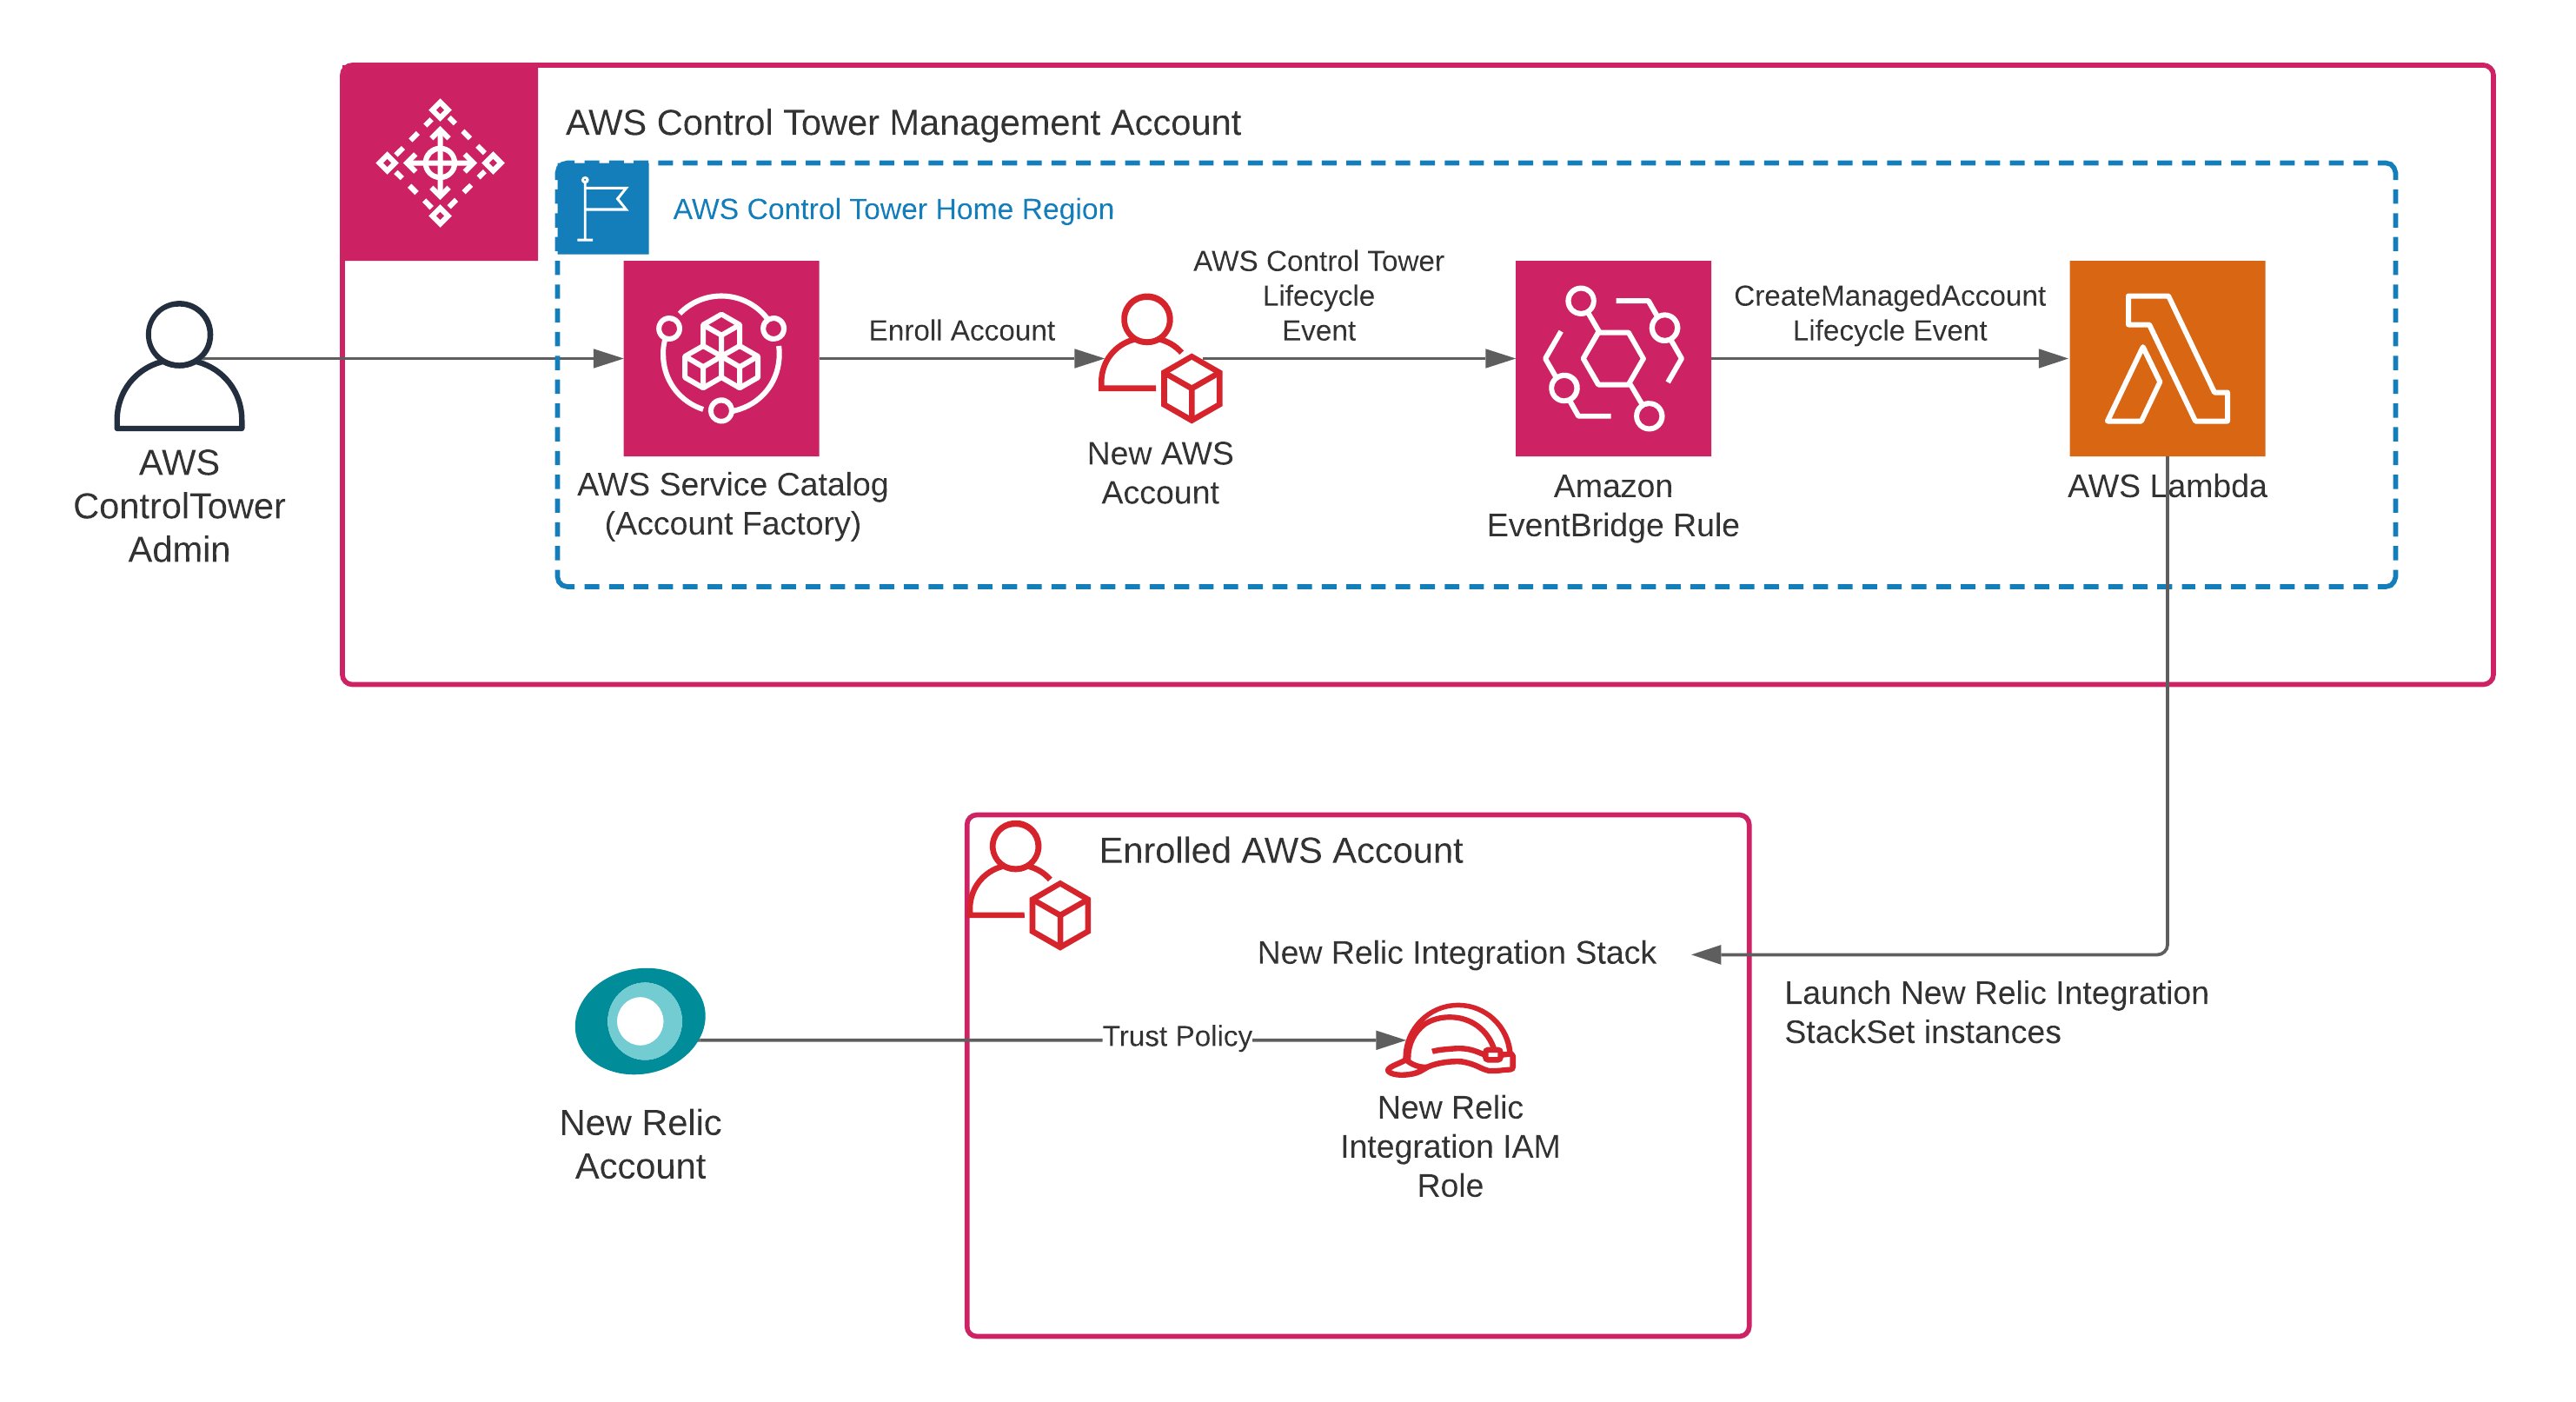
The solution is open source, and the code is available in New Relic’s GitHub repository. You must deploy New Relic AWS integrations in your AWS Control Tower management account in the home Region. Your home Region is the Region where the AWS Control Tower landing zone was set up. This solution uses AWS CloudFormation for its deployment, and it includes two AWS CloudFormation templates that you deploy in the following order:
- The New Relic Integration template creates a StackSet consisting of an AWS Identity and Access Management (IAM) role, named New Relic Integration.
- The New Relic AWS Control Tower Customization template creates a stack consisting of an Amazon EventBridge rule and an AWS Lambda function.
In your AWS Control Tower management account, an administrator uses Account Factory to vend a new account in your landing zone. After an account is enrolled, AWS Control Tower issues a lifecycle event that is delivered to EventBridge. The EventBridge rule accepts the lifecycle event, and in turn invokes a Lambda function. The Lambda function launches the New Relic Integration StackSet in the newly enrolled account in the home Region. New Relic AWS integrations require you to grant New Relic the permission to read operational telemetry data from your AWS account. This is achieved by using an IAM role named New Relic Integration, which uses IAM cross-account access. The StackSet includes the New Relic Integration IAM role, which uses the Amazon CloudWatch API to obtain metrics from the AWS services that you monitor. The last step is to activate AWS integrations for the newly enrolled AWS account from your New Relic account. After the activation is complete, you will start seeing observability data from your AWS account in New Relic.
Refer to the following architecture diagram.
Prerequisites
You need the following prerequisites to implement New Relic’s integration with AWS Control Tower:
- Fully deployed AWS Control Tower. For information about setting up an AWS Control Tower landing zone, see Getting Started with AWS Control Tower. You also need administrator privileges in the AWS Control Tower management account.
- An active New Relic account with Standard or higher pricing tier subscription, when using the new New Relic One pricing plan. Don’t have an account yet? Sign up for a perpetually free access to New Relic, which includes 100 GB of ingest per month and one Standard User license. You can also contact New Relic Sales for more details.
Implementing New Relic’s integration with AWS Control Tower
Follow these steps to implement New Relic in your AWS Control Tower environment.
Step 1: Create an AWS CloudFormation StackSet
First, create an AWS CloudFormation StackSet from newrelic-stack-set.yml on GitHub. The AWS CloudFormation StackSet creates the required AWS IAM roles and managed policies to ensure that the correct access is granted.
- Keep the StackSet name as NewRelic-Integration.
- Replace YOUR_NEW_RELIC_ACCOUNT_ID with your New Relic account ID. For more information about how to get this information, see Account ID in the New Relic documentation.
- Replace YOUR_CONTROL_TOWER_MANAGEMENT_ACCOUNT_ID with your AWS account ID. For further details on how to get this information, see Your AWS account identifiers in the AWS General Reference.
To create the StackSet, run the following AWS Command Line Interface (AWS CLI) command in AWS CLI. If you have AWS profiles set up, include –-profile <Profile Name>.
aws cloudformation create-stack-set \
--stack-set-name NewRelic-Integration \
--template-body https://raw.githubusercontent.com/newrelic-experimental/newrelic-control-tower-customization/master/templates/newrelic-stack-set.yml \
--description "Adds in New Relic integration to your AWS accounts" \
--parameters ParameterKey=NewRelicAccountNumber,ParameterValue=<YOUR_NEW_RELIC_ACCOUNT_ID> \
--capabilities CAPABILITY_NAMED_IAM \
--administration-role-arn arn:aws:iam::<YOUR_CONTROL_TOWER_MANAGEMENT_ACCOUNT_ID>:role/service-role/AWSControlTowerStackSetRole \
--execution-role-name AWSControlTowerExecution
Step 2: Create an AWS CloudFormation stack
Next, create a stack. In AWS CLI, run the following command.
aws cloudformation create-stack \
--stack-name New-Relic-Control-Tower-Customization
--template-body https://raw.githubusercontent.com/newrelic-experimental/newrelic-control-tower-customization/master/templates/control-tower-customization.yml \
--capabilities CAPABILITY_NAMED_IAM
Step 3: Enable the integration with New Relic
In the previous step, we created the events, IAM roles and policies, and AWS Lambda functions to launch the resources to establish the AWS environment for the New Relic integration. Now, to start visualizing the data sent from your AWS accounts, you must enable the integration from your New Relic account.
- Log in to your New Relic account.
- Click the Infrastructure link on the top navigation bar. You will be taken to the Infrastructure page. If you happen to have access to multiple New Relic accounts, begin by choosing the New Relic account that you used for this implementation, from the drop down list labeled Infrastructure, in the top left area of the screen. Otherwise, you should already see your New Relic account show up next to the label. Make sure the account ID matches the one you used in this implementation.
- Next, select the AWS tab and finally click the + Add an AWS account link, in the right portion of the screen. In case you are adding an AWS account to your New Relic account for the first time, you may see a different screen. As instructed on the screen, click any service tile to get started.
- If you see the “Choose an integration mode” screen, click “Use API polling” button.
- You will be presented with a multi-step account setup wizard. Since the solution automates the New Relic integration in your AWS accounts, you can move past the first few steps by clicking the Next button on each step until you get to Step 5 named Account Details. You are skipping the steps since the solution automates the process of setting up the “New Relic Integration” IAM Role (done in Step 1 through Step 3). Step 4 named Budgets Policy is optional but recommended for you to keep track of your AWS cost.
- While you are in the Account Details step, type in the preferred name for your AWS account. This can be anything that helps you identify your AWS account from your New Relic account. Since you can integrate multiple AWS accounts, choose a name that’s unique, or try matching it with the actual name of your AWS account. Enter the ARN of the “New Relic Integration” IAM role that was setup by the solution in your newly enrolled AWS account.
- Under Paste the ARN create in the previous step, enter the Role ARN. To find the ARN:
- While logged in the newly vended AWS Control Tower account, open the IAM console.
- In the left-hand side navigation pane, choose Roles.
- In the search box, enter NewRelicIntegrationRole_<YOUR_NEW_RELIC_ACCOUNT_ID>.
- Choose the role and copy the value next to Role ARN.
- Finally, Click Next button. You will be taken to Step 6, named Select Services. Select the AWS services you would like to monitor.
A detailed step-by-step walk-through of these instructions, along with screenshots, can be found in the implementation guide.
Discovering prebuilt dashboards
Now that you have integrated AWS Control Tower and New Relic, you can use the full-stack observability capabilities of New Relic. In these sections, Tamara and I show you how to find prebuilt dashboards and show samples of custom dashboards we created:
- Explore built-in, curated dashboards for each AWS service integration
- Manage operational data and gain observability insights of your AWS multi-account environment
- Use dashboards to track, forecast, and optimize the cost and consumption of your AWS services
- Set up dynamic alerting that scales with your AWS infrastructure
To find prebuilt dashboards, do the following:
- Log in to your New Relic account and navigate to Infrastructure. If you have access to multiple New Relic accounts, in the upper left, select your New Relic account from the drop-down menu.
- To see a full listing of your multi-account environment in AWS, choose the AWS tab. Each one of the integrated AWS accounts is listed vertically with a corresponding tabular section for each account. The table displays all the integrations (AWS services) that you set up during your AWS account activation.
- Beside each integration are links to respective curated dashboards, data exploration, documentation, and alerts setup. Choose the dashboard you want to explore.
- In the upper-right side of the tabular panel next to each account is the Account status dashboard. Choose that link to view your account status.
Guide to dashboard building and sample dashboards
Before you build a dashboard, determine the metrics that you’re interested in. New Relic provides an inventory view that enables you to quickly view services and possible metrics. After you have identified the services to observe, determine the key performance indicators (KPIs) and service level objectives (SLOs) to measure operational performance and set thresholds for when alerts should be issued.
If you’re unsure where to start, we recommend starting with latency, traffic, errors, and saturation. These are commonly used metrics that can help expose operational issues. Then find one or two high-level service level indicators (SLIs) representing the overall health of your services. For detailed insights, see New Relic’s phased approach to observability and choose the approach based on the maturity level of your DevOps processes. To create a dashboard, see Introduction to dashboards in the New Relic documentation. You can also build comprehensive alerting solutions by implementing New Relic alerts. For more information on how alerts work in New Relic, see Introduction to Alerts.
Digital customer experience dashboard
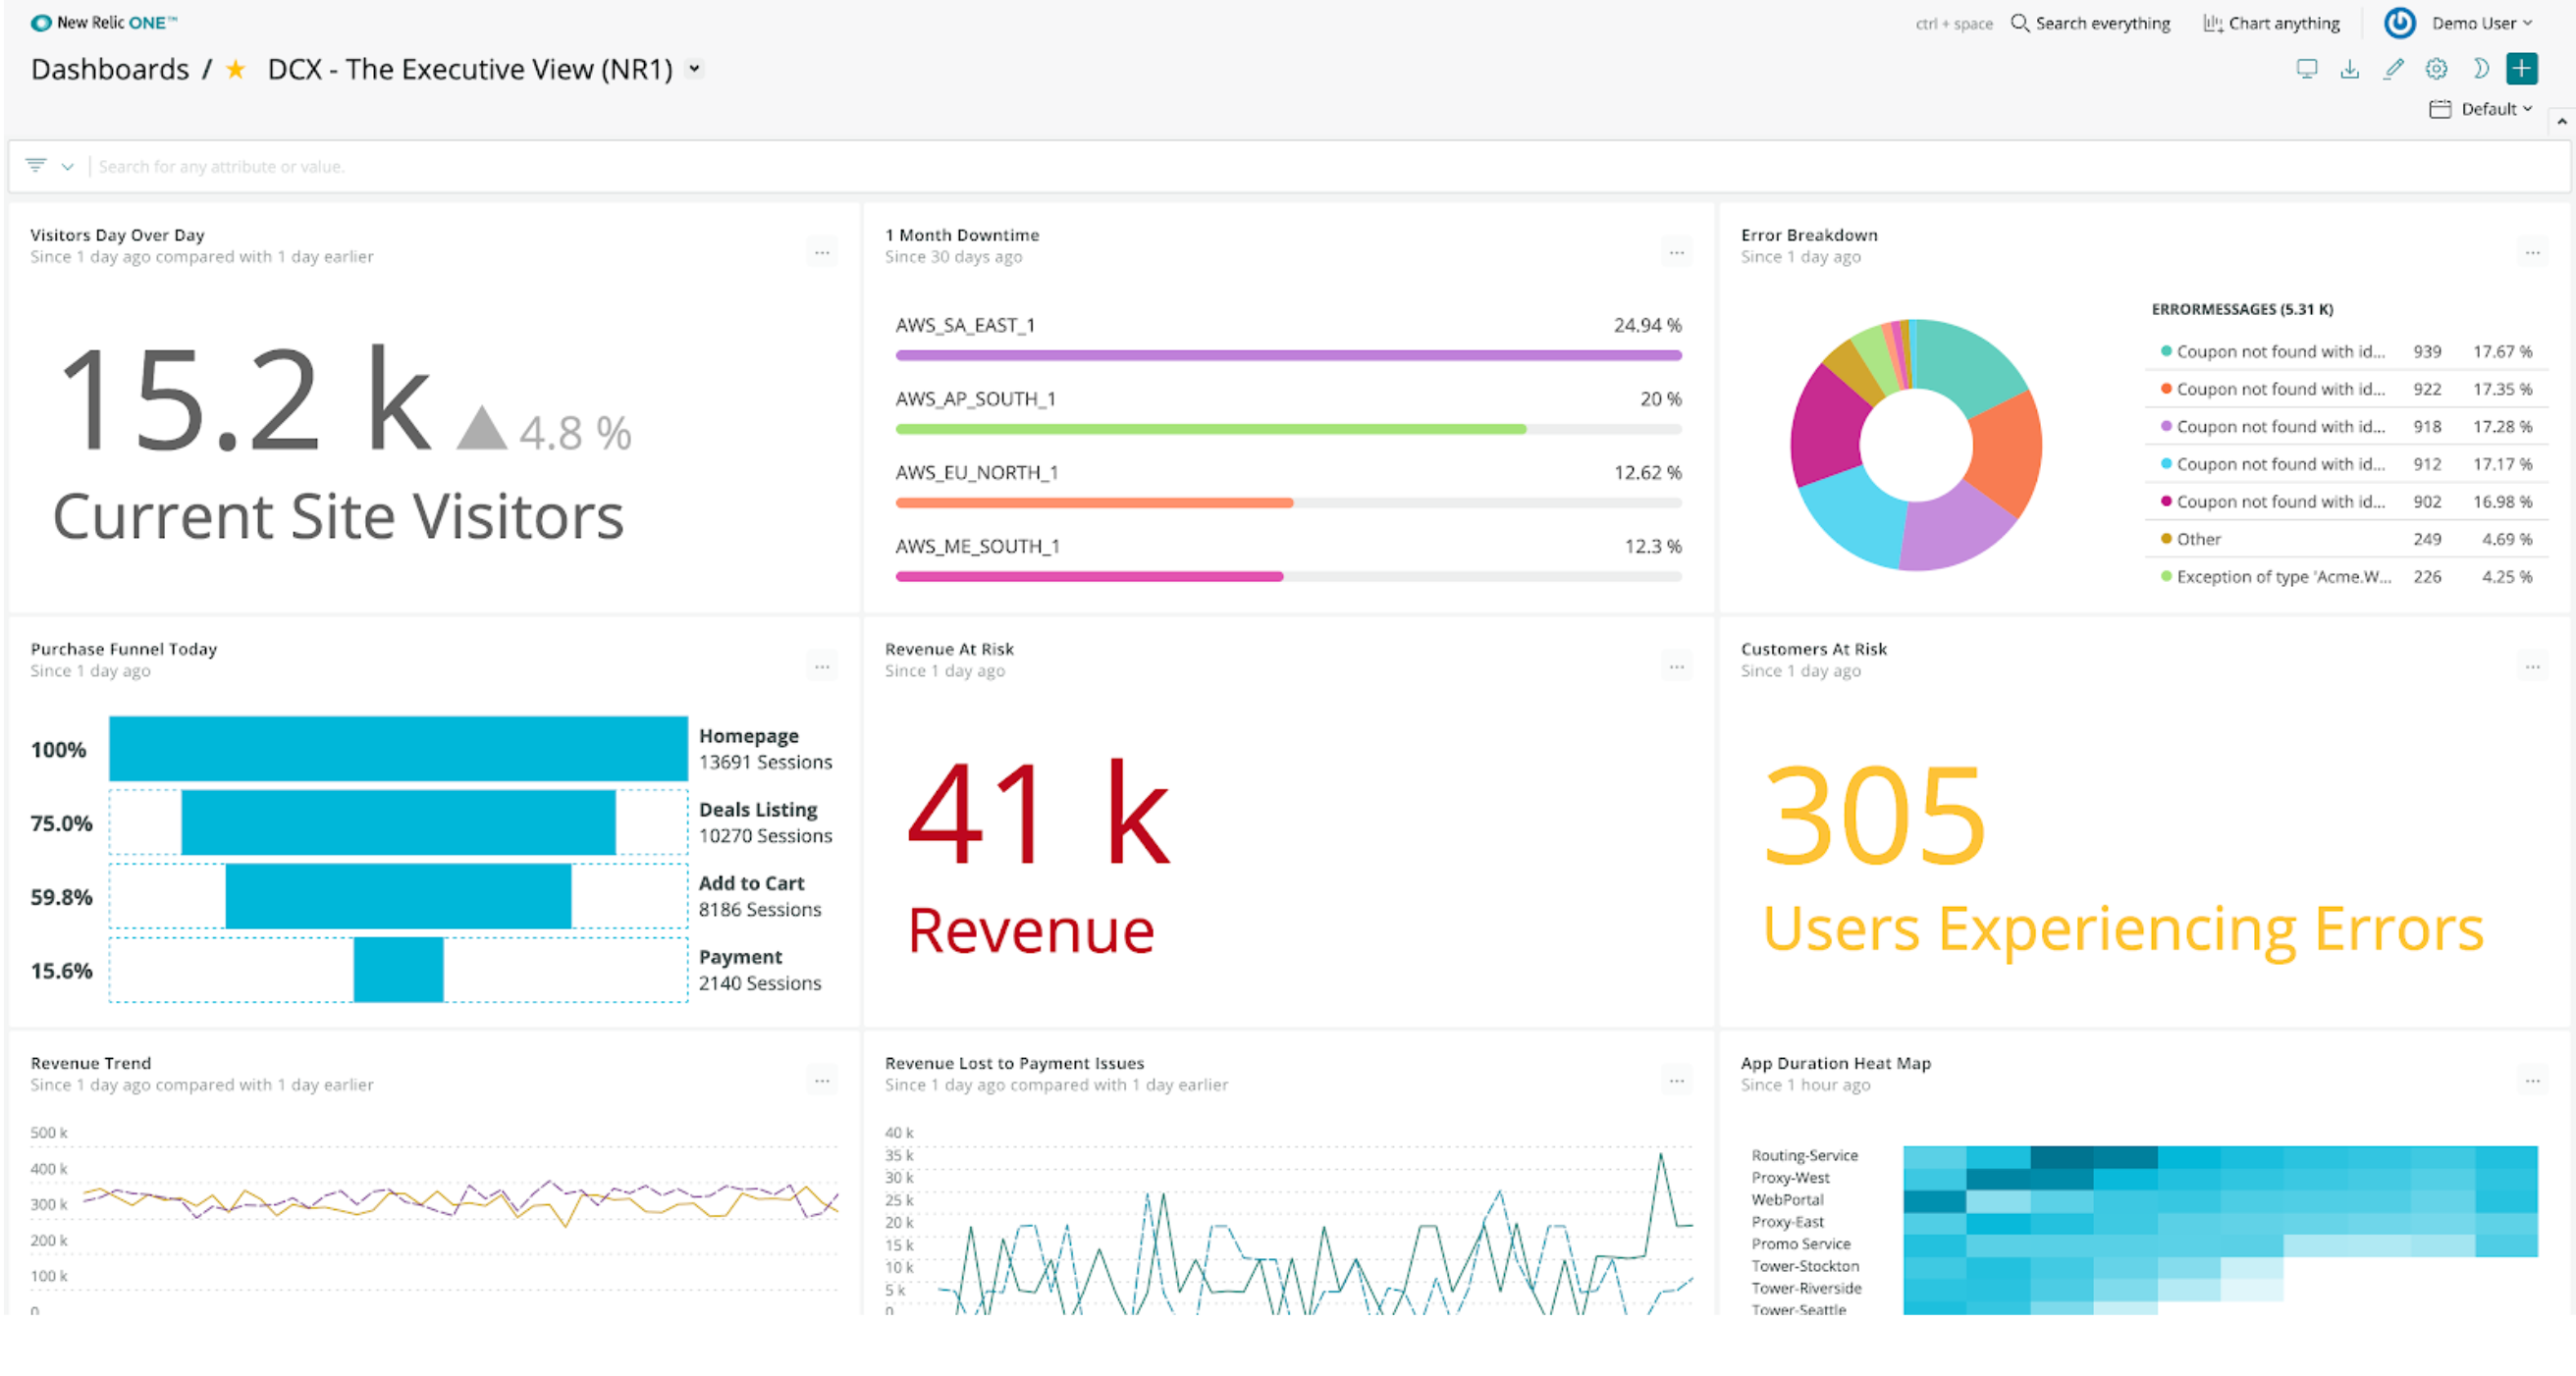
We built some sample dashboards to show how to help drive insights from operational data that New Relic manages for you. The following dashboard illustrates the customer experience insights for an e-commerce application and includes the following business KPIs:
- The number of visitors, day over day
- Monthly downtime, grouped by Regions
- A section for the number of end-user facing errors encountered and error breakdown by categories in a pie chart
- A heat map view to depict the average duration grouped by applications.
Aligned with the revenue, the dashboard also shows the purchase funnel from the home page all the way into the payment page. It also shows overall revenue at risk and revenue trends and lost revenue due to certain error categories.
The following screenshot shows our sample digital customer experience dashboard. The left column shows a billboard of visitors day over day with a count of 15.2K, a bar chart of purchase funnel today, and the revenue trend. The middle column shows a one-month downtime bar chart indicating a per region percentage downtime. It also displays a revenue at risk billboard, and the trend of revenue lost to payment issues. The right column shows a doughnut chart of error breakdowns, a billboard indicating a total of 305 customers experiencing errors, and an app response time heat map.
Alerts in action dashboard
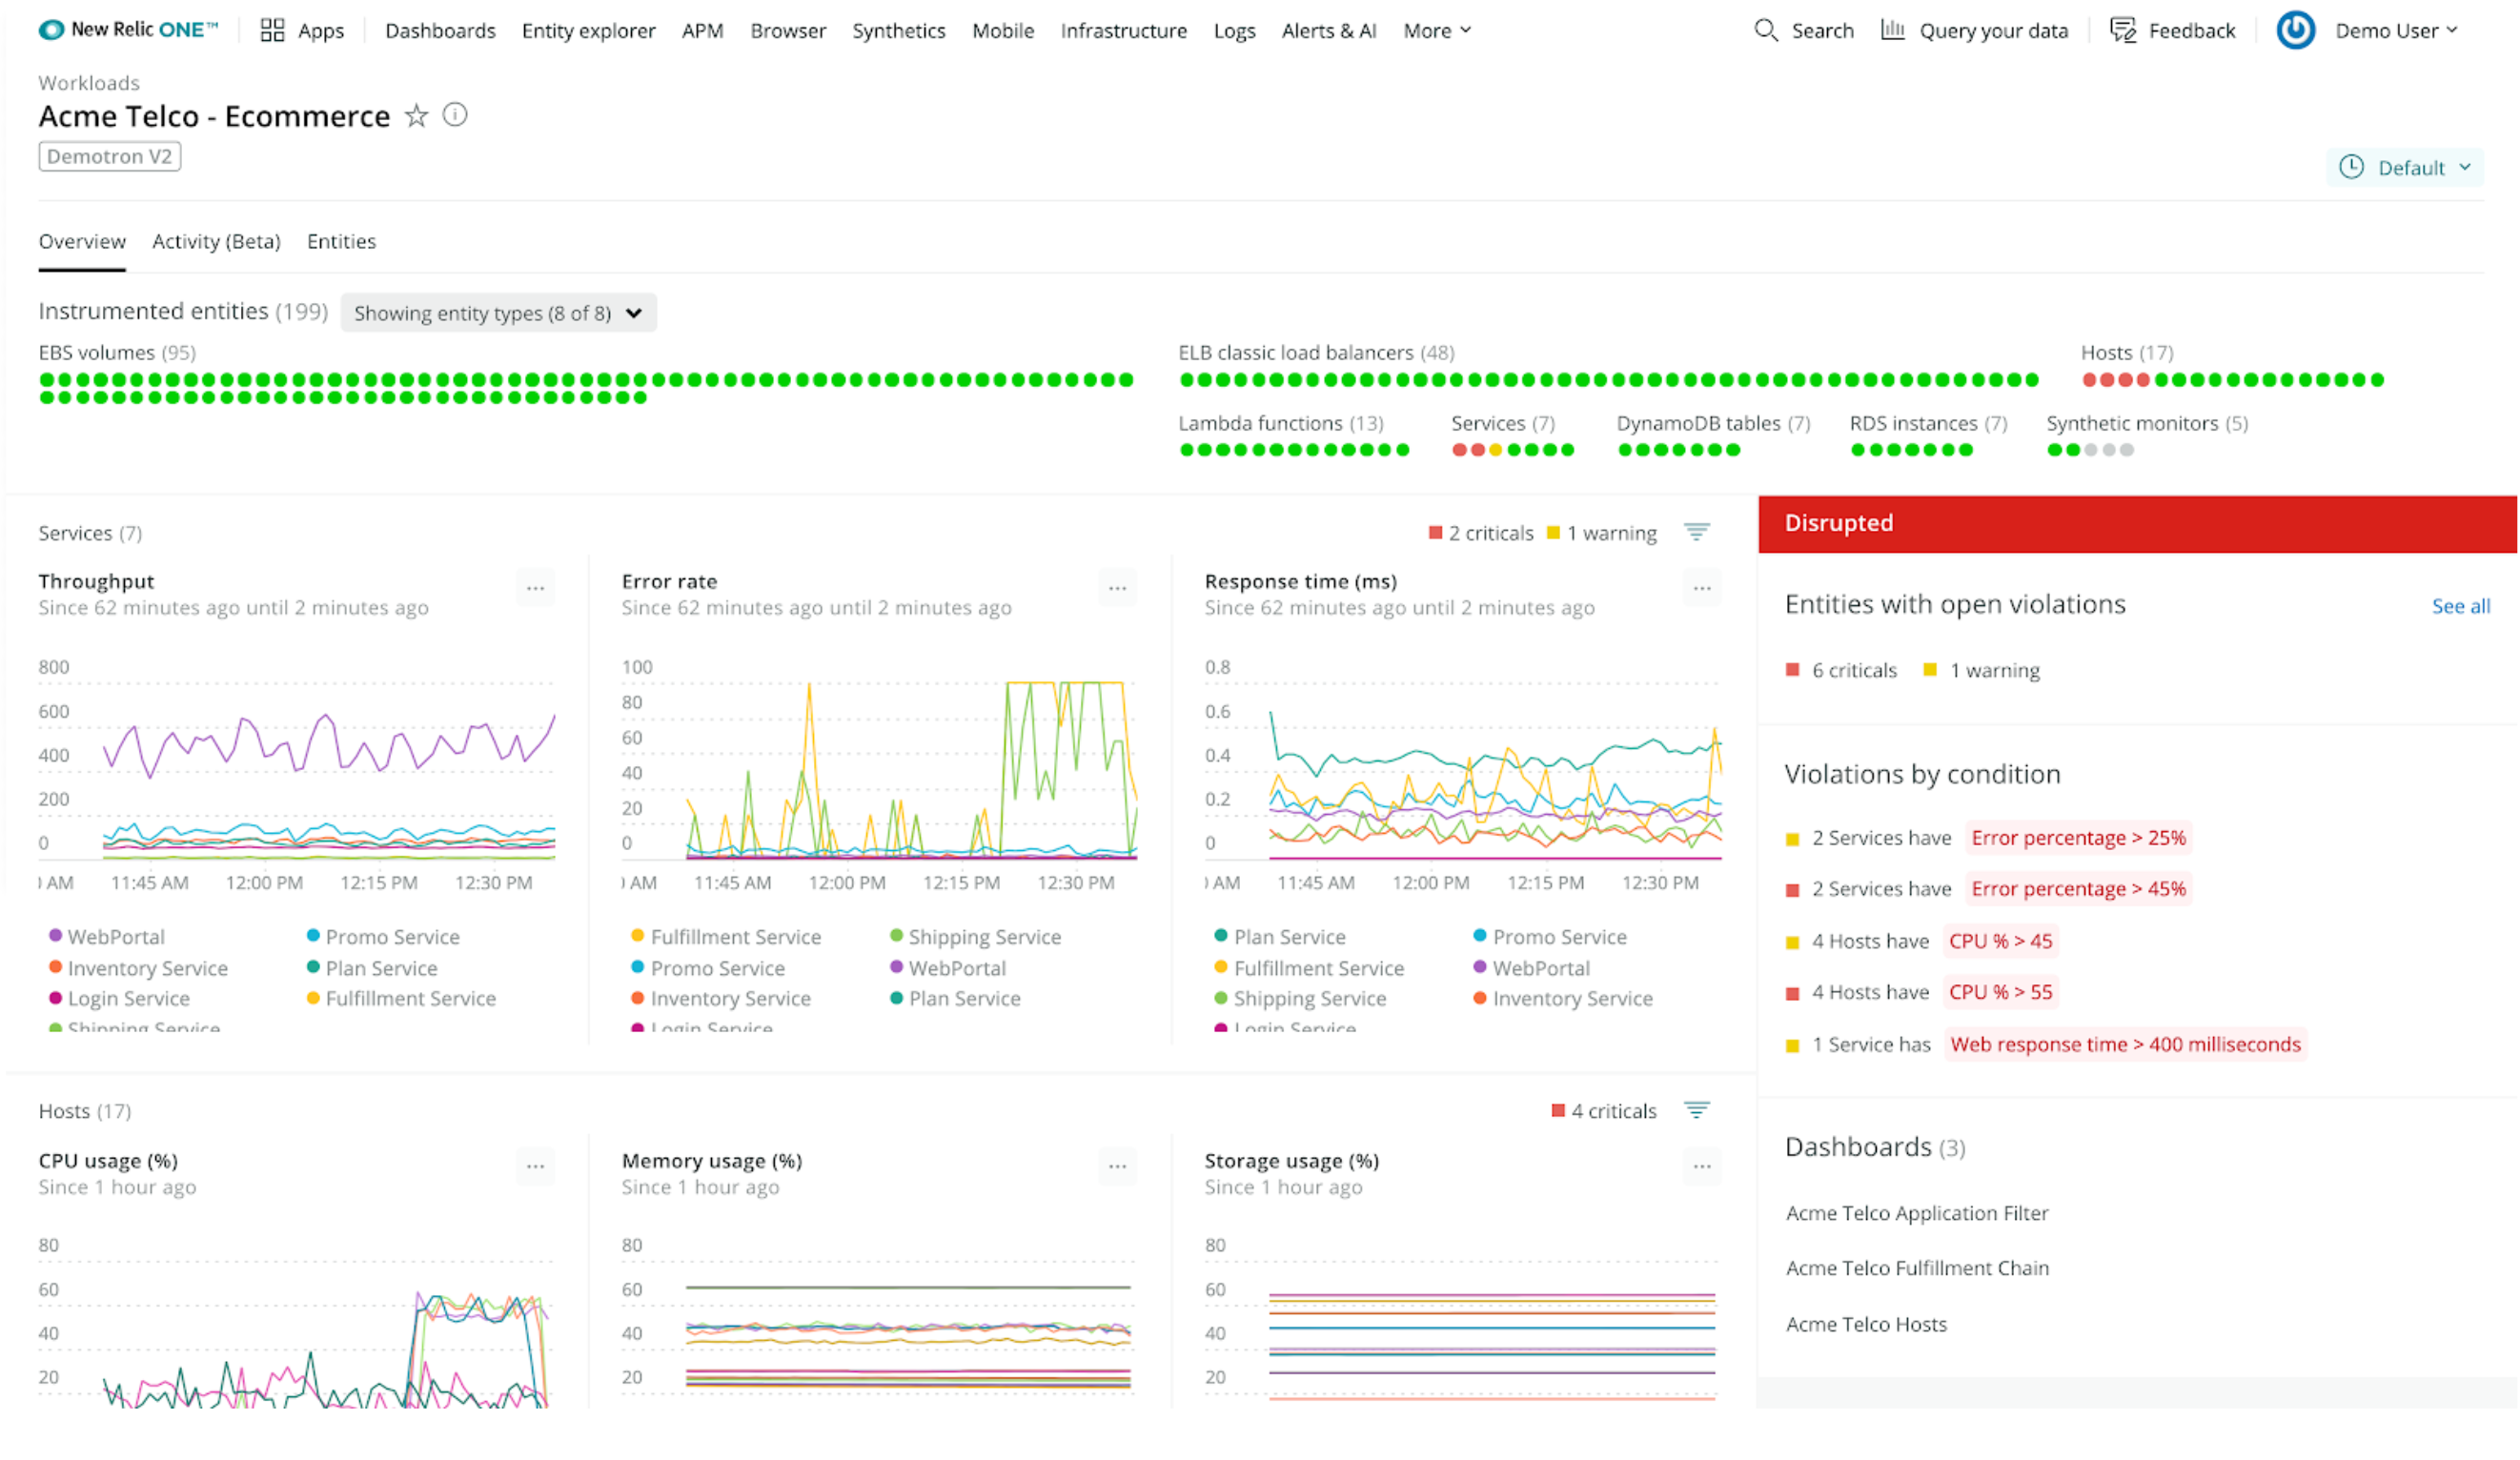
For real-time, full-stack tracking of anomalies in your applications, the following dashboard depicts alerts in action. You can visualize each application’s throughput, error rates, response time, and the health of various AWS services running your workloads. To identify trends and bottlenecks, you can visualize your Amazon EC2 host metrics including CPU, memory, and storage usage. You can quickly identify entities with open violations and view the details of each violation.
The following screenshot shows our sample operational dashboard created using New Relic Workloads. At the top, it shows the health status of all the instrumented entities like EBS volumes, ELB load balancers, Lambda functions, among others. On the left-hand side it shows services and host metrics. The middle section shows service metrics like throughput, error rate and response time. The bottom section shows host metrics like processor, memory, and storage utilization. The panel on the far right, highlighted in red, shows entities with open violations such as services with error percentage over 25% and hosts with CPU utilization over 55%.
Billing and cost management dashboard
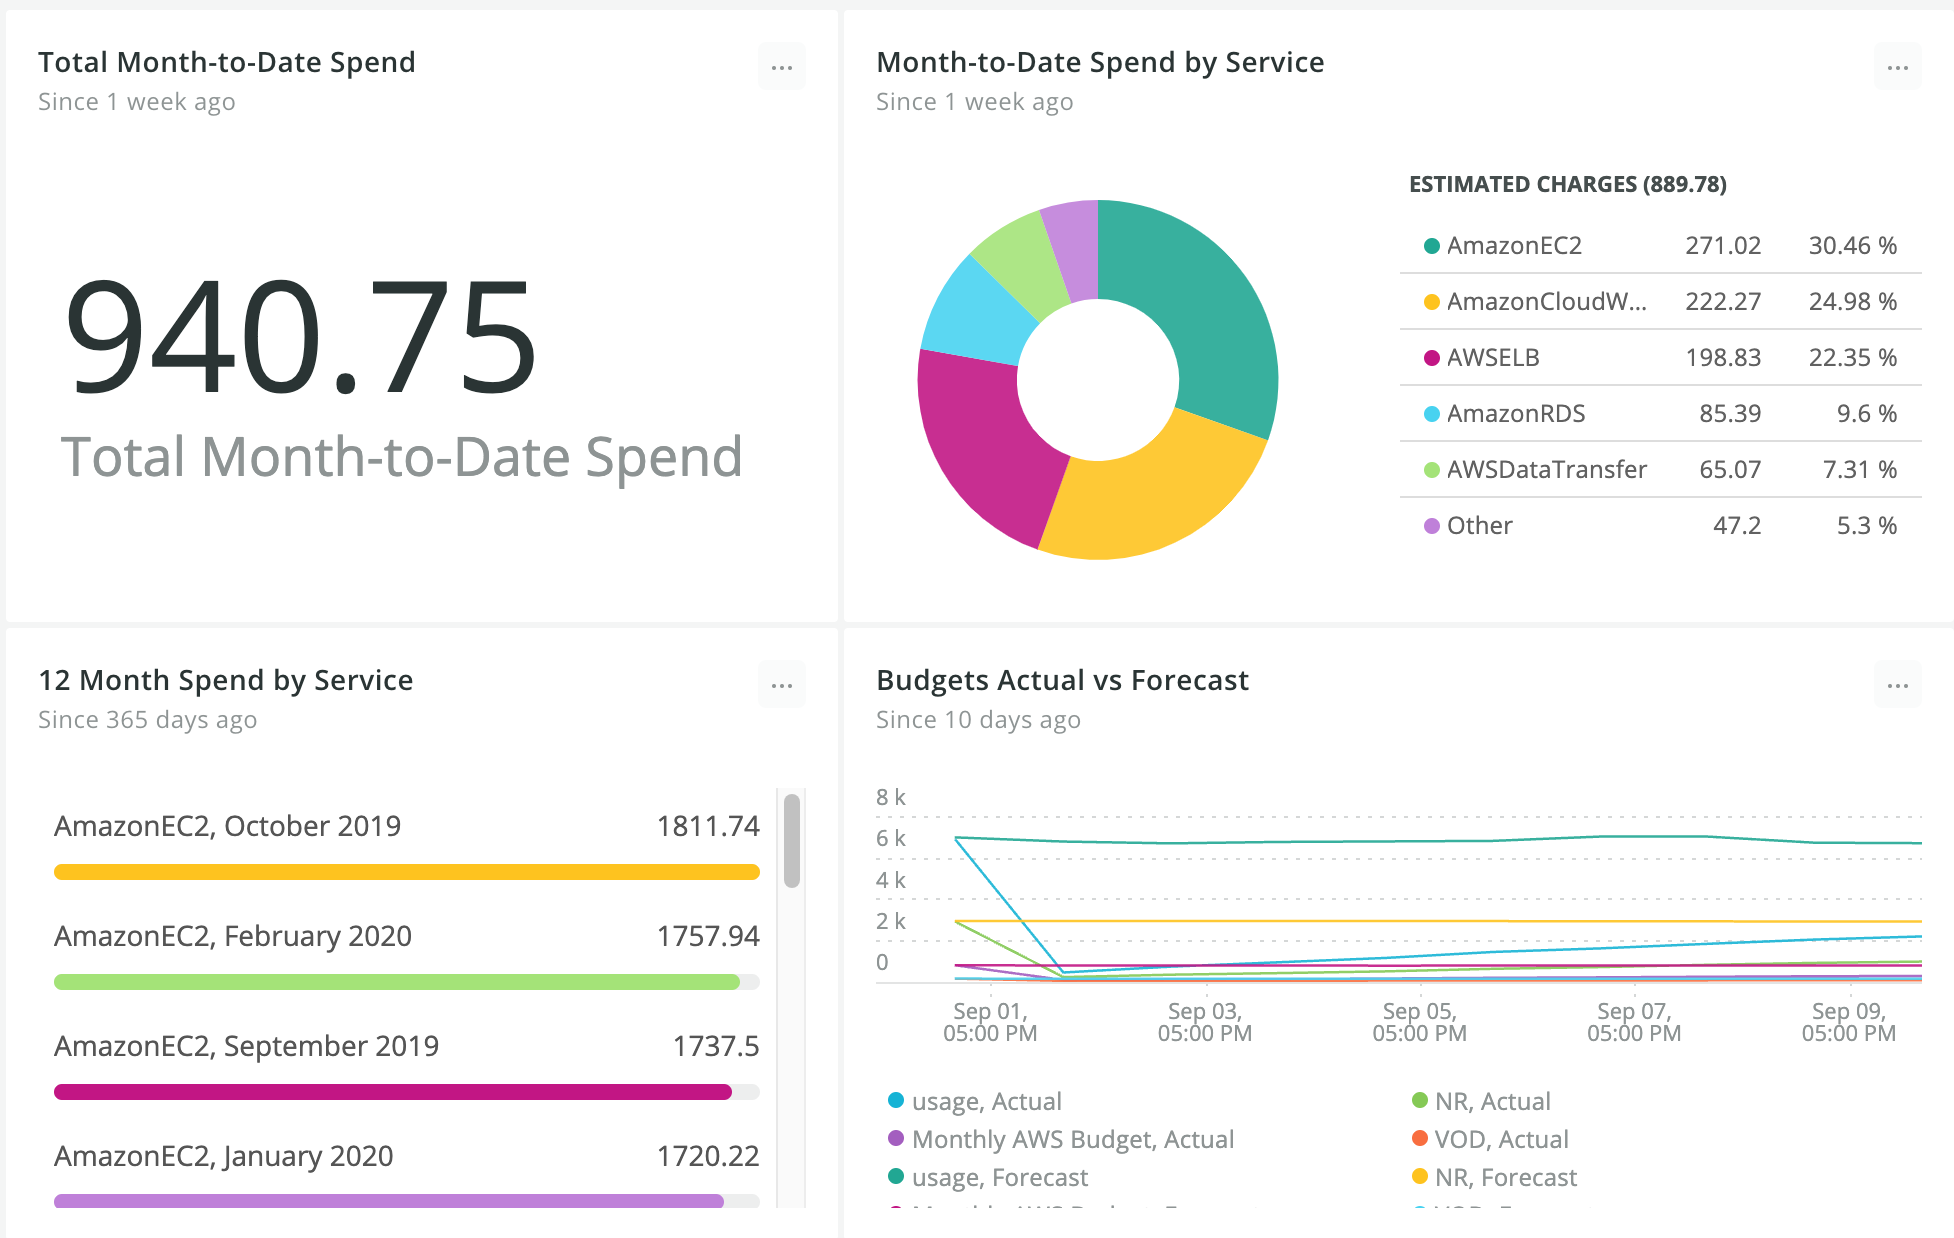
For tracking and forecasting your AWS cost against the set budgets, you can build a dashboard that plots the data collected from AWS Billing and Cost Management integration. The following dashboard captures:
- The total month-to-date cost
- A breakdown of the cost grouped by AWS services in a pie chart
- The 12-month spend trend grouped by services
- A comparison of the actual cost in contrast with the forecast cost
The following screenshot shows our sample cost management dashboard. At the top it shows the Total Month-to-Date Spend billboard; on right hand side it shows a pie chart of the Month-to-Date Spend by Services. The bottom left section shows the 12-month spend across services. On the bottom right hand side, it shows a line chart that represents the actual spend by budget category compared to the forecast.
Conclusion
In this blog post, Tamara and I showed you how you can gain full-stack observability across your multiple-account AWS environment with New Relic’s integration with AWS Control Tower. We described the architecture and implementation of New Relic’s integration with AWS Control Tower solution. We walked through the steps to procure from AWS Marketplace, deploy, activate, and configure New Relic’s AWS integration in your AWS Control Tower landing zone. We showed examples of dashboards you can build in New Relic to gain visibility into your customer experience, operational health, and cost management. For more information, see New Relic in AWS Marketplace.
About the authors

Rohit Kaul is a Senior Partner Solutions Consultant at New Relic. He enjoys helping customers with their digital modernization and cloud journeys and solving the architectural and observability challenges along the way. He brings in diverse IT and software engineering expertise and has helped customers across the music, media and entertainment, automobile, oil and gas, and educational services industries.

Tamara Gagliardi is a Solutions Architect at AWS. In her role, she provides architecture and technical guidance to customers to help them adopt best practices in the cloud. She has experience in a variety of industries including telecommunications, consumer goods, IT services, automotive, and manufacturing. Before joining AWS, Tamara worked as part of a networking and edge team, where she helped architect and deploy global solutions.