AWS Big Data Blog
Category: Management & Governance
Best practices for right-sizing Amazon OpenSearch Service domains
In this post, we guide you through the steps to determine if your OpenSearch Service domain is right-sized, using AWS tools and best practices to optimize your configuration for workloads like log analytics, search, vector search, or synthetic data testing.
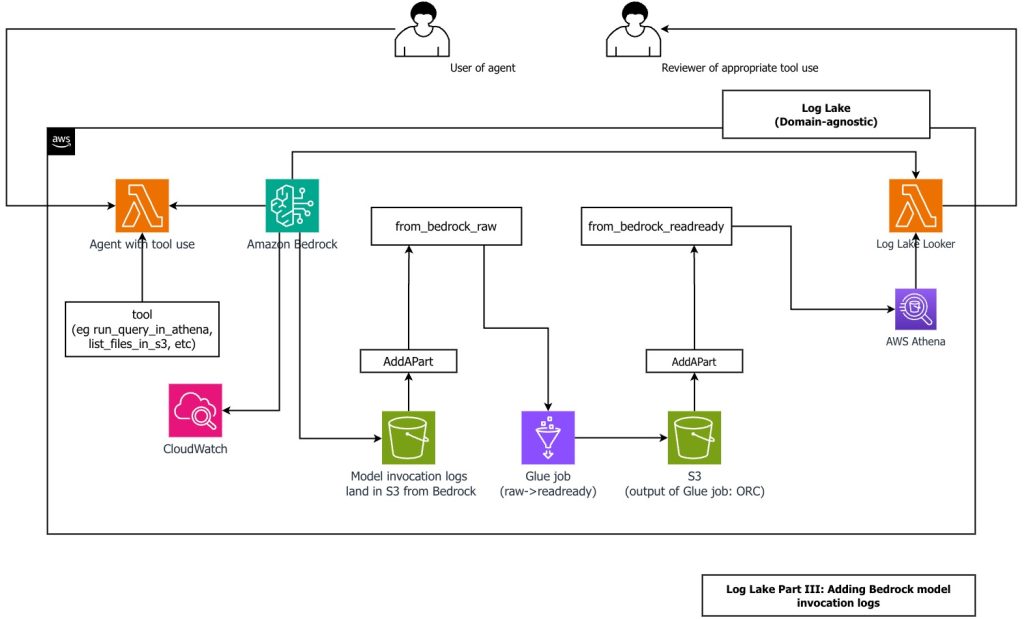
Create a customizable cross-company log lake, Part II: Build and add Amazon Bedrock
In this post, you learn how to build Log Lake, a customizable cross-company data lake for compliance-related use cases that combines AWS CloudTrail and Amazon CloudWatch logs. You’ll discover how to set up separate tables for writing and reading, implement event-driven partition management using AWS Lambda, and transform raw JSON files into read-optimized Apache ORC format using AWS Glue jobs. Additionally, you’ll see how to extend Log Lake by adding Amazon Bedrock model invocation logs to enable human review of agent actions with elevated permissions, and how to use an AI agent to query your log data without writing SQL.
Amazon OpenSearch Serverless monitoring: A CloudWatch setup guide
In this post, we explore commonly used Amazon CloudWatch metrics and alarms for OpenSearch Serverless, walking through the process of selecting relevant metrics, setting appropriate thresholds, and configuring alerts. This guide will provide you with a comprehensive monitoring strategy that complements the serverless nature of your OpenSearch deployment while maintaining full operational visibility.
Implement secure hybrid and multicloud log ingestion with Amazon OpenSearch Ingestion
In this post, we demonstrate how to configure Fluent Bit, a fast and flexible log processor and router supported by various operating systems, to securely send logs from any environment to OpenSearch Ingestion using IAM Roles Anywhere.

Correlate telemetry data with Amazon OpenSearch Service and Amazon Managed Grafana
In this post, we show you how to use Amazon OpenSearch Service and Amazon Managed Grafana to correlate the various observability signals that improve root cause analysis, thereby resulting in reduced Mean Time to Resolution (MTTR). We also provide a reference solution that can be used at scale for proactive monitoring of enterprise applications to avoid a problem before they occur.

How FINRA established real-time operational observability for Amazon EMR big data workloads on Amazon EC2 with Prometheus and Grafana
FINRA performs big data processing with large volumes of data and workloads with varying instance sizes and types on Amazon EMR. Amazon EMR is a cloud-based big data environment designed to process large amounts of data using open source tools such as Hadoop, Spark, HBase, Flink, Hudi, and Presto. In this post, we talk about our challenges and show how we built an observability framework to provide operational metrics insights for big data processing workloads on Amazon EMR on Amazon Elastic Compute Cloud (Amazon EC2) clusters.

How Volkswagen Autoeuropa built a data solution with a robust governance framework, simplifying access to quality data using Amazon DataZone
This second post of a two-part series that details how Volkswagen Autoeuropa, a Volkswagen Group plant, together with AWS, built a data solution with a robust governance framework using Amazon DataZone to become a data-driven factory. Part 1 of this series focused on the customer challenges, overall solution architecture and solution features, and how they helped Volkswagen Autoeuropa overcome their challenges. This post dives into the technical details, highlighting the robust data governance framework that enables ease of access to quality data using Amazon DataZone.

How Volkswagen Autoeuropa built a data mesh to accelerate digital transformation using Amazon DataZone
In this post, we discuss how Volkswagen Autoeuropa used Amazon DataZone to build a data marketplace based on data mesh architecture to accelerate their digital transformation. The data mesh, built on Amazon DataZone, simplified data access, improved data quality, and established governance at scale to power analytics, reporting, AI, and machine learning (ML) use cases. As a result, the data solution offers benefits such as faster access to data, expeditious decision making, accelerated time to value for use cases, and enhanced data governance.

Amazon EMR Serverless observability, Part 1: Monitor Amazon EMR Serverless workers in near real time using Amazon CloudWatch
We have launched job worker metrics in Amazon CloudWatch for EMR Serverless. This feature allows you to monitor vCPUs, memory, ephemeral storage, and disk I/O allocation and usage metrics at an aggregate worker level for your Spark and Hive jobs. This post is part of a series about EMR Serverless observability. In this post, we discuss how to use these CloudWatch metrics to monitor EMR Serverless workers in near real time.

Data governance in the age of generative AI
Data is your generative AI differentiator, and a successful generative AI implementation depends on a robust data strategy incorporating a comprehensive data governance approach. Working with large language models (LLMs) for enterprise use cases requires the implementation of quality and privacy considerations to drive responsible AI. However, enterprise data generated from siloed sources combined with […]