AWS Database Blog
How to build a real-time sales analytics dashboard with Amazon ElastiCache for Redis
Most often, when we discuss Amazon ElastiCache, it is in the context of enhancing the performance of read-heavy database workloads. We update our applications to employ a read-through or write-through pattern to keep data in the cache fresh and ease the burden on the database. When used in this context, ElastiCache accelerates your high volume workloads by caching your data in memory, delivering sub-millisecond data retrieval performance. Additionally, Amazon ElastiCache for Redis improves the availability and fault tolerance of your workload via automatic failover in Multi-AZ configurations.
However, ElastiCache can deliver a great number of other benefits that not only make your workload more performant, but also deliver new capabilities. In this post, we explore several of these features in the context of a real-time sales analytics dashboard built on ElastiCache for Redis.
The dashboard code and sample architecture that are used in this example are available from the aws-elasticache-retail-dashboard repository on GitHub.
Dashboard metrics
Our dashboard provides near real-time metrics for a high-volume e-commerce site with an extensive product catalog. Building such a dashboard using a relational database would require a complex set of resource-intensive queries. Instead, we use a small number of Redis commands to track this data.
Our dashboard focuses on five key common sales metrics.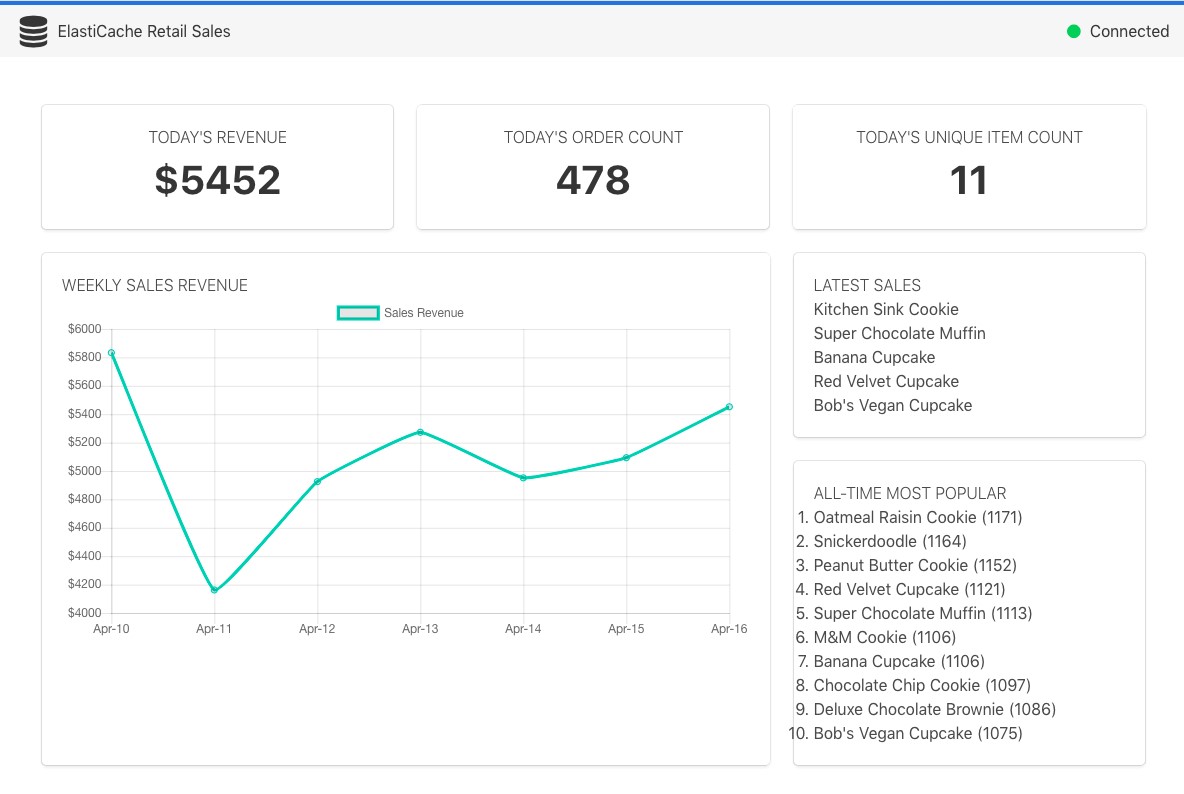
Daily order count
We start with a simple metric, daily order count. Each time an order is received, we increment the count of orders by one. The operation is fast and atomic, and it eliminates the need to count the number of rows in our relational database table. Each day, we create a new key, and Redis creates the key with an initial value of 0. Our dashboard is concerned only with the current day’s order count (we cover historical data later).
To increment our order count on March 11, 2018, we use the Redis INCR operation, which increments the integer value stored at the specified key. If the key does not exist, the value is set to 0 before the operation is performed:
We can then retrieve the value in integer format, as follows:
Number of daily unique items sold
Now that we have a count of the number of orders placed each day, let’s collect some data on the items that are sold in those orders. To start, let’s track the number of unique items (by SKU or unique identifier) that are sold each day. Like our order count metric, we could write a SQL query (for example, select count(*) from orders) that produces the same result. But it would be more complex and less performant than using ElastiCache for this purpose.
Using a Redis Set data structure makes counting uniqueness easy. A Set is a list of unique strings, called members. Each time an order is received, we add the SKU for each item in that order to the unique items set, as follows:
In addition to adding the item to the Set, we also use the EXPIRE command for housekeeping. The EXPIRE command takes the key and the number of seconds until the data should be expired from the Redis store. Here, we call EXPIRE each time an item is purchased, with an expiration time equivalent to one week.
In the dashboard, we can use SCARD to retrieve an integer count of unique items purchased.
Leaderboard
As part of our dashboard, we also want to view a leaderboard of the most purchased items all-time. Leaderboards are a common use case for Redis, built on the Sorted Set data structure. A Sorted Set is a list of non-repeating strings, referred to as members, and every member in the set is associated with a score. For our leaderboard, the score is the total number of the item (member) sold. We can add, remove, or update members of the set very quickly— time complexity of O(log n), where n is the number of items in the set.
When an order is entered for two items with the identifier 123456789, we can increment its entry in the leaderboard as follows:
We can use ZREVRANGE to retrieve the top elements. Here, we get the top 10:
Latest products purchased
As useful as an all-time leaderboard is, our business is also interested in a live feed of the products that are being sold. In this case, we use the Redis List data structure to track a running list of the last 100 items sold (note that you could achieve the same using a Sorted Set, using the Unix time stamp as the score).
In the following example, we push the item’s SKU to the head of the list that is stored at the latest products key. Before performing the push, Redis creates an empty list if one does not exist. After pushing each new item on the list, we trim its length to a total of 100 items by using LTRIM:
To retrieve the last 10 items sold from the head, we use LRANGE:
If we wanted to add pagination, for example, to our list of items, we could retrieve the next 10 items, specifying a start index of 10 and an end index of 19:
Historical sales revenue
Finally, no sales dashboard would be complete without a view of sales revenue. In this case, our business wants to view one week of historical data, tracked on an hourly basis, in the dashboard. In our approach, we track the dates for which we have data and the revenue data itself in two separate data structures.
First, we update a Sorted Set each time we push revenue data to Redis with the current date. The benefit of using a Sorted Set here is that each member is unique. Notice that we also always set the member’s score to zero. In cases of a tied score, results are returned sorted by member value. Thus, our response is sorted ascending by date. We also prune unneeded data by using the ZREMRANGEBYRANK command to keep only seven days of data.
After adding the current date to our sorted set, we increment hourly revenue in a Redis Hash. Hashes are used to store mappings between a key (the current hour) and a value (revenue). For each date, we keep a separate Hash of data, expiring it after seven days.
Retrieving sales data for an entire week is slightly more complex than our previous examples. Here, we need to first retrieve the list of dates for which we have data from a Sorted Set, iterate through each date, and retrieve the hourly revenue from the Hash. To retrieve the list of dates for the past week and revenue data for one of those days (March 11, 2018 or “20180311”), the Redis command is as follows:
Although the implementation differs slightly across languages, the following pseudocode describes the approach to collecting a week of revenue data:
For a working Node.js example, check the sample code that is provided in the GitHub repository.
Sample architecture
To demonstrate the functionality of our sales dashboard, we provide a sample architecture in the aws-elasticache-retail-dashboard repository on GitHub. For the purpose of the sample, we ingest orders via Amazon Kinesis, which delivers the order data to an AWS Lambda function. In a real-world scenario, order processing would be handled by an order processing system, perhaps in conjunction with AWS Step Functions, to orchestrate delivery to the dashboard and other systems.
The Lambda function (ProcessorFunction), written in Node.js, pushes applicable data to our ElastiCache Redis instance using an open source library (ioredis, although similar Redis client libraries exist for a wide variety of platforms). If you review the code, note that the function executes the same commands as described earlier.
To enable the real-time nature of our dashboard, our sample uses AWS Fargate, running two services: (1) a client application (built with Vue.js) that connects via web socket to (2) a backend Node.js application. The backend application uses the Redis publish/subscribe (pub/sub) feature to be notified of updates, which it then pushes to the dashboard. With this approach, the dashboard can accurately reflect the latest sales metrics as they are updated by the Lambda function.
For detailed information about deploying the sample architecture, including generation of sample data, see the GitHub repository.
Pub/Sub
Beyond the functionality described previously, Redis also provides a pub/sub capability. You can use it to drive this type of near real-time system in addition to applications that require pushed updates, such as chat. Last year, one of our colleagues described an approach to building a chat-based application using Redis.
Monitoring and performance
Although we did not delve into the details of sizing and performance here, effective monitoring is key in deploying a performant, cost-effective solution. ElastiCache integrates with Amazon CloudWatch to provide insight into the performance of the overall cluster and the instances that compose it. The sample dashboard uses a t2.medium with one replica. However, production systems can use larger instance types for added storage and better performance, and they can use additional replicas to further enhance redundancy and availability.
When you are running an ElastiCache cluster, the following metrics are useful in right-sizing the cluster and gauging performance:
- CPUUtilization: The CPU utilization of the instance that is running Redis.
- FreeableMemory: The amount of free memory that is available on the host.
- NetworkBytesOut: The number of bytes that the host has read from the network.
- NetworkBytesIn: The number of bytes that the host has written to the network.
- SwapUsage: The amount of swap that is used on the host.
In addition, the following Redis-specific metrics can be useful:
- BytesUsedForCache:The total number of bytes that Redis allocates.
- EngineCPUUtilization: Because Redis is single threaded, this is the CPU utilization of the core that the engine is running on.
- CurrConnections: The current number of connections to Redis.
A deep dive into sizing Redis clusters is beyond the scope of this post, but you can use these metrics to help size your cluster appropriately. You can then scale ElastiCache in or out to meet your needs.
Summary
We hope that you found this brief dive into using Amazon ElastiCache for use cases beyond simple caching valuable. Not only can using the fully managed Redis engine simplify the complex logic in your application, it can also enhance your application’s performance and lower costs.
Get started with ElastiCache yourself with the AWS Free Tier, which includes 750 hours every month for a cache.t2.micro node for one year.
About the Authors
 Josh Kahn is a solutions architect at Amazon Web Services. He works with the AWS customers to provide guidance and technical assistance on database projects, helping them improve the value of their solutions when using AWS.
 Mike Gillespie is a solutions architect at Amazon Web Services. He works with the AWS customers to provide guidance and technical assistance on database projects, helping them improve the value of their solutions when using AWS.