AWS Cloud Operations Blog
How Hapag-Lloyd established observability for serverless multi-account workloads
This post is co-authored by Grzegorz Kaczor from Hapag-Lloyd AG and Michael Graumann and Daniel Moser from AWS.
Introduction
Establishing observability over the state, performance, health, and security posture of applications is key to successfully operating multi-account workloads in the cloud. As the number and size of workloads increases, finding and correlating all available information spread across multiple AWS accounts and systems outside of AWS can become challenging. A key operational requirement for DevOps teams is to have a single pane of glass which provides them deep insights in an easily consumable way. This helps them reduce their Mean Time to Respond (MTTR).
With a fleet of 252 modern container ships and a total transport capacity of 1.8 million TEU, Hapag-Lloyd is one of the world’s leading liner shipping companies. TEU, or Twenty-foot Equivalent Unit, is a unit of measurement used to determine cargo capacity for container ships and ports. The company has around 14,500 employees and more than 400 offices in 137 countries. Hapag-Lloyd has a container capacity of 3.0 million TEU – including one of the largest and most modern fleets of reefer containers. A total of 123 liner services worldwide ensure fast and reliable connections between more than 600 ports on all the continents. Hapag-Lloyd is one of the leading operators in the Transatlantic, Middle East, Latin America and Intra-America trades.
The company’s Web and Mobile team is a distributed team located in Hamburg and Gdańsk, and responsible for the customer channel’s web and mobile products in the company.
In this blog, we will share how Hapag-Lloyd’s Web and Mobile team has met operational requirements for their serverless cloud environments, and highlight the importance of implementing a centralized logging and monitoring solution. This becomes more important the more accounts and applications are involved.
In this post, we show you how we collect events, enrich, transform, and store them on AWS, and create meaningful alarms and dashboards. We will also describe how automation was implemented to allow teams an easy onboarding. We focus on AWS Lambda and Amazon API Gateway as data sources, however, the same mechanism can be applied to other data sources.
Background/Requirements
Because AWS accounts provide a natural isolation of resources, using multiple accounts is a best practice. The Organizing Your AWS Environment Using Multiple Accounts Whitepaper describes how multiple accounts can be used to group workloads based on business purpose and ownership, separate different environments such as development, test, and production, apply distinct security controls per environment, limit scope of impact from adverse events, or manage cost. A central monitoring and logging solution should therefore support such setups.
- Centralized log storage: A requirement for our central monitoring and logging solution is to automate configuration of log groups so that all logs are automatically streamed to the central repository. The solution also has to transform and/or enrich the logs so that all logs for an application can easily be found.
- Automated alarm configuration: Our solution should automate the configuration of alarms, so that whenever a new endpoint is created, updated, or deleted, the respective alarms are updated as well. Because our Lambda functions in scope are integrated with API Gateway, we focus our alarms on the latter.
- Reduced Mean Time To Respond: As the monitoring solution covers many applications owned by different teams, it is also key that in case of an alarm the right people get notified. They in turn need to be able to quickly get from the alarm to the root cause of the problem. Our solution needs to send notifications to the right team, enriched with context, and provide a way to directly dive deeper into the relevant logs.
Solution
A central logging solution for us is a type of logging solution that enables organizations to collect logs from multiple data sources, to consolidate the data, and to present it on a central, accessible and easy-to-use dashboard. Although it can collect data from many data sources, we will focus here on Lambda and API Gateway. Additional data sources can be added as well. Having a centralized monitoring strategy enables us to centrally configure alarms and to decouple applications from their monitoring configuration.
Let’s think about the users of our observability solution. The consumer of this could be an application team. This team wants to
- (a) gain valuable insights into their applications state quickly
- (b) have minimal effort in setting up the monitoring solution
- (c) be notified about critical alarms quickly in the tool they use for collaboration, in this case Microsoft Teams
Let’s park (a) for a moment. All the consumers have to do for (b) in order to consume the monitoring solution is to tag their resources and use a common agreed log format. The rest is automated and transparent to the team. Critical alarms will be sent out as notifications via Microsoft Teams (c). Not only that, but the notification contains links pointing directly to the specific logs as shown in the following screenshot and are enriched with valuable context.
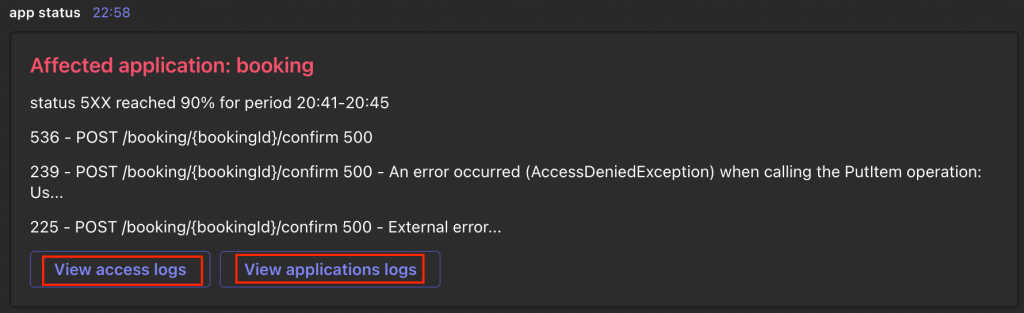
Figure 1: An example alert which application teams receive in their Microsoft Teams channel
The architecture of the solution is broken down into 14 steps, which is shown in Figure 2. We will walk through the different parts in the next sections.
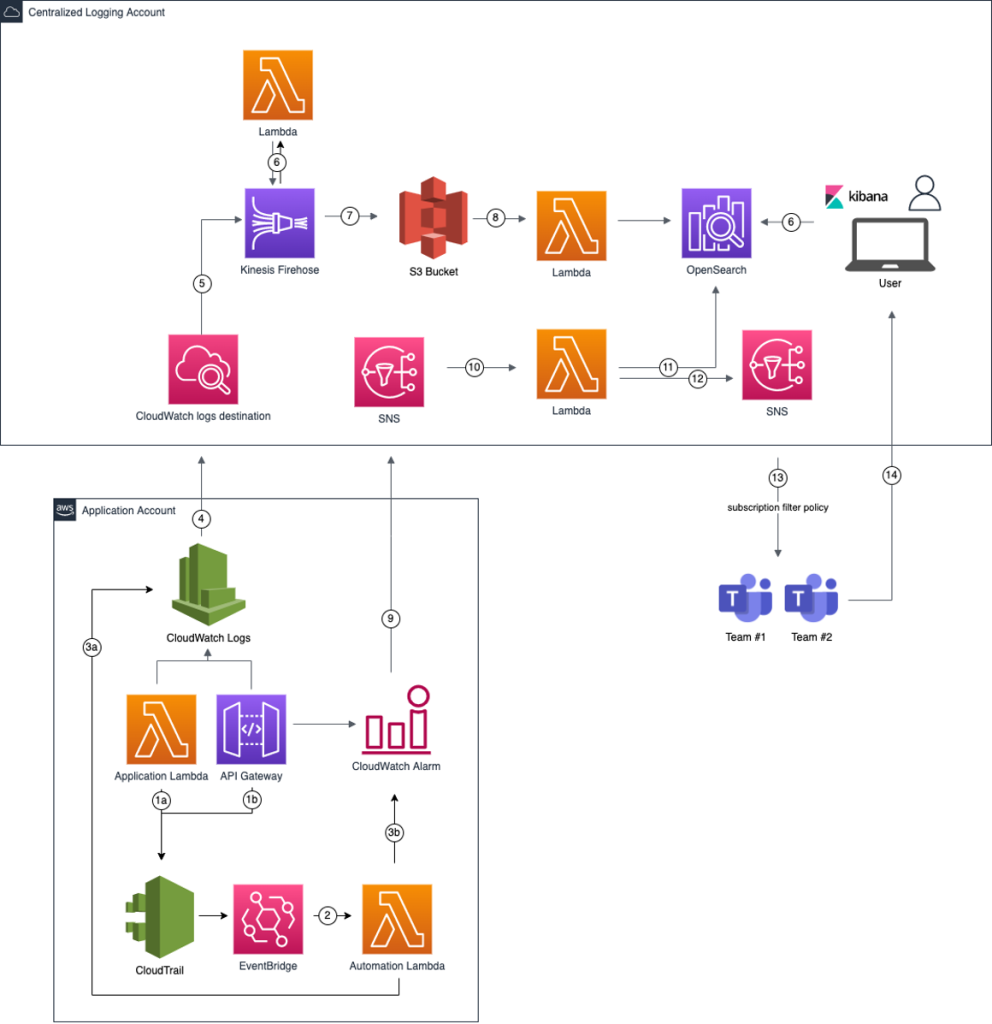
Figure 2: Workflow steps for out central logging and monitoring solution
Collecting events
The first thing an observability solution needs is data. We want to make central data collection as friction-less for our developers as possible. We automated configuration of log-forwarding and a base definition of alarms. In this post, we focus on Lambda functions and API Gateways, but the same mechanism can be used for other data sources. In the previous architecture diagram, steps 1 to 5 enable the automated onboarding of environments and data collection.
To automatically configure log-forwarding on the log groups and create alarms on metrics, we want to get notified whenever a team creates or updates resources. We use AWS CloudTrail and Amazon EventBridge to react to changes in API Gateway and Lambda. For API Gateway, we listen for the UpdateStage AWS API call which is made when an API Gateway Stage is changed. For Lambda, we listen for the CreateLogGroup API call the Lambda service makes when a Lambda function is invoked for the first time. Listening for the CreateFunction API call would not lead to the desired result because the log group of the Lambda function is only created on the first invoke and not available yet when our automation would start.
Whenever one of those API calls is made, an EventBridge rule is invoked which triggers a Lambda function we call Automation Lambda here.
The Automation Lambda has two tasks. First, it enables that the log events from the application Lambda function or API Gateway are delivered to our central S3 bucket. This is achieved by adding a subscription filter to the respective CloudWatch log group of the application Lambda or API Gateway. In this filter, we define a pattern to match the log events we are interested in. Finally the subscription filter needs a target. Because we are crossing account boundaries, the logs will be first sent to an Amazon CloudWatch logs destination which delivers them to an Amazon Kinesis Data Firehose delivery stream in the Centralized Logging Account and subsequently to the S3 bucket.
Second, the Automation Lambda creates CloudWatch alarms for critical errors that eventually end up as notification in the applications team’s Microsoft Teams channel. For example, one alarm could be API Gateway returning a specific percentage of HTTP 4xx errors over a specific time window.
Because we want to have an easy way to find the root cause of Lambda errors, we need to make sure that every failed execution produces messages in a common agreed log format. This is something that has to be configured by the application teams using our observability solution. We provide them with a library that allows application teams to log according to our convention.
Transforming the logs
With the automation in place, we now have a mechanism to configure and centrally collect logs from Lambda functions and API Gateways. Even though we have a convention on the log format for error messages, regular logs from different sources come in different forms and shapes, in parts in a semi-structured form. By applying transformations to these logs, we make sure that they are easy to consume later on by services like Amazon Athena or Amazon OpenSearch Service. This is accomplished by invoking a transformation Lambda function (step 6 in the previous diagram) on the Kinesis Data Firehose delivery stream. The following screenshot (Figure 3) and snippet show an example of a log message and how it was transformed into JSON.
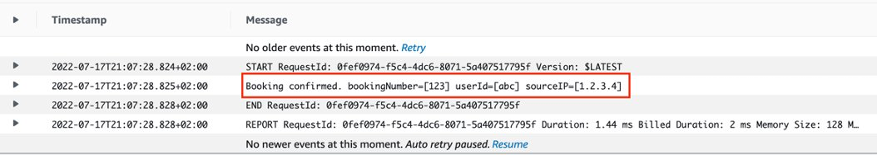
Figure 3: Semi-structured log messages before transformation to JSON.
S3 serves as our single source of truth and cost-efficient long-term storage for all of our logs. S3 lifecycle rules allow us to put infrequently used data into lower storage tiers and thus help control cost.
To enable efficient analytics on larger datasets, and with the amount of logs that are generated, we found it important to think about storing them in such a way that they are consumable in a performant manner. Usually when looking for application or business logs, the user has a specific application and environment in mind that they want to investigate logs for. We take advantage of this knowledge by partitioning the logs accordingly by application and environment. This will lead to less data scanned, better query performance, and reduced cost when querying the data with tools like Amazon Athena.
Partitioning our data by application and environment is achieved through the dynamic partitioning functionality of Kinesis Data Firehose, which partitions data based on attributes within the data that we can define.
Feeding OpenSearch Service
Amazon OpenSearch Service provides rich indexing and full-text search capabilities, which help us to enrich alarms and surface relevant logs quickly. Additionally, we can provide useful and easy to consume dashboards for our users.
To ingest data into our OpenSearch Service cluster, we bring two more Lambda functions into action (step 8 in the previous diagram). They get triggered by S3 PutObject events on our S3 bucket, read the objects and index them to our OpenSearch Service cluster. Instead of delivering our logs from Kinesis Data Firehose to S3 first, and then ingesting it into OpenSearch Service, we could use Kinesis Data Firehose to directly deliver the data to our OpenSearch Service cluster. However, as mentioned in the previous section, S3 serves as the single source of truth and long-term storage. Secondly, dynamic partitioning is only available with S3 as a destination for Kinesis Data Firehose. Partitioning our data gives us more control on how logs are ingested and indexed into OpenSearch Service.
We create one function for the Lambda function logs, and one for API Gateway logs. Although OpenSearch Service can detect any field in a document, it is sometimes better to explicitly define types for at least some of the fields. For the application logs from the Lambda functions, we index on product, event name, source, account id and additional meta data. We use one index pattern pointing to all lambda logs across all products. Likewise for API Gateway logs, we create one central index pattern and leverage dynamic templates. They allow for defining custom mappings that can be applied to dynamically added fields. The following snippet shows a dynamic template we use.
Creating meaningful dashboards
Users can use the OpenSearch Service Dashboard to search, analyze and visualize data. As an application owner, the first thing we want to see is the overall health state of the workload. Figure 4 shows an dashboard.
One aspect of the health is a success ratio of API calls that we calculate as follows:
- (number of responses with an HTTP status between 200-399) / (total number of requests received)
An overview of the success ratio per component (micro service) can be seen in the average success section at the top of the dashboard. By showing context relevant metrics close to another, dashboard users can easily correlate important data points. That helps them narrow down the component that caused an anomaly, retrieve the respective error types and thus decreases the MTTR. For example, in the dashboard the error rate for the green resource path has a spike (I). To find out which kind of error the component faces we focus on the Error message over time visualization (II). The main error type here is a HTTP 401 Unauthorized. What is the impact of these errors for the user of this application? Besides not getting back a successful response they additionally face an increase of latency, which is visible in the Average latency over time visualization (III). With that information, development teams can quickly narrow down issues and start working on the root cause.
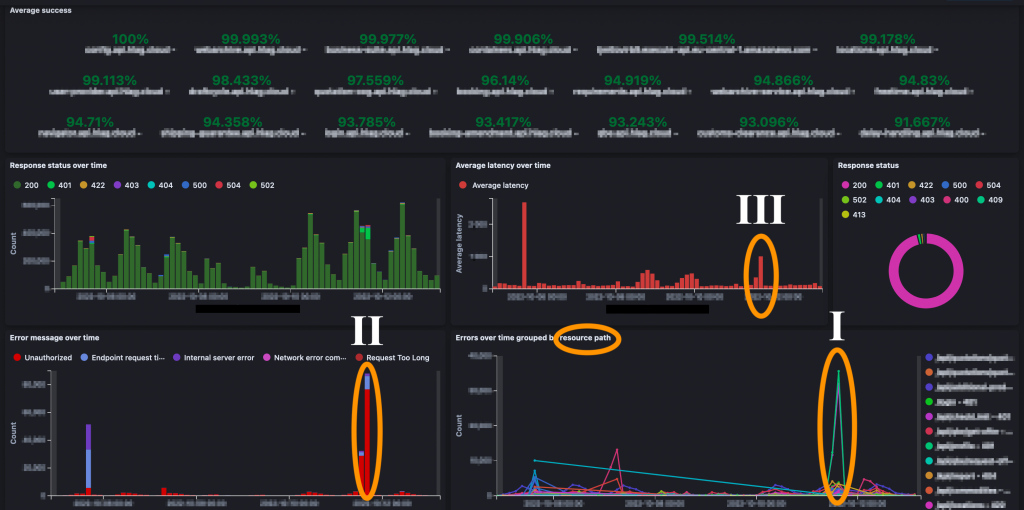
Figure 4: Operational metrics and error rates dashboard
To get a deeper understanding of why a component fails, application owners want to evaluate the respective logs. As discussed before, the application logs have been transformed and loaded into OpenSearch Service. For example, in the screenshot shown in Figure 5, it is displayed that a Lambda function failed to execute. Thanks to our commonly agreed log format we can quickly spot the issue. In this case, the function is not allowed to put an item into Amazon DynamoDB.
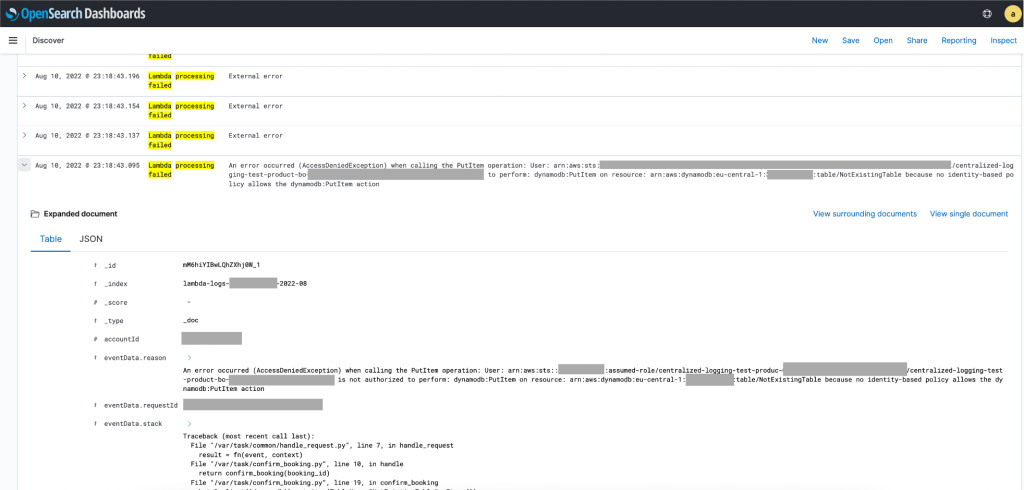
Figure 5: OpenSearch Service Dashboard with relevant log messages
With this information, the application team can fix the respective AWS Identity and Access Management (IAM) policy. If the fix is successful, the error messages over time will decrease for this component.
Having operational metrics in place is a great start, but we need business metrics as well. Hapag-Lloyd customers can use the booking application to book containers for a specific route between ports for selected time frames. Thus the business is interested in the number of users, offers that were opened and finally successful submissions over the day. Additional insights are provided via a business dashboard (exemplary data, Figure 6), such as frequent port pairs, TEU (Twenty-foot Equivalent Unit) per submission and popular hours for customers to request bookings. The dashboard is also used to evaluate how new features impact the overall workflow by monitoring the ratio between started bookings and completed ones.
Different users can have different dashboards with context relevant metrics. Combining business and operational metrics enables Hapag-Lloyd to understand the health of the overall workload addressing the desired business outcome.
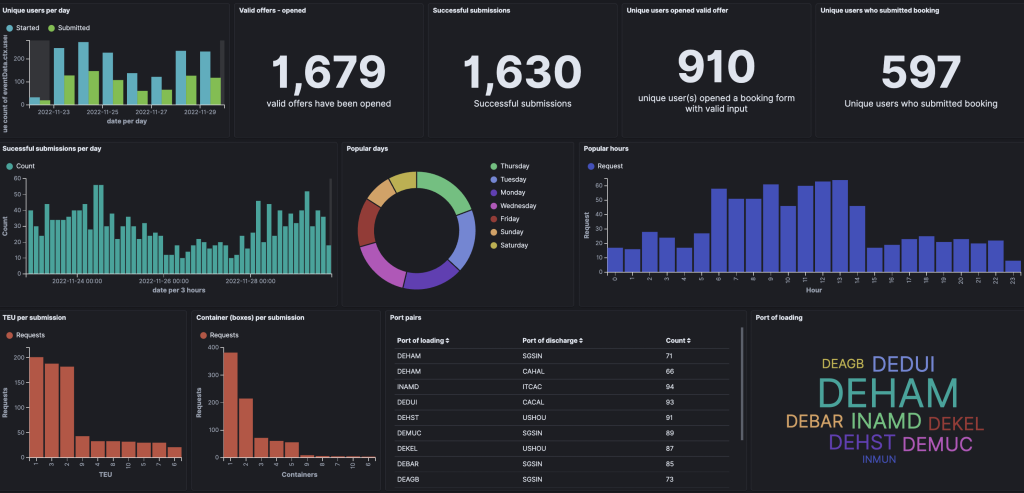
Figure 6: Business metrics dashboard showing exemplary data
Creating enriched alarms
Although users should regularly have a look at the dashboards, there is the need to inform them as quickly as possible in case of critical issues. We cannot rely on teams checking the dashboards on time. This challenge is addressed by creating alarms that get sent out to the application owners in such cases.
There is as fine line when dealing with alarms. A well-known phenomenon called alert fatigue describes teams becoming desensitized to critical alerts when they face too many of them too often. Thus, we need a mechanism to only send out notifications in critical situations, that provide relevant contextual information and are easy to consume.
CloudWatch provides composite alarms to reduce alarm noise. By leveraging this feature, we aggregate multiple smaller alarms, reporting a global state of the application and avoid notifying the teams multiple times for the likely same root cause. A composite alarm will be triggered only one time – namely, when the very first child endpoint alarm goes into the alarm state. Alarms are sent to Amazon Simple Notification Service (Amazon SNS, step 9 in the solution diagram) and processed by a Lambda function (step 10), which creates an enriched message to be sent out to the application team. We use the alarm description to pass metadata such as the product name to the Lambda function as outlined in the following snippet.
The Lambda function then queries our OpenSearch Service cluster for the logs related to the alarm (step 11).
Finally, the Lambda function sends the notification out via SNS. The Microsoft Teams WebHook receives it and the application team sees the notification in its channel (steps 12 and 13). The notification contains concise information on the status of the application and allows developers to quickly navigate to OpenSearch Service for detailed logs of that application.
Conclusion and outlook
In this blog post, we outlined the importance for an observability solution to provide relevant, contextualized and easy-to-consume information about the state of workloads. We showed you how we collect events, transform, and store them on AWS. We looked into creating alarms and enriching them with relevant information for the receiver.
Application teams can take it from there and build their own automation for alarms that they can auto-remediate.