AWS Partner Network (APN) Blog
How TalaTek Uses Amazon CloudWatch for Security Information and Event Management
By Baan Alsinawi, President at TalaTek LLC
 |
TalaTek LLC is an Amazon Web Services (AWS) Partner and full-service risk management firm that provides expert services in risk management, cybersecurity, and compliance.
TalaTek delivers IT and risk management solutions based on NIST and ISO27001. We specialize in compliance solutions and implementing NIST standards to meet FISMA, HIPAA, and other privacy standards and regulations for customers.
Amazon CloudWatch is a monitoring service that collects and tracks data via logs, metrics, and events displayed in automated dashboards.
TalaTek uses Amazon CloudWatch as an alternative to traditional Security Information and Event Management (SIEM) solutions with the same functionality. CloudWatch gives TalaTek system-wide visibility, allowing us to monitor our AWS-based software-as-a-service (SaaS) solution, the TalaTek Intelligent Governance and Risk Integrated Solution (TiGRIS).
CloudWatch helps TalaTek keep TiGRIS running efficiently while allowing us to meet all of our Federal Risk and Authorization Management Program (FedRAMP) logging requirements.
When potentially threatening activity is detected, we have configured CloudWatch to automatically generate alerts that are delivered to incident response personnel and warns of possible security issues. We’re able to maximize the benefits of using CloudWatch while providing vital services necessary to meet stringent FedRAMP requirements for TiGRIS.
In this post, I will detail how TalaTek uses CloudWatch to aggregate data across multiple sources and correlate events across multiple log streams and groups. I’ll also explore how we configure CloudWatch Alarms and optimize CloudWatch’s automatic pre-built dashboards, and the way we use CloudWatch to automate the gathering of compliance data.
Finally, I’ll discuss our use of CloudWatch’s audit records storage and forensic analysis capabilities, which we use to meet FedRAMP compliance requirements.
Data Aggregation Across Multiple Sources
TalaTek’s TiGRIS utilizes Amazon CloudWatch to aggregate data from many sources, including Open Source HIDS Security (OSSEC), AWS CloudTrail, application logs, and server logs by using the CloudWatch agent that runs on the host platform.
Amazon Virtual Private Cloud (VPC) flow logs are sent to a CloudWatch log stream and show activity at the network level, which is necessary to meet FedRAMP boundary monitoring and information flow requirements.
Amazon Relational Database Service (Amazon RDS) logs are also sent to CloudWatch, giving TalaTek the capability to monitor the full application stack in one consolidated dashboard.
Event Correlation Across Log Streams and Groups
Amazon CloudWatch Logs Insights enable us to interactively search and analyze log data in CloudWatch Logs. TalaTek uses it to correlate events across multiple log streams and groups.
For instance, if an Internet Protocol (IP) address causes an alarm on one system, we can use Amazon CloudWatch Logs Insights to search for that IP address across multiple log streams and log groups.
With one query, we can search VPC flow logs for related network activity, server logs for host activity, and application logs for application activity to determine the scope of the threat and impact from that one IP address.
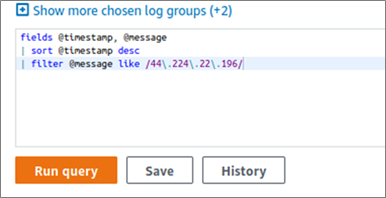
Figure 1 – Running a query to search VPN flow logs, server logs, and application logs.
In addition, we can run a similar search on a specific username to track that user’s activity across the system. This provides TalaTek the capability to address incident response according to our stated policies in compliance with FedRAMP requirements, and to manage risk effectively.
Alerts Management
TalaTek configures Amazon CloudWatch Alarms to generate alerts, enabling our team to monitor critical metrics and send notifications to an Amazon Simple Notification Service (SNS) topic. This allows us to easily send alarms to our designated email address and ticketing system, as well as send text alarms directly to personnel phone numbers and HTTPS endpoints.
For example, when using OSSEC, TalaTek has configured CloudWatch to set an alarm that sends an email to the system administrator when the monitored metric reaches a particular threshold. We did this by configuring OSSEC to produce alerts in JSON format, which is easily ingested and searched by Amazon CloudWatch.
We then configure the Amazon CloudWatch agent to forward the OSSEC alerts to a CloudWatch log group and stream.
In addition, we create a metric filter to check the rule level.
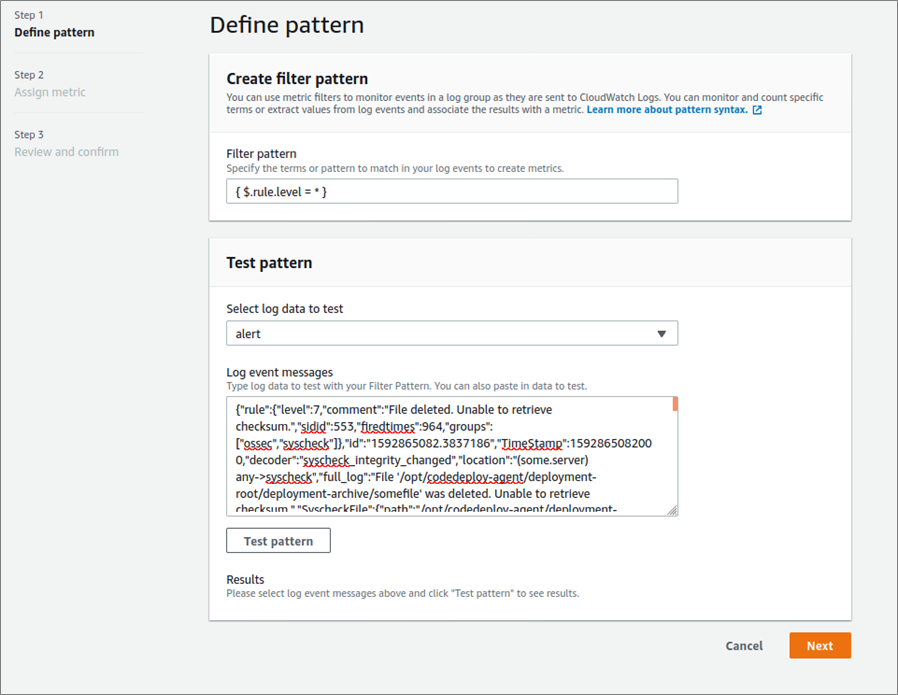
Figure 2 – Creating a metric filter to check the rule level.
We then assign the ‘ossec-alert-rule-level’ metric to the filter.
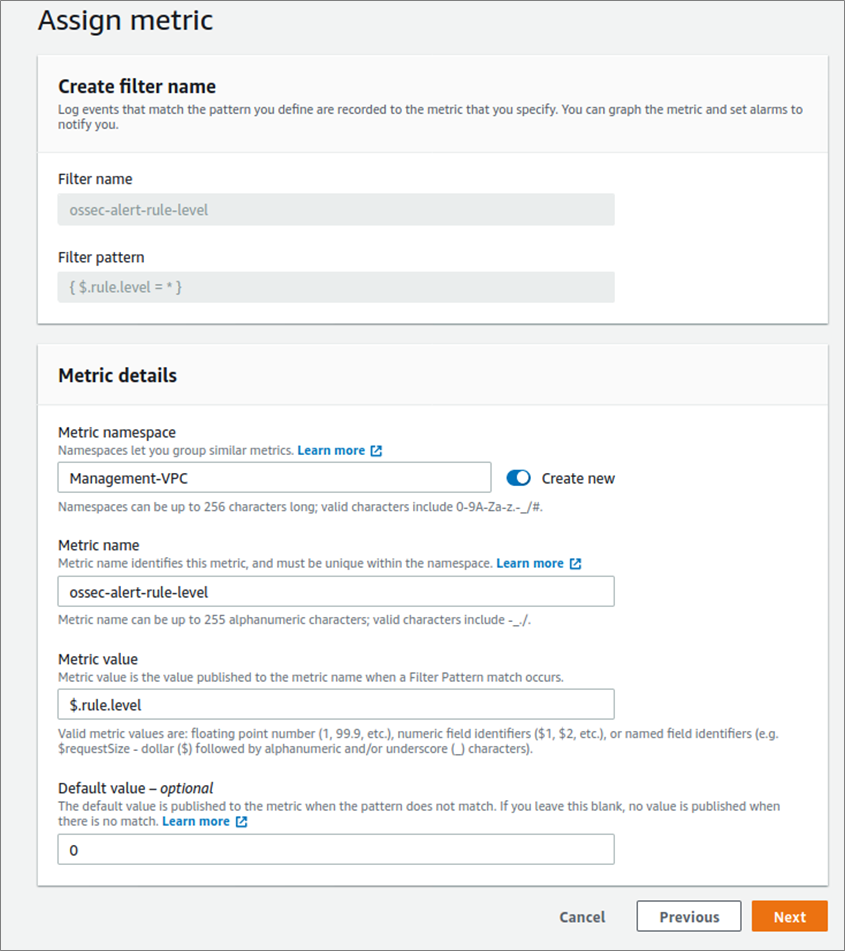
Figure 3 – Assigning a metric.
After completing those steps, we create an alarm based on the desired OSSEC alarm level. The example in Figure 4 below uses level 6, which correlates to “low-relevance attacks.”
Amazon CloudWatch allows us to select higher-level alarms as needed, such as level 12’s “high-importance event,” or lower-level alarms, such as level 4’s “system low priority errors,” which are based on our organization’s risk tolerance.
This ability to assign priority levels allows TalaTek to create alarms based on the criticality. For instance, level 4 alarms are entered into our ticketing system, and a level 13 alarm sends a direct text message to relevant system administrators and incident response personnel.
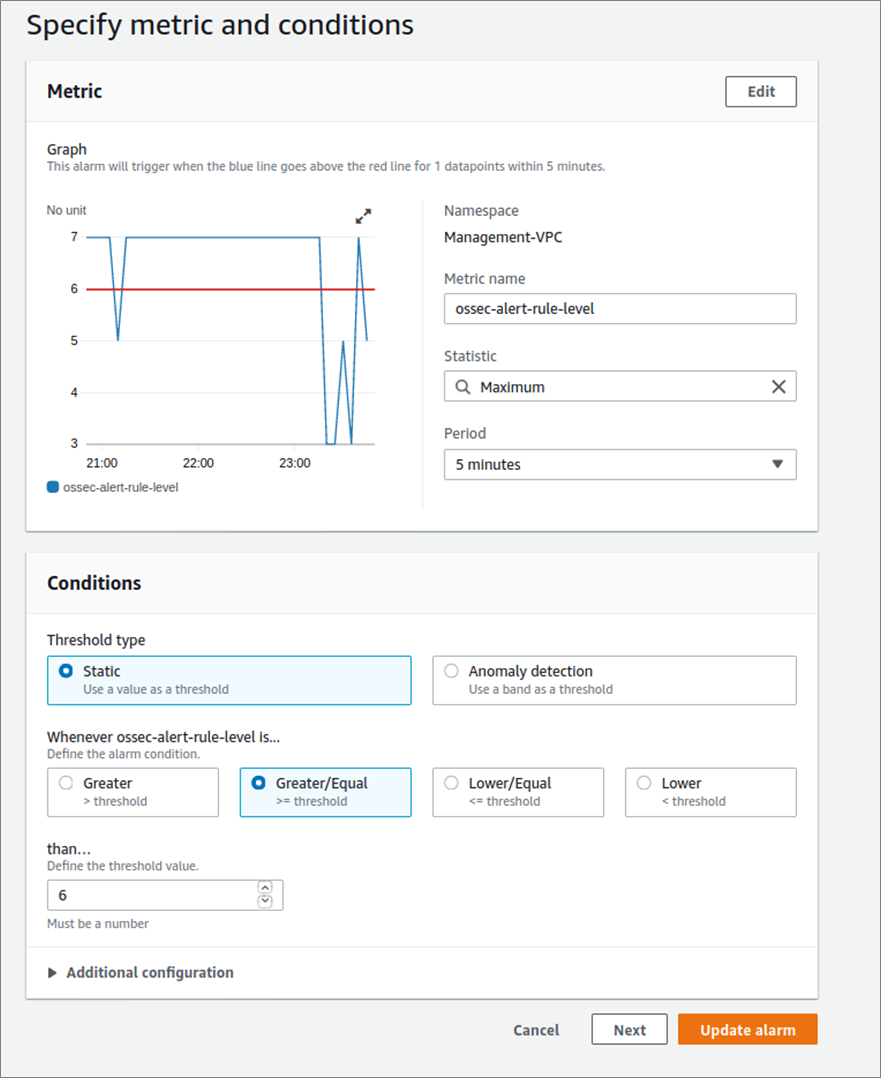
Figure 4 – Creating an alarm based on OSSEC alarm level 6.
Pre-Built Dashboards Based on AWS Best Practices
For TalaTek’s TiGRIS implementation, we utilize the Amazon CloudWatch automatic pre-built dashboards, which are configured using AWS best practices. This allows us to configure risk-based dashboards based on event metrics with widgets that include line graphs, stacked areas, numbers, text, and query results.
We find the CloudWatch dashboards effective in monitoring our enterprise’s security. For example, we use the line graphs for tracking trends such as accepted and rejected network traffic, number of successful/failed logins, users created, amount of logs, and OSSEC alerts. We also find the text widget is useful for adding dashboard descriptions and important information like server IP addresses.
We have also added frequently accessed Amazon CloudWatch Logs Insights queries in widgets to provide quick results. When we receive a text message from our OSSEC alarm (as described above), we’ve created a query results widget to display these alarms on our dashboard. Then, our incident response team can view the OSSEC alert in more detail to see the full log generating the alert, the source IP (which we look up on our text widget of IP addresses), and the user.
If we want to monitor inbound network traffic from the internet to our private IP addresses and show this in a line graph dashboard, all we need to do is set up filters and metrics for VPC flow logs for number of bytes rejected and accepted inbound.
Filter for accepted inbound:
[version, account, eni, source!=10.*, destination, srcport, destport, protocol, packets, bytes, windowstart, windowend, action="ACCEPT", flowlogstatus]
Filter for rejected inbound:
[version, account, eni, source!=10.*, destination, srcport, destport, protocol, packets, bytes, windowstart, windowend, action="REJECT", flowlogstatus]
From the desired dashboard, we then add the widget, select the line, configure, and select the created metrics.
Similarly, we can create line graph dashboards to monitor inbound and outbound traffic, as shown in Figure 5. We always expect rejected inbound traffic from the internet, but rejected internal traffic could indicate an internal vulnerability scan or port scan, or a minor configuration issue.
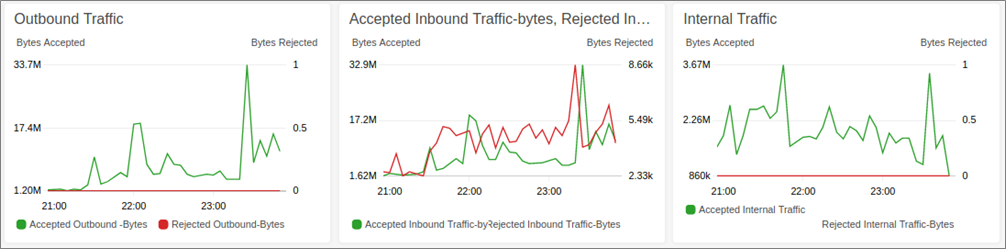
Figure 5 – Creating line graph dashboards to monitor inbound and outbound traffic.
Automate Collecting Compliance Data
TalaTek uses Amazon CloudWatch to automate the gathering of compliance data to assist in the security, governance, and auditing process for TiGRIS, in accordance with our FedRAMP accreditation.
For instance, when we wish to collect a list of open ports on the server, we use OSSEC to run the list of open ports and create a low-level CloudWatch alert with the collected information. We achieve this by adding the OSSEC command to the agent.conf file.
Then, we add a rule to our local_rules.xml (file for adding custom rules) to our OSSEC server configuration.
We then use CloudWatch to search and find the output of our alert by running the query.
To view the results, we can either view them in CloudWatch classic or export them to a CSV results file, and view them in Excel or a similar program by selecting Actions and then Download Query Results.
Audit Record Retention
Amazon CloudWatch log groups can be set to be retained from Never Expire to periods as short as one day. TalaTek uses the more common periods of 90 days and one year. We also export logs to Amazon Simple Storage Service (Amazon S3) for long-term storage and Amazon S3 Glacier for extremely low-cost long-term back up.
All of these measures enable us to meet the FedRAMP continuous monitoring requirements.
Forensic Analysis
Amazon CloudWatch supports the ability to search across logs in different log groups on different time periods based on specific criteria.
For instance, when TalaTek receives an OSSEC alert, the incident response team reviews the CloudWatch SIEM dashboard and determines the alarm is for “maximum authentication attempts exceeded.” From there, the OSSEC alert provides the username and other relevant information. Our team contacts the user to ensure this was a result of user error and not a malicious attempt.
In another example, we receive an OSSEC alarm for “multiple invalid Uniform Resource Identifier (URI) requests from the same source.” From there, our team is able to quickly review the CloudWatch dashboard and determine the source IP.
We use Amazon CloudWatch Logs Insights to query the application logs and determine whether or not the IP address corresponds to any user activity. This helps us to determine if the traffic is malicious.
Conclusion
TalaTek LLC uses Amazon CloudWatch as a vital part of managing risk and meeting all of our FedRAMP Audit and Logging requirements for the TiGRIS SaaS solution.
We utilize multiple CloudWatch features, such as events correlation, alerts management, and data aggregation, to manage and aggregate our security and compliance-required logging and alerting activities more efficiently and securely than other SIEM options available in the security marketplace.
Amazon CloudWatch gives us the necessary visibility into our system via powerful dashboards, and provides the ability to manage a variety of log sources for an enterprise view of our entire organization.
As a member of the Authority to Operate (ATO) on AWS program, TalaTek can support your organization’s implementation needs when you’re ready to improve audit and logging capabilities in response to regulatory requirements or simply to manage your risk effectively.
The content and opinions in this blog are those of the third-party author and AWS is not responsible for the content or accuracy of this post.
.

.
TalaTek LLC – AWS Partner Spotlight
TalaTek LLC is an AWS ISV Partner and full-service risk management firm that provides expert services in risk management, cybersecurity, and compliance.
Contact TalaTek LLC | Partner Overview
*Already worked with TalaTek LLC? Rate the Partner
*To review an AWS Partner, you must be a customer that has worked with them directly on a project.