AWS Contact Center
Analyze Amazon Connect Contact Trace Record with Amazon Athena and Amazon QuickSight–Part 1
Join us for AWS Contact Center Day, a free virtual event where you’ll learn about the future of customer service, how machine learning can optimize customer and agent experiences—and more. Register now »
Introduction
Many organizations want the capability to perform analytics on the contact center data for an extended period and build custom reports for different business needs. Since Amazon Connect is an open platform and offers APIs and mechanisms to integrate with third party reporting application, organizations can stream Contact Trace Record (CTR) to Amazon Kinesis for extended retention and advanced analysis. Contact center platforms offering limited APIs or integration capability have difficulty tapping into Contact Center data and perform advance analytics. Amazon Connect captures contacts data in CTR which contains transactional metrics, such as hold time, wait time, agent interaction time, etc. in JavaScript Object Notation (JSON) format. The basis for most historical and real-time metrics in Amazon Connect is the data in the CTR, and the metrics within Amazon Connect are available for the past 24 months.
In this blog, you will learn how to stream CTR data out of Amazon Connect and develop a data analytics solution leveraging Amazon QuickSight.
Overview
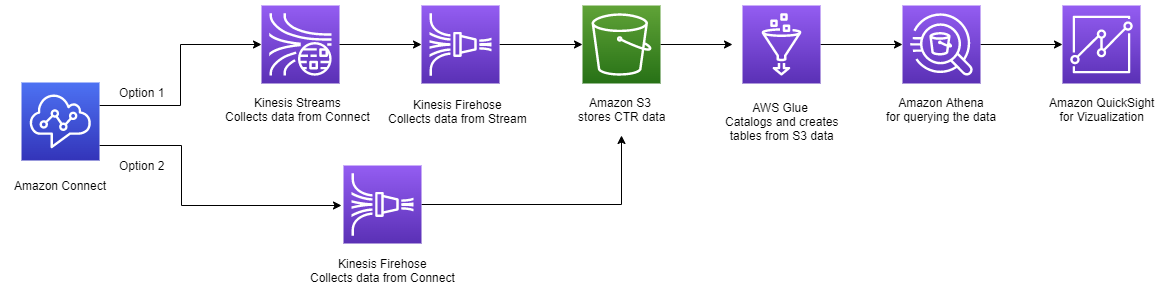
Fig 1 – High level architecture diagram
In this architecture, you will use Amazon Kinesis Streams to capture Amazon Connect CTRs as raw data in an Amazon Simple Storage Service (S3) bucket. There are two choices for streams. First, an Amazon Kinesis Data Firehose, that Amazon Connect can be configured to stream the CTR data to S3. The second option is to use an Amazon Kinesis Data Stream first to stream the Amazon connect data then transfer the data into S3 by using an Amazon Kinesis Data Firehose. Using a data stream in the middle provides the advantage of using CTR records in other processes/solutions at the same time. For example, this data stream can be used to transfer the CTR records to Amazon DynamoDB database.
You create an AWS Glue database definition and an AWS Glue table definition with the schema of a CTR record. Amazon Kinesis Data Firehose uses this table definition to compress the files in to parquet file format. This compression also reduces the storage and query costs.
To optimize query performance in both Amazon Athena and Amazon QuickSight you set up Partition Projection. This feature automatically creates partitions for each day to improve date-based query performance.
Prerequisites
To follow along with the solution presented in this blog post, you must understand the following AWS services and features:
- Amazon Connect
- AWS Lambda
- Amazon Simple Notification Service (SNS)
- Amazon Simple Storage Service (S3)
- AWS CloudFormation
- Amazon Kinesis
- Amazon Athena
- AWS Glue
- Amazon QuickSight
- AWS Identity and Access Management (IAM)
- You also need an active AWS account with permission to create and modify AWS IAM roles.
Walkthrough
You can get started with our sample AWS CloudFormation template. This template creates the Amazon Kinesis Data Stream, S3 bucket, and AWS Glue crawler. To deploy the template, follow the following steps
-
- Sign in to the AWS Management Console in the US East (N. Virginia) region.
- Download CloudFormation template from S3 location into your local machine.
- In your preferred region, create a CloudFormation Stack using the template file downloaded in step 2
- Enter a unique stack name (e.g. ctrAthenaQuickSight).

- Enter the details in the CloudFormation template, per the instructions mentioned under each header and click Next
- Select ‘I acknowledge that AWS CloudFormation might create IAM resources’ check the box at the last step, and then click ‘Create stack’.
- As mentioned in the overview section, the following are the two options to stream CTR data to S3. Please select the appropriate option per your use case. For this blog, either of the following option works. Navigate to Amazon Connect to enable data streaming.
- Option 1: Stream CTR data through Amazon Kinesis Stream
 Option 2: Stream CTR data through Amazon Kinesis Firehose
- Follow below steps to onboard existing CTR to this solution (skip this step if you do not have existing CTRs and only want analytics for future CTRs i.e. after deploying this solution)
- Create a folder with name “Old-Ctr-Data” in the S3 bucket (same as the project name)
- At the bucket root, click properties tab on the top to configure Amazon EventBridge
- Under the Amazon EventBridge section, click Edit and turn on EventBridge.
- Copy the old CTR files in the “Old-Ctr-Data” folder created in step 8.a.
Validation
Now it is time to generate data by making or receiving calls using Amazon Connect. You can go to Amazon Connect Contact Control Panel (CCP) to make or receive calls using a software phone or desktop phone. Within a few minutes, you should see the CTR data in “.parquet” file.
- Log into AWS Glue and Validate the “ctrvisualization” database created. The database name will be the project name you specified while running the CloudFormation stack.

- To query the data with Amazon Athena, we you can select the ‘connect_ctr’ table, and for Action choose ‘View data.’

- Set up the S3 query result location in Athena. Click on Settings, then Manage and associate a new S3 bucket.

- Athena shows the result for the query that is executed.

Visualize in Amazon QuickSight
To automate Amazon QuickSight dashboard creation for CTR, and to deploy available dashboards please follow “Automating Amazon QuickSight dashboard creation for analyzing Amazon Connect data” blog. To create a custom dashboard manually, follow below steps.
When you query the data using Athena, you can visualize it using Amazon QuickSight. Before connecting Amazon QuickSight to Athena, you must make sure to grant Amazon QuickSight access to Athena and the associated S3 bucket in the account. For more information on doing this, see ‘Managing Amazon QuickSight Permissions.’ After granting the requisite permissions, you can create a new data set in Amazon QuickSight based on the Athena table that was created.
Next you can create a new analysis in Amazon QuickSight.
- Navigate to Amazon QuickSight and select ‘Analyses’.
- Click on “New Dataset, then click on “Athena” and give the data source a name.
 Choose the name of the database and table, then click ‘Select’ (Make sure the QuickSight instance is in the same region where you ran the CloudFormation template)
- Lastly, you will click ‘Visualize’ to complete the dataset creation.

- In the next screen you should see the CTR.
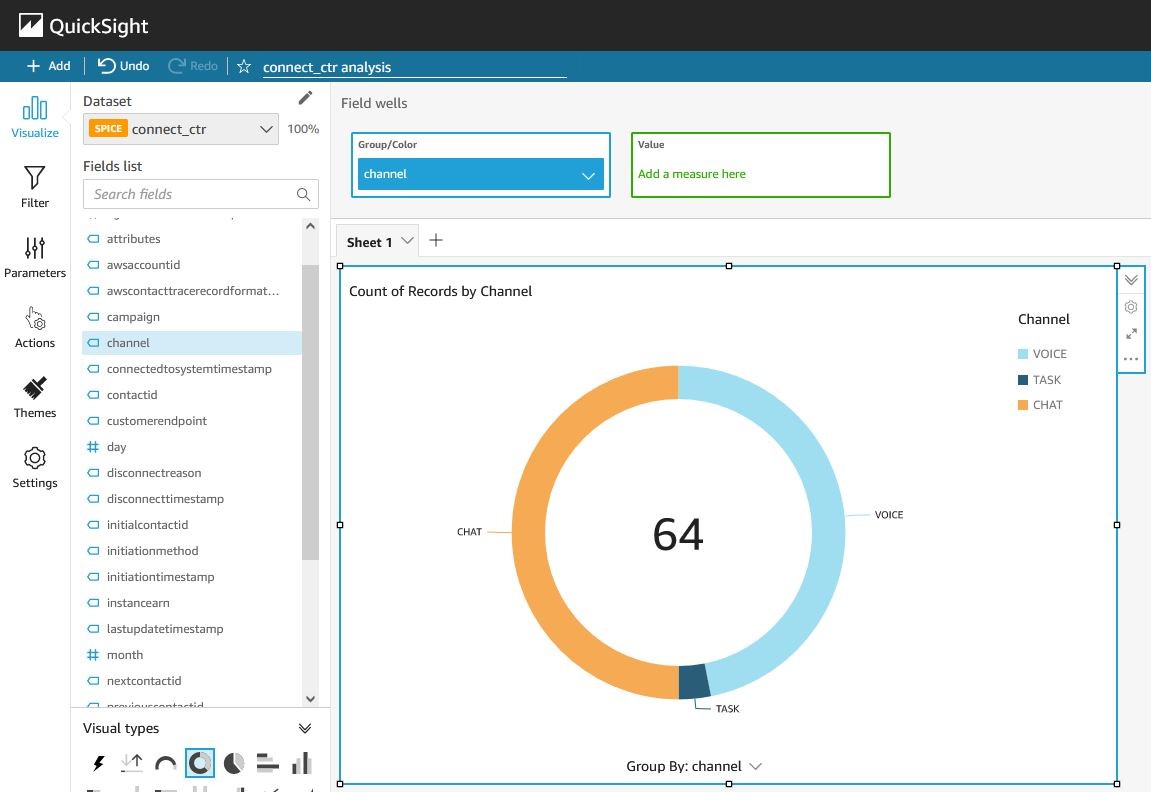
- The screenshot below shows the breakdown of call initiation methods.

-
- Below screenshot shows contact initiation across different channels.
After following the steps above, you can use Amazon QuickSight to add different columns from the call records and perform visualizations. You can also create views within Amazon Athena to build enhanced visualizations. If interested in exploring more, please review this blog post. Last, you can also build dashboards that continuously monitor your Amazon Connect instance and share those dashboards with others in your organization.
Cleanup
In order to delete the resources created by the stack:
- Delete the CloudFormation template
- Empty and delete the S3 bucket created while executing the CloudFormation template
- Delete the Glue database created while executing the CloudFormation template.
Conclusion
In this post, you have learned how to use services like AWS Lambda, AWS Glue, and Amazon Athena to process Amazon Connect call records. We have also demonstrated how CTR data can be streamed via Kinesis Streams and queried by Amazon Athena leveraging AWS Glue. Last, we reviewed how to use Amazon QuickSight to perform visualizations. To build further analysis, by creating views within Amazon Athena, check this blog post for more details. To visualize your data in Tableau and Power BI, follow Building AWS data lake visualizations with Amazon Athena and Tableau and Using the Amazon Athena Power BI connector blog, respectively.
Note: You can also stream the data to other reporting solutions, such as Elastic search. If you’re interested in learning more about streaming to Elastic search, please read this blog.
For more analytics capabilities on Amazon Connect data sources, refer the following blogs in the Amazon Connect reporting blog series:
- Analyze Amazon Connect Contact Trace Record (CTR)
- Analyze Amazon Connect Contact Lens
- Analyze Amazon Connect Chat sentiments
- Analyze Amazon Connect Chatbot performance
- Analyze Amazon Connect Agent Event Stream (AES)
- Automating Amazon QuickSight dashboard creation for analyzing Amazon Connect data
- Analyze data for Amazon Connect Outbound Campaigns (Contact event Streams)
- Create Custom Reports for Amazon Connect Cases
Author bio
 |
Mehmet Demir is a Senior Solutions Architect at Amazon Web Services (AWS) based in Toronto, Canada. He helps customers in building well-architected solutions that support business innovation |
 |
Ankur Taunk is a Senior Specialist Solutions Architect at AWS. He helps customer achieve their desired business outcomes in the Contact Center space leveraging Amazon Connect. |
 |
Adam Richter is a Senior Technical Account manager at Amazon Web Services (AWS). He works with enterprise customers to provide a concierge-like service where the main focus is helping achieve outcomes and find success in the cloud. |